1. Yijing
He
(Urban
Planning
&
Studies
Program)-‐URSP
688M
Final
Project
Report
How
to
Allocate
the
Limited
Park
Resource
of
Baltimore
City?
One
of
the
central
questions
of
urban
planning
is
“How
to
allocate
the
limited
resource
to
the
right
place?”
This
study
tried
to
address
the
issues
that
from
the
author’s
work
experience
of
Patterson
Park
Master
Plan
planning
process
involvement.
Patterson
Park
is
one
of
the
biggest
parks
with
various
functions
in
the
Baltimore
City.
Study
of
Patterson
Park
set
a
very
good
example
that
how
the
citizens
use
the
park
and
what
kinds
of
issues
occurs.
The
top
two
issues
that
the
park
users
most
concern
as
follows:
Facility
Issue:
The
park
facilities
is
crpwded
especially
those
for
daily
used.
Enforcement
Issue:
Poor
enforcement
of
the
park
rules.
The
target
of
the
study
is
trying
to
address
these
two
“bottom
to
top”
issues
by
using
GIS
spatial
analysis.
The
two
topics
will
be
discuss
respectively.
Part
A
Facility
Issue:
Where
the
Playground
Should
Go?
Table
1:
Park
Usage
of
Patterson
Park
Activity
Walking
Distance
Preference
Peak
Hours
Weekdays
Weekends
Daily
Activity
No
Facility
Needed
Relaxing
5-‐10
mins
After
4
pm
Whole
day
Walking
After
4
pm
Running/Jogging
Morning
and
after
4
pm
Facility
Depended
Playground
15
mins
after
4
pm
Dog
Park
20
mins
Ater
4
pm
Senior
Center
Driving
Distance
Whole
day
Closed
Recreation
Center
Depend
on
the
Activities
After
school
program
and
evening
class
Weekly
Activity
Facility
Depended
Sport
League
Driving
Distance
6-‐9pm
Whole
day
Ice
Rink
(Winter)
Depend
on
the
reservation
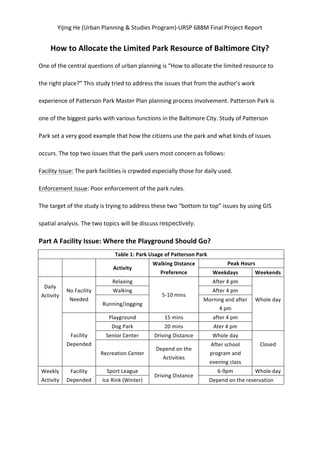
2. Yijing
He
(Urban
Planning
&
Studies
Program)-‐URSP
688M
Final
Project
Report
Table
1
indicates
the
park
usage
by
daily
and
weekly
activities
and
the
peak
use
hours
based
on
the
one-‐year
seasonal
surveys
of
Patterson
Park
and
various
in-‐depth
focus
group
interviews.
The
author
will
use
as
playground
as
an
example
for
the
reason
that:
1.
The
City
only
has
run
over
120
playgrounds
for
the
population
of
622,793
(2014
census
data).
Over
5,200
people
share
one
playground
and
still
lower
than
the
number
suggested
by
APA
Planning
Advisory
Service
Department.
2.Playground
is
the
most
heavily
used
facility
on
regular
basis.
Some
park
users
suggested
playground
is
“very
packed”
during
the
peak
hours.
It
is
usually
attract
the
children
and
students
from
the
area,
but
sometimes
also
attract
people
from
“driving
distance”.
It
will
lead
the
parking
issue
around
the
park.
3.
The
other
daily
use
facility
can
apply
the
same
method.
Therefore,
this
study
will
try
to
find
out
the
playground
allocation
within
the
walking
distance.
Data
and
Study
Area
The
study
area
is
Baltimore
City
and
used
the
“block”
as
the
analysis
unit
since
the
study
will
try
to
allocate
the
playground
within
walking
distance.
The
data
sources
include
OpenBaltimore
and
self-‐collect
data
from
Patterson
Park
study.
Methodology
and
Result
The
first
part
of
this
study
is
to
located
playgrounds
in
the
existing
parks.
The
author
applied
“Location-‐Allocation”
model
to
address
the
facility
issue.
3. Yijing
He
(Urban
Planning
&
Studies
Program)-‐URSP
688M
Final
Project
Report
Figure
1
The
first
step
is
to
set
up
demand
point
and
facility.
The
author
used
“residential
block”
as
demand
point.
Based
on
the
APA
guide,
the
standard
size
of
playground
is
5,000
sq.
ft.
and
should
leave
extra
space
for
open
space
and
other
facilities.
Thus
the
author
only
select
the
269
existing
park
that
larger
than
15,000sq
ft.
as
the
“potential
facility”.
(See
as
Figure
1)
The
self-‐collect
data
(see
table
1)
indicate
that
the
park
users
are
preferred
to
get
the
park
within
15
minuets
walking
distance
(0.7
mile)
thus
the
author
use
0.7
miles
as
impedance
cut
off.
4. Yijing
He
(Urban
Planning
&
Studies
Program)-‐URSP
688M
Final
Project
Report
Figure
2
Figure
2
showed
the
result
after
run
the
Location-‐Allocation
Model
(type:
“minimum
facility
required”).
There
are
137
parks
selected
as
candidate
to
put
playground
in
order
the
service
area
can
are
within
15
minutes
walking
distance.
The
purple
polygons
show
the
service
area.
It
is
clear
to
see
that
lots
residential
blocks
are
out
off
the
service
area,
so
cannot
access
the
playground
within
15
minutes
walking
distance.
Therefore,
the
second
part
of
the
facility
issue
is
“Where
to
put
a
new
playground?”
The
author
also
use
“Location-‐
Allocation”
model
to
address
the
question.
The
author
selected
the
“playground
needed
area
that
have
higher
population
density
((poo
density
5. Yijing
He
(Urban
Planning
&
Studies
Program)-‐URSP
688M
Final
Project
Report
higher
than
13
/acre)
as
“Solution
Area”
in
order
to
focus
on
the
area
that
have
higher
needs.
The
author
select
“qualified
undeveloped
area”
that
larger
than
15,000sq
ft
as
potential
facility.
(see
figure
3)
Figure
4
indicated
the
model
selected
17
lots
could
be
put
new
playground.
The
result
show
that
some
new
playgrounds
only
can
serve
few
residential
blocks.
The
author
will
discuss
the
result
and
limitation
in
the
last
part.
Figure
3
6. Yijing
He
(Urban
Planning
&
Studies
Program)-‐URSP
688M
Final
Project
Report
Figure
4
Part
B
Enforcement
Issue:
Where
should
the
Park
Ranger
go?
Even
the
city
park
condition
are
improving
these
years,
the
park
users
are
still
brother
by
the
issues
such
as
“parking
without
permit”,
“littering”,
“drug
sell”
,
“not
pick-‐up
dog
poop”
and
so
on.
Besides
the
regular
police
patrol,
another
important
authority
who
in
charge
of
park
rule
is
park
ranger.
As
for
the
fact
that
the
city
has
very
limited
number
of
park
rangers,
it
is
important
to
reasonably
located
the
park
ranger
at
the
right
space
during
the
right
time.
Table
1
indicates
that
the
peak
hour
of
the
park
will
be
heavily
used
after
school,
it
will
also
imply
the
higher
chance
that
someone
will
break
the
park
rule
during
that
period
of
time.
7. Yijing
He
(Urban
Planning
&
Studies
Program)-‐URSP
688M
Final
Project
Report
Therefore,
this
study
will
focus
on
“where
should
the
park
ranger
go
during
the
peak
hours”.
Data
and
Study
Area
The
study
will
focus
on
the
city-‐wide
analysis
fist
and
then
close
up
the
study
area
around
the
Patterson
Park.
The
data
source
is
same
with
part
A.
Methodology
and
Result
Figure
5
The
study
will
use
“Hotspot
Analysis”
to
find
out
the
“hot
zone”
that
in
need
of
park
enforcement
during
the
peak
hours.
Base
on
the
knowledge
from
Patterson
Park
study,
the
author
found
the
park
near
the
afterschool
program
and
facility
are
more
attract
to
the
park
8. Yijing
He
(Urban
Planning
&
Studies
Program)-‐URSP
688M
Final
Project
Report
users
during
the
peak
hours
for
the
reason
that:
1.many
parents
are
bring
their
children
to
the
park
when
they
off
the
work.
2.
Children
will
join
the
afterschool
program
after
4
pm.
Afterschool
program/facility
include
library,
recreation
center
and
the
school
itself.
Figure
5
shows
all
these
facilities
in
the
city.
Figure
6
The
author
selected
“Distance
from
park
to
the
afterschool
program/facility”
as
variable
to
run
“Hotspot
Analysis”
and
the
result
shown
as
figure
6.
The
park
in
red
indicated
in
need
of
park
rangers
during
the
peak
hours.
As
the
author
mentioned
before,
another
variable
to
refine
this
hotspot
map
it
to
check
the
whether
the
park
has
the
“attractive
point”
such
as
9. Yijing
He
(Urban
Planning
&
Studies
Program)-‐URSP
688M
Final
Project
Report
playground,
dog
park,
sport
field
and
so
on.
What
is
more,
the
patrol
of
park
ranger
is
a
kind
of
“point
to
point”,
it
is
necessary
to
have
a
closer
up
to
have
a
detail
analysis.
Figure
7
show
the
area
of
the
Patterson
Park.
The
author
refine
the
hotspot
map
by
ground
checking
and
highlight
the
park
within
the
red
area
and
have
the
“attractive
point”
mentioned
above.
This
map
can
be
a
guideline
for
not
only
park
ranger
but
also
for
the
maintenance
team
to
have
a
better
idea
to
prioritized
the
park
in
need
of
clean
up
and
maintain.
Figure
7
Discussion
In
this
study,
the
author
was
trying
to
address
the
issues
from
the
need
of
users,
in
other
works,
“from
the
bottom
to
top”.
The
GIS
spatial
analysis
is
a
good
tool
to
address
issue
on
10. Yijing
He
(Urban
Planning
&
Studies
Program)-‐URSP
688M
Final
Project
Report
the
larger
level
but
have
many
limitations
on
the
issues
on
the
smaller
scale
for
the
reason
of
data
limitation.
The
data
on
the
smaller
scale
such
as
the
location
of
playgrounds
and
the
park
with
playgrounds
is
less
available.
Use
the
enforcement
issue
study
as
an
example,
the
program
that
list
all
afterschool
program
will
be
improve
the
analysis
remarkably.
What
is
more,
the
hotspot
analysis
only
can
take
one
variable
into
account
and
ignore
the
rest
important
variable
that
cannot
be
quantized.
However,
GIS
still
a
powerful
tool
to
address
the
question
that
“How
to
allocate
the
limited
resource
to
the
right
place?”
but
definitely
cannot
provide
the
ideal
answer.
As
for
the
reasons
listed
above,
to
address
the
issue
that
“from
bottom
to
top”,
the
lesson
from
this
study
is
“Ground
Check/first
hand
is
necessary.
Experience
is
essential”.