Presentation1, radiological application of diffusion weighted mri in neck masses.
•Télécharger en tant que PPTX, PDF•
11 j'aime•1,618 vues

Health&Medicine

Recommandé
Contenu connexe
Tendances
Tendances (20)
Similaire à Presentation1, radiological application of diffusion weighted mri in neck masses.
Similaire à Presentation1, radiological application of diffusion weighted mri in neck masses. (20)
Plus de Abdellah Nazeer
Plus de Abdellah Nazeer (20)
Dernier
Dernier (20)
Presentation1, radiological application of diffusion weighted mri in neck masses.
- 1. Radiological application of Diffusion-weighted MRI in neck masses. Dr/ ABD ALLAH NAZEER. MD.
- 2. Extracranial application of diffusion-weighted magnetic resonance imaging (MRI) has gained increasing importance in recent years. As a result of technical advances, this new non-invasive functional technique has also been applied in head and neck radiology for several clinical indications. In cancer imaging, diffusion-weighted MRI can be performed for tumour detection and characterization, monitoring of treatment response as well as the differentiation of recurrence and post-therapeutic changes after radiotherapy. Even for lymph node staging promising results have been reported recently. This review article provides overview of potential applications of diffusion-weighted MRI in head and neck with the main focus on its applications in oncology.
- 3. DWI allows differentiation of benign and malignant head and neck masses in adults and children with significantly lower ADC values in malignant lesions compared with benign masses. In addition, the ADC values in lymphomas are significantly lower than those of squamous cell carcinoma. DWI is helpful in predicting and monitoring treatment response in head and neck tumours, as changes in ADC precede changes in tumour size. An increase in ADC early after initiation of treatment without any decrease during treatment is correlated with complete response as shown in several studies. DWI might allow prediction of outcome at an early time point and might therefore be helpful in individualizing treatment. For the differentiation between recurrent tumour and post-therapeutic changes, qualitative and quantitative assessment using DWI seems to be helpful in resolving this diagnostic dilemma. For lymph node staging the ADC values of lymphomas were significantly lower compared with those of metastases of squamous cell carcinoma. The ADC values of malignant nodes were significantly lower than those reported in benign cervical nodes. A comparison with morphologic images is mandatory to exclude necrotic areas from measurement because these might lead to a false higher ADC values.
- 4. DWI in the head and neck has a wide variety of clinical applications with a special focus on oncology. However, attention has to be paid to the choice of b-values and has to be taken into account when comparing findings in the literature and when performing follow-up studies. A comparison between DWI findings and morphologic images is a prerequisite for correct image analysis and interpretation. When measuring the ADC, necrotic areas frequently encountered in squamous cell carcinomas of the head and neck have to be avoided. To successfully perform DWI of the head and neck, a good collaboration between radiologists, physicists and clinicians is a prerequisites for the best management of the patient. In addition, larger scale studies for the different applications of DWI in the head and neck should be performed ideally in multicenter trials to confirm the promising results already published.
- 5. Coronal DWI B600 MIP demonstrating normal restricted diffusion.
- 6. Axial DWI B600 showing normal restricted diffusion in left parotid. Axial DWI B600 showing normal restricted diffusion in cervical lymph. DWI B600 showing abnormal facilitated diffusion associated with.
- 7. Axial MR images of a 52-year-old male with a fibrolipoma in the left-sided autochthonous muscles of the neck (arrows).
- 8. Axial STIR, DWI and ADC map of incidental benign retropharyngeal cystic lesion.
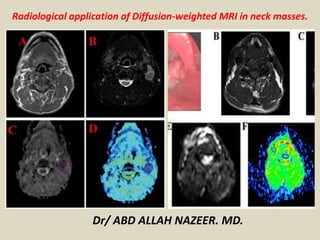
- 9. Axial MR images of a 62-year-old female patient with an inflammatory pseudotumor in the right pterygopalatine fossa and adjacent infratemporal fossa (asterisk) (A) T2-w image showing hyperintense signal in the right pterygopalatine and adjacent infratemporal fossa. (B) T1-w image before contrast shows low signal intensity in the same area and (C) T1-w fat sat image after injection of contrast media, which shows strong homogenous contrast enhancement. (D) High b-value DW-MR image showing absence of high signal intensity in the same area, indicating an absence of diffusion restriction.
- 10. Axial STIR and ADC map images showing high T2 signal associated with pleomorphic adenoma.
- 11. Pleomorphic adenoma of the parotid gland. (a) Axial T2-weighted image (T2WI) shows a mass in the left parotid gland; (b) the lesion shows low signal intensity on DWI; and (c) the mass is hyperintense on the ADC map (ADC value of 1.55 × 10⁻³ mm2/s).
- 12. Second branchial cleft cyst. (a) Axial T2WI shows a unilocular cystic mass in the left carotid space; (b) the lesion shows low signal intensity on DWI; and (c) the lesion is hyperintense on the ADC map (ADC value of 2.02 × 10⁻³ mm2/s).
- 13. Axial STIR , Axial T1WI, DWI and ADC images of right-sided Warthin tumor with characteristic mixed low.
- 14. Warthin tumor. (a) Axial T2WI showing the mass localized in the superficial lobe and spreading into the deep lobe of the left parotid gland; (b) the lesion shows high signal intensity on DWI; and (c) the lesion is hypointense on the ADC map (ADC value of 0.88 × 10⁻³ mm2/s) and the tumor was falsely diagnosed as a malignant lesion.
- 15. Axial STIR, Axial enhanced T1WI, DWI and ADC map images of bacterial tongue abscess post treatment for SCC.
- 16. A 54-year-old man with cancer of the posterior part of the tongue on the right. (a) T2-weighted axial MR image showing a slightly hyperintense lesion on the right-side of the tongue (arrow). (b) DW image at a b-value of 1000 s/mm2 clearly depicts the tongue tumour as a hyperintense lesion (arrow) without crossing the midline. (c) The same lesion is slightly hypointense on the calculated ADC map (arrow, ADC = 1.03×10⁻³ mm2/s). Note the small lymph node (4 mm) at level II on the right (arrowhead) which is bright in (b) and dark in (c) with an ADC value of 0.74×10⁻³ mm2/s suspicious for the presence of a metastasis, which has been confirmed by histology.
- 17. A 61-year-old woman who underwent resection of a small retroauricular adenoid cystic carcinoma 6 months prior to imaging. (a) Axial T1-weighted contrast-enhanced fat saturated MR image shows post-treatment changes with an unchanged small retroauricular soft tissue mass (arrow) over time. (b) DW image at a b-value of 1000 s/mm2 depicts this lesion as hyperintense with a low signal on the corresponding ADC map (c) (ADC = 0.82×10⁻³ mm2/s) suspicious for residual tumour. This has been confirmed by histology.
- 18. A 79-year-old man who underwent left parotidectomy (arrow) for an acinic cell carcinoma. Imaging for newly developed facial nerve paralysis on the left. (a) Axial T1-weighted contrast-enhanced fat saturated MR image shows post-treatment changes after left parotidectomy. (b) DW image at a b-value of 1000 s/mm2 shows a circumscribed hyperintense lesion along the facial nerve (arrow) corresponding to a hypointense lesion on the ADC map with an ADC value of 0.75×10⁻³ mm2/s suspicious for recurrent tumour. Biopsy was performed and histology revealed recurrent acinic cell carcinoma.
- 19. Axial T1+Gadolinium, DWI and ADC Map images showing high grade SCC of right tonsil.
- 20. DWI and ADC map showing necrotic nodal mass with associated mixed diffusion.
- 21. Axial STIR, T1WI, DEI and ADC MAP images showing large left sided nasopharyngeal carcinoma.
- 22. Undifferentiated nasopharyngeal carcinoma. (a) Axial T2WI shows bilateral metastatic cervical lymph nodes; (b) lymph node, on the left side of the neck, shows high signal intensity on DWI; and (c) the mass is hypointense on the ADC map (ADC value of 0.91 × 10⁻³ mm2/s).
- 23. Axial T1+Gadolinium, DWI and ADC map of diffuse large B-cell lymphoma centered on the right tongue.
- 24. DWI B600 and ADC map from a patient with previously treated right tonsil SCC.
- 25. Lymph node staging Nodal metastasis is an adverse prognostic factor in patients with head and neck squamous cell carcinoma, therefore its detection is important for therapy planning. To date, the diagnosis of lymph node metastases is mainly based on size criteria and morphology; however, micrometastases can also be observed in normal-sized nodes, and reactive nodes can also be enlarged. Promising results using DWI to detect cervical lymph node metastases and to differentiate benign from malignant enlarged lymph nodes have been reported. In general the ADC values in nodal metastases of squamous cell carcinoma were significantly lower compared with benign lymph nodes. Furthermore, DWI shows significant differences among malignant nodes of squamous cell carcinoma and lymphoma with significantly lower ADC values in lymphoma compared with squamous cell carcinoma. Although ADC threshold values can help to distinguish squamous cell carcinoma from lymphoma, when looking at nasopharyngeal carcinoma quite a big overlap between lymphoma and squamous cell carcinoma has been reported. In a previously published study of 87 enlarged cervical lymph nodes the ADC values of lymph nodes involved by lymphoma were lower than those in metastatic lymph nodes of squamous cell carcinoma and in benign lymph nodes; however, there was an overlap between these groups for individual patients. Although these findings were quite promising, larger scale studies have to be performed to confirm these results and to allow DWI to differentiate benign and malignant lymph nodes in the individual patient.
- 26. An 83-year-old man with bilateral enlarged neck lymph nodes. (a) DW image at a b-value of 1000 s/mm2 shows enlarged hyperintense nodes (arrows) at level II on both sides. (c) These lymph nodes are dark on the corresponding ADC map (arrows) with a mean ADC value of 0.56×10⁻³ mm2/s suspicious for the presence of a lymphoma. Histology depicted a B-cell lymphoma.
- 27. Non-Hodgkin’s lymphoma. Axial b0 (A), b1000 (B) and apparent diffusion coefficient map are showing multiple enlarged neck nodes. Nodes are showing slightly hyperintense signal on b0 images and retaining their signal on b1000 image with low signal on corresponding ADC (C). ADC: Apparent diffusion coefficient.
- 28. Axial MRI images of an 88-year-old male with lymphoma of the right mandible (arrows).
- 29. Squamous cell carcinoma in right anterior floor of mouth and tongue of 52-year-old man scheduled to undergo surgery. (a) Axial T2-weighted turbo spin-echo (3080/106) MR image shows lymph nodes posterior to submandibular glands on right (arrow; 8-mm node) and left (arrowhead; 9- mm node) sides. (b, c) These lymph nodes are hyperintense on spin-echo echo-planar DW images (7400/84) obtained with b values of (b) 0 and (c) 1000 sec/mm2. (d) The nodes have intermediate signal intensity on ADC map. ADCs of the nodes were 1.25 × 10⁻³ mm2/sec for the right node and 1.08 × 10⁻³ mm2/sec for the left node, which is above the threshold for malignancy in previously published studies. Histopathologic examination confirmed that no metastatic deposits were present in these lymph nodes.
- 30. Squamous cell carcinoma in right base of the tongue of 40- year-old man. (a) Axial T1-weighted contrast-enhanced fat- saturated turbo spin-echo (773/8.7) MR image shows necrotic adenopathy in level II on right side (arrowheads) and enhancing retro-jugular small (6-mm) lymph node (arrow). (b–d) Lymph node is hyperintense on spin-echo echo-planar (7400/84) DW images obtained with b values of (b) 0 and (c) 1000 sec/mm2 but is quite hard to see on the (d) ADC map. ADC of this lymph node was 0.84 × 10⁻³ mm2/sec, which is suspicious for nodal metastasis, which was later confirmed at histopathologic examination as metastasis from primary squamous cell carcinoma.
- 31. Squamous cell carcinoma of base of the tongue and metastatic nodes in 58-year-old man. Axial (a) T1-weighted contrast-enhanced turbo spin-echo (750/9.5) MR image shows bilateral metastatic cervical nodes (arrows), which show restricted diffusion on (b) spin-echo echo-planar (2000/75, b values of 0–500 sec/mm2) ADC map (ADC = 0.85 × 10⁻³ mm2/sec).
- 32. Non-Hodgkin lymphoma (B-cell lymphoma) of nasopharynx and bilateral lymphadenopathy in 51-year-old woman. Axial (a) T1-weighted contrast-enhanced turbo spin-echo (750/9.5) MR image shows bilateral lymphomatous nodes (arrows), which show restricted diffusion on (b) spin-echo echo-planar (2000/75, b values of 0–500 sec/mm2) ADC map. ADC in these nodes was 0.64 × 10⁻³ mm2/sec, which is even lower than that of the squamous cell carcinoma in previous images.
- 33. Squamous cell carcinoma of the hypopharynx (arrow), which was successfully treated with combined chemo- and radiation therapy without any relapse 2 years after treatment, in 58- year-old man. Pretreatment axial (a) contrast-enhanced T1- weighted turbo spin-echo (750/9.5) MR image shows tumor involving left side of the hypopharynx (arrow) and (b) displays restricted diffusion on ADC map from spin-echo echo-planar (2000/75; b values, 0–500 sec/mm2) MR images, with ADC of 0.86 × 10⁻³ mm2/sec. (c) Axial contrast-enhanced T1-weighted (750/9.5) MR image obtained 2 weeks after start of treatment shows no change in tumor size. (d) However, ADC map from spin-echo echo-planar (2000/75; b = 0–500 sec/mm2) MR images indicates important increase in ADC up to 1.2 × 10⁻³ mm2/sec.
- 34. Squamous cell carcinoma of the hypopharynx (arrows), which showed residual cancer after combined chemo- and radiation therapy, in 52-year-old man. Pretreatment axial (a) contrast-enhanced T1-weighted turbo spin-echo (750/9.5) MR image shows tumor involving right side of hypopharynx and (b) displays restricted diffusion on ADC map from spin-echo echo-planar (2000/75; b values, 0–500 sec/mm2), with ADC of 0.90 × 10⁻³ mm2/sec. (c) Axial contrast-enhanced T1-weighted (750/9.5) MR image obtained 6 weeks after treatment shows residual mass and (d) retained restricted diffusion on ADC map from spin- echo echo-planar (2000/75; b = 0–500 sec/mm2) MR images, with only slight ADC increase to 0.98 × 1023 mm2/sec.
- 35. Transglottic tumor in 65-year-old man who underwent radiation therapy. (a) Axial contrast-enhanced fat-saturated T1-weighted turbo spin-echo (691/8.3) MR image at Subglottic level obtained 8 months after treatment shows circumferential swelling in the area of the subglottic larynx (arrows), typical of radiation therapy change. (b) MR imaging was performed again 3 months later when the patient presented with newly developed pain. Cricoid cartilage destruction and an adjacent soft-tissue mass (arrow), suggestive of recurrent cancer, were seen. (c) On DW spin-echo echo-planar (7400/84; b values, 0–1000 sec/mm2) MR image obtained with b = 1000 sec/mm2, no hyperintense signal is noted. (d) Corresponding ADC map shows high signal intensity at this level (arrow) with high ADC, suggestive of post-therapeutic changes. Biopsy results were negative, and clinical and radiologic follow-up after more than 1 year did not show any sign of recurrence.
- 36. (a) Axial T1-weighted turbo spin-echo (691/8.3) MR image at level of the vocal cords in 72-year old man who underwent chemo- and radiation therapy for supraglottic laryngeal carcinoma on the left 8 years previously shows hypointense signal alteration of thyroid cartilage on both sides (long arrows) and of arytenoid cartilage on the left (short arrow). Patient presented with newly developed otalgia. (b) DW spin-echo echo-planar (7400/84; b values, 0–1000 sec/mm2) MR image obtained with b = 1000 sec/mm2 shows hyperintense lesion on left vocal cord involving the anterior commissure. (b) Lesion is hypointense on corresponding ADC map, with ADC = 1.08 × 10⁻³ mm2/sec, suggestive of tumor recurrence. Biopsy results confirmed recurrent squamous cell carcinoma.
- 37. Images of non-Hodgkin lymphoma (diffuse large B cell, intermediate grade) in the right parotid gland in a 37-year- old man in whom the diagnosis was true-positive. (a) Transverse T2- weighted fast spin-echo MR image (3,000/72, with two signals acquired) shows a homogeneous mass (arrows) with intermediate signal intensity in the right parotid gland. (b) Transverse diffusion- weighted echo-planar MR image obtained with a b factor of 0 sec/mm 2 shows the mass (arrow) with high signal intensity. (c) Transverse diffusion-weighted MR image obtained with a b factor of 1,000 sec/mm 2 shows a slight decrease in signal intensity of the mass (arrow). (d) Transverse ADC map shows that the ADC value of the mass (arrow) is 0.67 ϫ 10 Ϫ 3 mm 2 /sec, which is lower than the threshold value, and the lesion was correctly diagnosed as a malignant lesion.
- 38. Non-Hodgkin lymphoma. (a) Axial T2WI shows metastatic cervical lymph node nearby SCM; (b) the lymph node, on the right side of the neck at level of lateral cervical region, shows high signal intensity on DWI; and (c) the mass is hypointense on the ADC map (ADC value of 0.62 × 10⁻³ mm2/s).
- 39. MRI of the neck (A) Axial T1WIs, (B) Axial T2WIs, (C) sagittal T1WIs post contrast, (D) DWIs, (E) ADC map. Infiltrative mass involving the left pterygoid muscles and left parotid both lobes. It showed low signal on T1WIs, heterogeneous bright signal on T2WIs, heterogenous marked enhancement. Qualitative DWIs showed restricted margin and facilitated center. ADC value within the lesion = 1.238 × 10⁻³ cm2/s. Histopathology revealed rhabdomyosarcoma.
- 40. Thank You.