1. ITC 571 Emerging Technologies & Innovation Final Project Report
Abhinay Reddy Singaiahgari 11564841
Assessment Item – 4
Capstone Project Report and Seminar
Managing Delivery of Tertiary Education in Australia: Partnership management in Australia
Public and Private Universities
Name: Abhinay Reddy Singaiahgari
Student Id: 11564841
Subject Code: ITC 571
Subject: Emerging Technologies and Innovation
Class Time: Tuesday 1pm – 4pm
Tutor: Dr. Malka N. Halgamuge
2. ITC 571 Emerging Technologies & Innovation Final Project Report
Abhinay Reddy Singaiahgari 11564841
Title:
Managing Delivery of Tertiary Education in Australia – Levels in delivery of higher
education in regard to Partnership management between Australian public and private
universities.
1. Introduction
We investigated the levels of delivery of tertiary education in Australia from statistical
analysis of Australian Public and Private Universities staff, students, funding sources to
Universities and graduate outcomes. Specifically this report will analyze the effects of Quality
management (QM) practices on desired in meeting of key areas like tertiary education,
globalization, demand and supply, funding schemes and International Education and implementing
various new economic programs and identity domestic and International programs and policies at
OECD (Organization for Economic Co-operation and Development) and coordinate to stimulate
economic progress to have well diverse Education System growth to have keen interest on tertiary
education in Australia for international & domestic students and to have potential tremendous
change in knowledgeable areas of research Employees staff in the universities to provide higher
education for students to meet the standards of Tertiary Education Quality and Standards Agency
(TEQSA) who are stake holders of education system. In our investigations government need to
meet key demand areas for having well developed economic progress of Education system to be
globalized. In total 104 measurements were taken for analysis of Higher education system in
Australia and OECD countries and results show highest and lowest values measured within a range
of 63,493 – 1,373,230 of staff/students in Higher Education Universities and highest and lowest
values measured within a range of 12,224 – 29,596,475 million ($) expenditure funding on Higher
Education Public and Private Universities. The stake holders who involve in this paper are
students, staff, business and government. Relying on the Questionnaire primary data was collected
from higher education real data websites of Australia and OECD statistics from OECD data
websites to have basic structured equation modelling. This report examines the results which
include Quality management practices and stake holder interests and expenditure need to spent by
government on PPP’s management to have stronger relationship of Public and Private partnership
education universities in Australia and analysis of graphs growth of staff and students in public
and private universities and government funding on tertiary education to have globalized
3. ITC 571 Emerging Technologies & Innovation Final Project Report
Abhinay Reddy Singaiahgari 11564841
economic progress in country to have more students to have international education in Australia
among OECD countries for fulfilling the stakeholder interests.
Project Blog Web Address: https://arscsu.wordpress.com/
2. Literature Review
Australia is a federation of 6 States and 2 territories. The Australian Higher
Education system consists of independent, self – Governing public and private universities to
award high Quality of Education subject of 38 Public and 3 Private universities. The Higher
Education providers as per National register July 2015 consisting of 49 SAA (Self-Accrediting
Authority) and 123 non-SAA (Boer, 2013). The Self Accrediting Authorities are evaluated by the
Australian Universities Quality Agency (AUQA) to check Institutional System activities for
approving new programs to develop emerging and substantial partnership between Private &
Public universities to meet the demand of key areas like tertiary education, Globalization, demand
and supply , funding schemes and international education and to implement new economic
programs and to coordinate and identity domestic and International programs and policies at
OECD (Organization for Economic Co-operation and Development) to stimulate Economic
progress to have an education System growth since there is an increase of International & domestic
students for tertiary education who want to seek for globalized education in Australia (Stella,
2011).
According to the research the paper argues that to meet the demand on new economic
programs implementation on higher education and to meet demands on globalization, demand &
supply of International education with the Quality framework having International programs
collaborating with public and private universities to have more students interest on tertiary
education system in Australia to have a challenge in economic growth among the OECD Countries.
The affiliation of Public and Private organizations to provide Quality framework Regulatory
standards to set up a new trend in Education by forming PPP (Public Private Partnerships)
approach where the private sectors incorporate services like finance, design, construction, facilities
management and maintenance administration services as per demand of Quality of Education in
Australia since there are more students who want to seek for globalized Education in Australia.
4. ITC 571 Emerging Technologies & Innovation Final Project Report
Abhinay Reddy Singaiahgari 11564841
The student number seeking Higher education at Australian Universities are Domestic 985,117
and International 328,659 where 25% of International students as per database of Australian
Government 2014 tend to have exceptional change of Education students want to study in
Australian hold greater amount of International Students. The final part of the paper will highlight
the statistics of higher education maintaining the series of Information of student and staff data for
tremendous change in knowledgeable areas of research Employees in the universities to provide
higher education for students with requirements of globalization of Education and finally to meet
the standards of Tertiary Education Quality and Standards Agency (TEQSA) established by 2011
which will incorporate AUQA (Australian Universities Quality Agency) take over the system of
state and territory GAA’s to meet the service standard benchmarks as per the requirement of
Education higher standards for globalization of Australian Education System to make the future
trend students to have great opportunities to have their Tertiary education to improve their Quality
Standards in Australia (Woodhouse, 2011).
Tertiary Education system which is broadly recognized as Core base of Education
system which is expected to produce a workforce factor that can compete and excel in a quickly
changing environment and enhances country’s economy (Okoye,2013) Private Public Partnership
(PPP) is considered as an alternative strategy to move forward to address the challenges
confronting all-important education system. Therefore, this paper attempts to add to the available
literature on Public Private Partnerships in Tertiary Education by examining; conceptualizing
Public Private Partnerships and its value in economic growth, Tertiary Education for technological
advancement growth in Australia through Public Private Partnership collaboration (Okoye, 2013).
Public-Private Partnerships (PPPs) in Governments which are regarded for infrastructure
development. The aim of this study is to investigate the relationship between organizational culture
and the readiness to implement PPP’s. Conceptualized adhocracy market orientation, Optimism,
Innovative, Discomfort and Insecurity were used to PPP’s readiness (Roosli, 2015).
An aim for student is the successful acquisition and application of new knowledge skills
and competencies for industry organizations to identify challenges in based economy and
emerging applied professions, to address them in a professionally thoughtful yet strategic manner.
The ability to adapt to continuous change, Terpestra (1996) will be one of the essential ingredients
5. ITC 571 Emerging Technologies & Innovation Final Project Report
Abhinay Reddy Singaiahgari 11564841
in high quality employees who contribute to organizational success. Confidence enhanced through
continuing professional development and learning, people in the workforce to adapt to and manage
inevitable change (Breen, 2001).
“The provinces to implement Public Private Partnership management are:
1. Sufficient time and resources to dedicate to PPP’s.
2. The knowledge ability to manage a PPP transaction.
3. The Authority to make critical decisions in managing PPP’s” (Nell, 2007).
Public–private partnership (PPP) in education between the public and a private entity in
any aspect of education provision & management (Patrinos, 2009). The policy of international
educational development is the rising demand for education that Governments are unable to meet
without collaborating with private providers of Education (Sosale, 2007). Under the concept of the
co-management model, the Public and Private Partner oversee the delivery of the technical tertiary
education. Both Partners are in constant communication, and they participate in the decision-
making process of both ends of the delivery system (Chattopadhay, 2014). Quality management
principles are globally adopted by organizations deploying various activities to all domains as they
prove the permanent focus on clients’ requirements and needs, continuous improvement and trust.
The sector of higher education world critic’s rise in connection to perform the quality management
system brings to universities and higher education processes to have globalized education for
making trust to get International Students (Maiorescu, April 2015).
Higher Education Universities are not only places where students and professors are
meeting to transfer ultimate goal system of education. It is required to have an evaluation regarding
learning Quality services to have Globalized Education to make students come to Australia and
making interest on domestic students for Tertiary Education with respective Quality Standards
having High Quality Professors with certain Technical Skills making demands of education in
terms of flexible, mobile and digital Education (Maiorescu, 2015).
6. ITC 571 Emerging Technologies & Innovation Final Project Report
Abhinay Reddy Singaiahgari 11564841
The ideological demands in terms of Public and private partnerships to concentrate on the
competencies of staff to seek their cost efficient operations to have public value model to achieve
provinces of Services in terms of improvement of creation and management (Taseska, 2008).The
new representation of governing tools in terms of outsourcing, contracting out, privatization in
turn to have globalized education (Taseska, 2008).
“The types of PPP’s (Public Private Partnerships) currently exist in Australia and internationally
are:
1. Institutional cooperation for joint production and risk sharing
2. Long-term infrastructure contracts that emphasize tight specification of outputs in long-term
legal contracts
3. Public policy networks in which loose stakeholder relationships are emphasized” (Taseska,
2008).
Need to promote student mobility to have attractive and competitive research
Environments to train highly qualified human resources (Heitor, 2013). The emerging orientation
worldwide towards the internationalization of academic institutions has been associated with the
Economic, political and social changes pushed by the increasingly globalized society (Knight,
2008).Extending the notion of Triple Helix of university–government– industry relations to
consider the dynamic nature of innovation (Leydesdorff, 2000b) as a collective Process
(Mazzucato, 2013), involving different stakeholders at an international level, is a critical step to
improve our understanding of global university partnerships as agents of change. This is because
one must take up the challenge of probing deeper into the relationships between knowledge and
the development of our societies at a global scale.
The findings are read to suggest that way in which students are attending university for
education changing to have online based digital education system need to be implemented in
university. The online approach of education which has changed learning methods to have more
deliberate interest on education system to have popularity among higher education which has
influenced students to higher education. Despite the shift of change in teaching education on digital
basis still lecturers are not shifted for undergraduate students teaching style.
7. ITC 571 Emerging Technologies & Innovation Final Project Report
Abhinay Reddy Singaiahgari 11564841
The higher education sector in Australia which is rapidly evolving in education system in 1990’s
student enrolling to Australian universities where drastically increased from 15% to 40% by 2009
(Spence , 2014) which results to diversity in higher education concern for students to Australian
demand of education where even lecturers and professor’s need to be well advanced using digital
systems to meet Quality frameworks and Australian Government in turn need to have budget
importance on Education system to meet the demands on Public and private university teaching
staff to teach students.
The findings concur with the conclusion that from real based statistics of public and private
university teaching staff with respect to university students who pursuing their higher education in
public and private universities and rate of expenditure funding on high education in Australia by
Government to say that there should be more funding on demand and supply of education system
to meet the Internal program demands to have collaboration of public and private university
education providers to meet globalization of Education system. This argument is different from
other authors since they have more topics implemented on Quality frameworks of education
system but I elaborated with certain statistics so that if more students who come for education
system which will relatively help in growth of non-Education sector for company industrial
economy since we will get more talented system. Australia to have higher education to meet the
Quality demands in depends on Australia education investment by Government to promote the
economic growth worldwide to strengthen the education system for Education and non-education
sector.
8. ITC 571 Emerging Technologies & Innovation Final Project Report
Abhinay Reddy Singaiahgari 11564841
This paper generates managing delivery of tertiary education when compare to other
OECD countries in regard to commence of students for tertiary education and in terms of
expenditure in terms of quality values for staff and students to have globalized education to have
more demand of expenditure to implement on public and private university to have more students
to have interest on tertiary Education in Australia with respect to public and private university by
providing well diverse Quality of Public Private Partnership’s in delivery of Technical valued
Education to have seek for International Students and Government need to invest more on
Expenditure on Tertiary Education in relation with Public and Private based organizations to have
intense growth in turn to meet the demand of key areas like tertiary education, Globalization,
demand & supply and International Education and to implement new economic programs and to
coordinate and identity domestic and International programs and policies at OECD with respect to
other OECD Countries (Organization for Economic Cooperation and development) based on the
research of statistics of Australia Education with respect to other Economic Countries.
3. Reason and benefits
This research will analyze about the role of partnership of
delivery of tertiary higher Education in Australia among the partnerships of Public and private
universities. It will say how the system can be improved in terms of substantial management
solution of PPP (Public Private Partnership) relationship (Bozbura, 2011) for globalization of
education to students and satisfactory arrangements for staff as required and providing career
improvements in universities with relation to career improvements. Therefore this paper examines
other research papers and also of different countries providing higher education / tertiary education
in overseas says it’s how important it’s required to have merging and substantial development of
partnership between private and public universities for staff and students. Finally it explains how
beneficiary it will be for development of Education system in Australia for globalization and to
have good economic progress of the country.
9. ITC 571 Emerging Technologies & Innovation Final Project Report
Abhinay Reddy Singaiahgari 11564841
4. Materials and Methodology
The data is collected from real based Statistics of Higher Education,
Dept. of Education & Training Australian Government and OECD Statistics of Student and Staff
data from 2010 -2014 for the research of the improvement of emerging and substantial challenges
which are associated with Public private Partnership Approach of Higher Education System in
Australia with respect to corresponding OECD (Organization for Economic Co-operation and
Development) Countries of overseas education System.
The Real based Statistics for the data required for Higher education related are collected
from:
https://www.education.gov.au/higher-education-statistics
https://education.gov.au/student-data
https://education.gov.au/staff-data
http://www.abs.gov.au/ausstats/abs@.nsf/mf/5518.0.55.001
http://www.graduatecareers.com.au/wp-
content/uploads/2014/12/GCA_GradStats_2014.pdf
http://www.graduatecareers.com.au/wp-content/uploads/2012/01/gca002770.pdf
http://stats.oecd.org/viewhtml.aspx?datasetcode=RFOREIGN&lang=en
http://stats.oecd.org/Index.aspx?DatasetCode=RGRADSTY
Researches on other sites are:
https://www.google.com
http://www.theaustralian.com.au/higher-education
https://go8.edu.au/page/australian-higher-education-system
https://internationaleducation.gov.au/research/International-Student-
Data/Pages/InternationalStudentData2012.aspx#1
http://www.ncoa.gov.au/report/appendix-vol-1/9-13-higher-education.html
10. ITC 571 Emerging Technologies & Innovation Final Project Report
Abhinay Reddy Singaiahgari 11564841
4.1 Data collection excludes:
We have collected data excluding:
1. Government Funding of contents to particular education system in terms of technology ,
research, resources.
2. Data for different education domain fields like engineering, science, art etc.
5. Result & Discussion:
The result for statistics of higher education of Australian government and
OECD (Organization for economic cooperation and development) of public and private
universities education for students of Australia and OECD countries are collected for the future
prediction of education system to meet demand areas of education in Australia.
5.1 Data Analysis:
The data analysis is calculated for Higher Education tertiary students of public and
private universities, staff of universities and operating expenses by government to PPP’s
universities and students with employee graduates to have all relationship in turn to know the
development of commencement of students in Australia to have keen interest on Tertiary
Education in Australia. This in turn denotes there are should be spending more expenditure by
government to have research lecturers compared to other OECD countries in order to deliver
Quality framework of Higher Education in Australia where students will have more concern to
study in Australia and it will help business process to have economic growth as per the calculation
done from 2010 -2014PPP’s relationship to improve high Quality Key areas like demand & supply
of Globalization Education by providing all the high Quality frame work to staff so that they can
provide good education to students which is all set to development in all research patterns.
11. ITC 571 Emerging Technologies & Innovation Final Project Report
Abhinay Reddy Singaiahgari 11564841
1.
Higher Education Students Enrollment in Australia: The Students Enrolled for Higher
Education in Australia which has variable growth trend of values. The model is calculated for
future prediction of Enrollment of students in Australia.
Fig 1: The Higher Education Student Enrollment between 2010 – 2014
Table 1: Higher Education Student Enrollment model predicted values, R2 = 0.9994
Year Model predicted value
2015 1,272,300
2016 1,358,500
The model predicted value represents the positive growth. As the data shows from the year
2010 comparing with 2014 there is humorous growth but from 2014 to 2015 prediction
there will be drawback in student’s enrollment and again in 2016 it might increase but
enrollment is not reaching the enrollments which was done in 2014. This shows the growth
is constant slight positive growth.
1192657
1221008
1257722
1313776
1373230
y = 5824.7x2 + 10443x + 1E+06
R² = 0.9994
0
200000
400000
600000
800000
1000000
1200000
1400000
1600000
1800000
2000000
2010 2011 2012 2013 2014 2015 2016
NumberofStudents
Years of Student Enrollment
Higher Education student enrollment 2010 -2014
12. ITC 571 Emerging Technologies & Innovation Final Project Report
Abhinay Reddy Singaiahgari 11564841
2.
Public University Students Enrollment in Australia: In order to calculate public and private
partnership relation we have stated the statistics of public and private university student enrollment
so that they can take major pattern on investment to form economic progress of Education system
to have a good business process with PPP’s.
Fig 2: The Public University Students Enrollment between 2010 – 2014
Table 2: Public University Students Enrollment model predicted values, R2 = 0.9999
Year Model predicted value
2015 1,229,494
2016 1,294,588
The model predicted value represents the positive growth. As the data shows from the year
2010 comparing with 2014 there is slight growth from 2014 to 2015 prediction there is
improvement of more students enrollment and again in 2016 it might increase but
enrollment. This shows the growth is constant slight positive growth.
1111352
1137511
1171737
1215367
1263669
y = 3835x2 + 15239x + 1E+06
R² = 0.9999
0
200000
400000
600000
800000
1000000
1200000
1400000
1600000
1800000
2010 2011 2012 2013 2014 2015 2016
Numberofstudents
Years student enrollment
Public university students enrollment
2010 - 2014
13. ITC 571 Emerging Technologies & Innovation Final Project Report
Abhinay Reddy Singaiahgari 11564841
3.
Private University Students Enrollment in Australia: In order to calculate public and private
partnership relation we have stated the statistics of public and private university student enrollment
so that they can take major pattern on investment to form economic progress of Education system
to have a good business process with PPP’s.
Fig 3: The Private University Students Enrollment between 2010 – 2014
Table 3: Private University Students Enrollment model predicted values, R2 = 0.9887
Year Model predicted value
2015 127,110
2016 148,176
The model predicted value represents the positive growth. This shows there is enormous
growth of enrollment of students to public universities from 2010 to 2014 and model
predicted value denotes the growth is being double compared to 2010. It shows more
students are enrolling in private universities.
81305 83497 85985
98409
109561
y = 1989.7x2 - 4795.9x + 84252
R² = 0.9887
0
50000
100000
150000
200000
250000
2010 2011 2012 2013 2014 2015 2016
Numberofstudents
years students enrollment
Private University Students Enrollment
2010 - 2014
14. ITC 571 Emerging Technologies & Innovation Final Project Report
Abhinay Reddy Singaiahgari 11564841
4.
Higher Education teaching staff in universities in Australia: In order to have research
professors to provide good education to students to know the status of staff who are well diverse
teachers in PPP’s Universities.
Fig 4: The Higher Education Teaching Staff in Universities between 2010 – 2014
Table 4: Higher Education Teaching Staff in Universities model predicted values, R2 = 0.9882
Year Model predicted value
2015 123,330
2016 123,900
The model predicted value represents the positive growth. Teaching staff for the
requirement of more students as we have seen there are more students enrolling in public
and private universities but teaching staff is going in constant and future prediction value
which denotes positive growth but not up to level of system of ratio of students is more
where the staff is less comparing to 2010 – 2016.
110351
114271
118946
120136
122421
y = 28.333x3 - 737.5x2 + 6564.2x + 104370
R² = 0.9882
100000
105000
110000
115000
120000
125000
130000
2010 2011 2012 2013 2014 2015 2016
NumberofTeachingstaff
Years
Higher Education Teaching Staff in Universities
2010 - 2014
15. ITC 571 Emerging Technologies & Innovation Final Project Report
Abhinay Reddy Singaiahgari 11564841
5.
Government Operating Expenses on Primary & Secondary Education in Australia: To have
inbound statistics of government spending expenditure on primary and secondary Education with
respect to tertiary Education.
Fig 5: Government Operating Expenses on Primary & Secondary Education between 2009 - 2014
Table 5: Government Operating Expenses on Primary & Secondary Education model predicted
values, R2 = 0.8131
Year Model predicted value
2015 42,438
2016 42,991
The model predicted value represents the constant positive growth. This shows government
operating expenses shows greater expenses compared to 2009 and 2014 but future
prediction denotes there will be less down of expenses going on the way of partially
constant in 2016.
33105
39101 40166 38736 40625 41763
y = 4146.5ln(x) + 34369
R² = 0.8131
0
5000
10000
15000
20000
25000
30000
35000
40000
45000
50000
2009 2010 2011 2012 2013 2014 2015 2016
$(millions)
Years
Government OperatingExpenses on Primary & Secondary Education
2009 - 2014
16. ITC 571 Emerging Technologies & Innovation Final Project Report
Abhinay Reddy Singaiahgari 11564841
6.
Government Operating Expenses on Tertiary Education in Australia: The Expenditure which
turns to be invested on PPP’s by government on tertiary Education is calculated to see how the key
demands of PPP’s are satisfied.
Fig 6: Government Operating Expenses on Tertiary Education between 2009 – 2014
Table 6: Government Operating Expenses on Tertiary Education model predicted values, R2 =
0.9855
Year Model predicted value
2015 30,043
2016 30,416
The model predicted value represents the negative growth. This shows the growth is on
average increase from 2009 to 2014 compared to 2010 to 2016 predicted value there is not
much growth which helps in improvement of tertiary education requirements as to meet
the demand of key areas of education system.
23042 24215
26195
27447
29016 29185
y = -119x2
+ 2157.9x + 20769
R² = 0.9855
0
5000
10000
15000
20000
25000
30000
35000
2009 2010 2011 2012 2013 2014 2015 2016
$(millions)
Years
Government Operating Expenses on Tertiary Education 2009 - 2014
17. ITC 571 Emerging Technologies & Innovation Final Project Report
Abhinay Reddy Singaiahgari 11564841
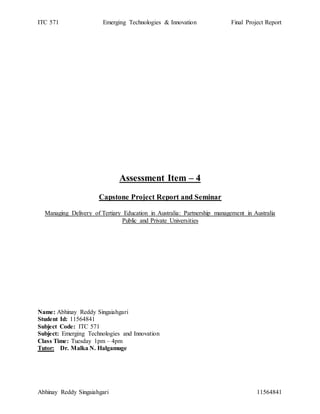
7.
Employment of Bachelor Degree Graduates in Australia: This shows Employment of bachelor
graduates who gain Employment after their Education in Australia which is partially increasing.
Fig 7: Employment of Bachelor Degree Graduates between 2008 - 2014
Table 7: Employment of Bachelor Degree Graduates model predicted values, R2 = 0.9335
Year Model predicted value
2015 75,546
2016 78,721
The model predicted value represents the positive growth. The bachelor graduates are less
when we compared to students who are completing education in Australia. It has less
periodic growth from 2008 to 2016 as per prediction.
64648
63493
65045
68205
67626
70373
72737
y = 191.57x2
- 82.286x + 63944
R² = 0.9335
0
10000
20000
30000
40000
50000
60000
70000
80000
90000
100000
2008 2009 2010 2011 2012 2013 2014 2015 2016
NumberofBachelorgraduatesgained
employment
Years of Employment for Bachelor Graduates
Employment of Bachelor degree Graduates in Australia 2008 - 2014
18. ITC 571 Emerging Technologies & Innovation Final Project Report
Abhinay Reddy Singaiahgari 11564841
8.
International Students commencing in Universities in OECD Countries: To compare the
commencement of Students in Organization for Economic Cooperation and development countries
to know the economic progress of Education system.
8 (a)
International Students Commencement in Australia
Fig 8(a): International Students Commencement in Australia between 2009 – 2013
Table 8(a): International Students Commencement in Australia model predicted values, R2 =
0.9961
Year Model predicted value
2014 298,919
2015 299,077
2016 299,213
The model predicted value represents the Positive growth. There is a growth of
commencement of students from 2009 to 2013 but as predicted value shows that there is
positive growth of future of commencement in Australia so government has to make sure
to have more staff and to meet key demand areas since students enrollment is going high
from 2016.
292545
307653
301643
291889
302976
y = 2357.9ln(x) + 297084
R² = 0.0474
280000
285000
290000
295000
300000
305000
310000
2009 2010 2011 2012 2013 2014 2015 2016
Numberofstudents
Years of student commencement
International Students Commencement in Australia 2009 - 2013
19. ITC 571 Emerging Technologies & Innovation Final Project Report
Abhinay Reddy Singaiahgari 11564841
8 (b)
International Students Commencement in Canada
Fig 8(b): International Students Commencement in Canada
Table 8(b): International Students Commencement in Canada model predicted values, R2 =0.9973
Year Model predicted value
2013 201,120
2014 202,674
2015 203,987
2016 205,125
The model predicted value represents the positive growth. There is huge growth in Canada
of commencement of students when the prediction value of 2016 denotes there is positive
growth from 2009 to 2016 respectively.
191202 195550 203823
221406
y = 19619 ln(x) + 187407
R² = 0.7813
0
50000
100000
150000
200000
250000
2009 2010 2011 2012 2013 2014 2015 2016
Numberofstudents
Years of student commencement
International Students Commencement in Canada
20. ITC 571 Emerging Technologies & Innovation Final Project Report
Abhinay Reddy Singaiahgari 11564841
8 (c)
International Students Commencement in France
Fig 8(c): International Students Commencement in France
Table 8(c): International Students Commencement in France model predicted values, R2 = 0.9944
Year Model predicted value
2013 275,610
2014 278,610
2015 281,160
2016 283,360
The model predicted value represents the peak positive growth. France prediction shows
there is commencement students is decreasing compared to 2009 to 2016 there is the
growth of students commencing in France. In the year 2013 there was little increase in
growth carried out in 2016.
249143
259935
268212
271399
y = 16487ln(x) + 249073
R² = 0.9944
230000
240000
250000
260000
270000
280000
290000
2009 2010 2011 2012 2013 2014 2015 2016
Numberofstudents
Years of student commencement
International Students commencement in France
21. ITC 571 Emerging Technologies & Innovation Final Project Report
Abhinay Reddy Singaiahgari 11564841
8 (d)
International Students Commencement in Germany
Fig 8(d): International Students Commencement in Germany
Table 8(d): International Students Commencement in Germany model predicted values, R2 =
0.9983
Year Model predicted value
2013 304,520
2014 325,550
2015 350,230
2016 378,560
The model predicted value represents the positive growth. The graph denotes there is large
growth of future commencement of students in Germany compared to 2009 to 2016 there
is great growth of commencement of students in Germany.
256719 263972 272797 287353
y = 1825.8x2
+ 943.95x + 254157
R² = 0.9983
0
50000
100000
150000
200000
250000
300000
350000
400000
450000
2009 2010 2011 2012 2013 2014 2015 2016
Numberofstudents
Years of student commencement
International Students commencement in Germany
22. ITC 571 Emerging Technologies & Innovation Final Project Report
Abhinay Reddy Singaiahgari 11564841
8 (e)
International Students Commencement in New Zealand
Fig 8(e): International Students Commencement in New Zealand
Table 8(e): International Students Commencement in New Zealand model predicted values, R2 =
0.9667
Year Model predicted value
2013 71,412
2014 71,620
2015 71,796
2016 71,948
The model predicted value represents the negative growth. The student’s commencement
in New Zealand from 2009 to 2013 is very average but from 2012 to 2016 there is little
growth but the future shows there is negative growth.
69763
70883
72796
73209
y = 2626.9ln(x) + 69576
R² = 0.948
66000
67000
68000
69000
70000
71000
72000
73000
74000
75000
76000
2009 2010 2011 2012 2013 2014 2015 2016
Numberofstudents
Years of student commencement
International Students commencement in NewZealand
23. ITC 571 Emerging Technologies & Innovation Final Project Report
Abhinay Reddy Singaiahgari 11564841
8 (f)
International Students Commencement in Japan
Fig 8(f): International Students Commencement in Japan
Table 8(f): International Students Commencement in Japan model predicted values, R2 = 0.9444
Year Model predicted value
2013 156,060
2014 158,790
2015 161,110
2016 163,110
The model predicted value represents the constant growth. The growth is positive when we
compare to 2009 to 2016. There is constant growth from 2012 to 2016 as per trend line
shows the future commencement of students in japan has constant growth.
131599
141599
151461 150617
y = 15016 ln(x) + 131888
R² = 0.9444
0
20000
40000
60000
80000
100000
120000
140000
160000
180000
2009 2010 2011 2012 2013 2014 2015 2016
Numberofstudents
Years of student commencement
International Students commencement in Japan
24. ITC 571 Emerging Technologies & Innovation Final Project Report
Abhinay Reddy Singaiahgari 11564841
8 (g)
International Students Commencement in United Kingdom
Fig 8(g): International Students Commencement in United Kingdom
Table 8(g): International Students Commencement in United Kingdom model predicted values,
R2 = 0.9933
Year Model predicted value
2013 582,860
2014 592,320
2015 600,310
2016 607,240
The model predicted value represents the minimal constant growth. The student’s
commencement has minimal growth compared to 2009 to 2016. In the year 2011 there was
good growth but if we compare to 2013 there is improvement of commencement by 2016
respectively.
498998
534555
559948 568816
y = 51879 ln(x) + 499361
R² = 0.9933
0
100000
200000
300000
400000
500000
600000
700000
2009 2010 2011 2012 2013 2014 2015 2016
Numberofstudents
Years of student commencement
International Students Commencement in United Kingdom
25. ITC 571 Emerging Technologies & Innovation Final Project Report
Abhinay Reddy Singaiahgari 11564841
8 (h)
International Students Commencement in United States of America
Fig 8(h): International Students Commencement in United States of America
Table 8(b): International Students Commencement in United States of America model predicted
values, R2 = 0.9995
Year Model predicted value
2013 773,322
2014 809,792
2015 849,604
2016 892,758
The model predicted value represents the positive growth. There is numerous growth of
commencement of students United States of America from 2009 to 2016. This prediction
shows the future has very good growth of commencement of students who has concern to
have higher education system in United States of America.
660581
684807
709565
740475 y = 1671 x2
+ 18089x + 641102
R² = 0.9995
0
200000
400000
600000
800000
1000000
1200000
2009 2010 2011 2012 2013 2014 2015 2016
Numberofstudents
Years of student commencement
International Students Commencement in United States of America
26. ITC 571 Emerging Technologies & Innovation Final Project Report
Abhinay Reddy Singaiahgari 11564841
9.
Expenditure by Funding Source of Private & Public Universities in OECD Countries: To
compare the funding by government to Public private relationship universities of Organization for
Economic Cooperation and development countries to know the development of universities
whether key areas are satisfied in PPP’s relationship universities.
9 (a) Expenditure by Funding Source of Public & Private Universities in Australia
Fig 9(a): Expenditure by Funding Source of Public & Private Universities in Australia
(Australian Dollar, millions)
Table 9(a): Expenditure by Funding Source of Public & Private Universities in Australia
(Australian Dollar, millions) model predicted values, R2 = 0.9774
Year Model predicted value
2012 95,188
2013 98,120
2014 100,600
2015 102,750
2016 104,640
The model predicted value represents good positive growth. The growth of expenditure
which is funding source for public and private universities increasing in variable basis. It
starts decreasing in 2011.The expenditure compared to 2008 to 2016 is increasing from
2013 to 2016 government funding sources still need to be increased to meet key demand
areas to manage delivery of Higher Education in Australia since more number of students
want to get globalized education in Australia.
69260
79668
89047 90345
y = 16085 ln(x) + 69300
R² = 0.9774
0
20000
40000
60000
80000
100000
120000
2008 2009 2010 2011 2012 2013 2014 2015 2016
Australiandollar,millions($)
year of expenditure
Expediture by funding source for public & private Universities in
Australia (Australian Dollar, millions)
27. ITC 571 Emerging Technologies & Innovation Final Project Report
Abhinay Reddy Singaiahgari 11564841
9 (b)
Expenditure by Funding Source of Public & Private Universities in Canada
Fig 9(b): Expenditure by Funding Source of Public & Private Universities in Canada (Canadian
Dollar, millions)
Table 9(b): Expenditure by Funding Source of Public & Private Universities in Canada
(Canadian Dollar, millions) model predicted values, R2 = 0.9711
Year Model predicted value
2012 113,659
2013 118,010
2014 122,190
2015 126,210
2016 130,060
The model predicted value represents the negative growth. The Canadian government
spending on public and private universities has greater increase of expenditure funding
from 2008 to 2012 and 2008 to 2016 it has greater funding for education universities in
Canada.
95009
98353
105714
108724
y = -83.5x2
+ 5268.1x + 89406
R² = 0.9711
0
20000
40000
60000
80000
100000
120000
140000
160000
2008 2009 2010 2011 2012 2013 2014 2015 2016
Canadiandollar,millions
Year of expenditure
Expediture by funding source for public & private Universities in
Canada (Canadian Dollar, millions)
28. ITC 571 Emerging Technologies & Innovation Final Project Report
Abhinay Reddy Singaiahgari 11564841
9 (c)
Expenditure by Funding Source of Public & Private Universities in France
Fig 9(c): Expenditure by Funding Source of Public & Private Universities in France
(Euro, millions)
Table 9(c): Expenditure by Funding Source of Public & Private Universities in France
(Euro, millions) model predicted values, R2 = 0.966
Year Model predicted value
2012 128,730
2013 129,610
2014 130,350
2015 130,990
2016 131,560
The model predicted value represents the positive growth. The France expenditure
funding is going positive as per trend line from 2011 to 2016 and 2013 to 2016 expenditure
stats is going in peaks as to meet requirements of education system.
121161
123652
126888127481
y = 4823 ln(x) + 120964
R² = 0.966
114000
116000
118000
120000
122000
124000
126000
128000
130000
132000
134000
2008 2009 2010 2011 2012 2013 2014 2015 2016
Franceeuro,millions
Year of expenditure
Expediture by funding source for public & private Universities in
france (Euro, millions)
29. ITC 571 Emerging Technologies & Innovation Final Project Report
Abhinay Reddy Singaiahgari 11564841
9 (d)
Expenditure by Funding Source of Public & Private Universities in Germany
Fig 9(d): Expenditure by Funding Source of Public & Private Universities in Germany
(Euro, millions)
Table 9(d): Expenditure by Funding Source of Public & Private Universities in Germany
(Euro, millions) model predicted values, R2 = 0.9967
Year Model predicted value
2012 142,240
2013 144,240
2014 145,920
2015 147,380
2016 148,670
The model predicted value represents the constant growth. The growth of expenditure is
constant for future prediction. In 2008 to 2016 there is constant growth of funding. But
there is variable growth from 2008 to 2010 constant expenditure funding in Germany by
government.
124667
131957137182139520
y = 10936 ln(x) + 124643
R² = 0.9967
0
20000
40000
60000
80000
100000
120000
140000
160000
2008 2009 2010 2011 2012 2013 2014 2015 2016
germanEuro,millions
Year of expenditure
Expediture by funding source for public & private Universities in
Germany (Euro, millions)
30. ITC 571 Emerging Technologies & Innovation Final Project Report
Abhinay Reddy Singaiahgari 11564841
9 (e)
Expenditure by Funding Source of Public & Private Universities in Japan
Fig 9(e): Expenditure by Funding Source of Public & Private Universities in Japan
(Yen, millions)
Table 9(e): Expenditure by Funding Source of Public & Private Universities in Japan (Yen,
millions) model predicted values, R2 = 0.9996
Year Model predicted value
2012 29,754,300
2013 30,846,192
2014 32,318,428
2015 34,171,008
2016 36,403,932
The model predicted value represents the positive growth. There is increase in funding
from 2008 to 2016. In 2008 to 2011 there is low down of negative expenditure funding. In
2013 there is an increase in 2013 to 2016 it has increase of expenditure.
29596475
28896197
28612104
28672515
y = 190172x2
- 1E+06x + 3E+07
R² = 0.9996
0
5000000
10000000
15000000
20000000
25000000
30000000
35000000
40000000
45000000
2008 2009 2010 2011 2012 2013 2014 2015 2016
JapanYen,millions
Year of expenditure
Expediture by funding source for public & private Universities in
japan(Yen, millions)
31. ITC 571 Emerging Technologies & Innovation Final Project Report
Abhinay Reddy Singaiahgari 11564841
9 (f)
Expenditure by Funding Source of Public & Private Universities in New Zealand
Fig 9(f): Expenditure by Funding Source of Public & Private Universities in New Zealand
(New Zealand Dollar, millions)
Table 9(f): Expenditure by Funding Source of Public & Private Universities in New Zealand
(New Zealand Dollar, millions) model predicted values, R2 = 0.9715
Year Model predicted value
2012 15,959
2013 16,213
2014 16,204
2015 15,931
2016 15,396
The model predicted value represents the negative growth. The graph denotes it has
constant growth from 2008 to 2011. In 2011 there is an increase of expenditure and
compared to 2016 there is low down of expenditure. 2013 and 2014 there was more
expenditure spending but again drawback in 2016.
12224
13889 14393
15532
y = -131.5x2
+ 1700.3x + 10745
R² = 0.9715
0
2000
4000
6000
8000
10000
12000
14000
16000
18000
2008 2009 2010 2011 2012 2013 2014 2015 2016
NewZealanddollar,millions
year of expenditure
Expediture by funding source for public & private Universities in
NewZealand (NewZealand Dollar, millions)
32. ITC 571 Emerging Technologies & Innovation Final Project Report
Abhinay Reddy Singaiahgari 11564841
9 (g)
Expenditure by Funding Source of Public & Private Universities in United Kingdom
Fig 9(g): Expenditure by Funding Source of Public & Private Universities in United Kingdom
(Pound Sterling, millions)
Table 9(g): Expenditure by Funding Source of Public & Private Universities in United Kingdom
(Pound Sterling, millions) model predicted values, R2 = 0.7581
Year Model predicted value
2012 1,666,500
2013 2,447,500
2014 3,387,400
2015 4,488,700
2016 5,753,900
The model predicted value represents the positive growth. The growth shows there is great
expenditure spent in United Kingdom on public and private universities education system.
According to prediction of trend line the funding has increased 3 times of 2008. The growth
started to increase from 2012 to 2016 it has huge spending of expenditure. The growth has
started high in 2013 to 2016.
81762 87916
1045871
1063089
y = 56005 x2.1082
R² = 0.7581
0
1000000
2000000
3000000
4000000
5000000
6000000
7000000
8000000
9000000
10000000
2008 2009 2010 2011 2012 2013 2014 2015 2016
Unitedkingdompoundsterling,millions
Year of expenditure
Expediture by funding source for public & private Universities in
United Kingdom (Pound Sterling, millions)
33. ITC 571 Emerging Technologies & Innovation Final Project Report
Abhinay Reddy Singaiahgari 11564841
9 (h)
Expenditure by Funding Source of Public & Private Universities in USA
Fig 9(h): Expenditure by Funding Source of Public & Private Universities in USA
(US Dollar, millions)
Table 9(h): Expenditure by Funding Source of Public & Private Universities in USA (US Dollar,
millions) model predicted values, R2 = 0.9544
Year Model predicted value
2012 1,060,000
2013 1,104,640
2014 1,160,200
2015 1,226,568
2016 1,303,900
The model predicted value represents the positive growth. The expenditure spent by
funding source has constant from 2008 to 2011. In 2012 there was less expenditure spent
compared to 2011. In 2012 to 2016 funding has good increase of funding for public and
private universities in USA. This shows it has increase of expenditure in USA for public
and private universities.
1029922
1025378
1045871
1063089
y = 5440.5x2 - 15203x + 1E+06
R² = 0.9544
0
200000
400000
600000
800000
1000000
1200000
1400000
1600000
1800000
2008 2009 2010 2011 2012 2013 2014 2015 2016
USdollar($),millions
Year of expenditure
Expediture by funding source for public & private Universities in
USA (US Dollar, millions)
34. ITC 571 Emerging Technologies & Innovation Final Project Report
Abhinay Reddy Singaiahgari 11564841
The TABLE 10: Propagates the model prediction values of future trend of Education system
through PPP’s is set to pattern for Tertiary Education in Australia. The Result in Managing delivery
of Tertiary Higher Education in Australia in related to partnership of Public and Private
Universities in relate to Education of Student widely acknowledged in developing public and
private Universities. The Graph Statistics of representation delivery of Tertiary Education in
Australia related to future trend of the Parametric Polynomial Equation:
TABLE 10:
No. Topic Model to Future Trend
( Predicted Values)
R2 Value
1. Higher Education Students
Enrollment (Fig : 1)
y = 5824.7x2 + 10443x + 1E+06 0.9994
2. Public university Students
Enrollment (Fig : 2)
y = 3835x2 + 15239x + 1E+06 0.9999
3. Private University Students
Enrollment (Fig : 3)
y = 1989.7x2 - 4795.9x + 84252 0.9887
4. Higher Education Teaching Staff in
Universities (Fig : 4)
y = 28.333x3 - 737.5x2 + 6564.2x
+ 104370
0.9882
5. Australian Government Operating
Expenses on Primary & Secondary
Education (Fig : 5)
y = 4146.5 ln(x) + 34369 0.8131
6. Australian Government Operating
Expenses on Tertiary Education
(Fig : 6)
y=-119x2 + 2157.9x + 20769 0.9855
7. Employment Stats of Bachelor
degree graduates in Australia
( Fig : 7)
y = 191.57x2 - 82.286x + 63944 0.9335
8.
8 (a)
8 (b)
8 (c)
8 (d)
International Students
commencing in Universities in
OECD Countries
International Students commencing
in Australia (Fig : 8(a))
International Students commencing
in Canada (Fig : 8(b))
International Students commencing
in France (Fig : 8 (c ))
International Students commencing
in Germany (Fig : 8(d))
y = 2357.9 ln(x) + 297084
y = 19619 ln(x) + 187407
y=16487 ln(x)+249073
y = 1825.8x2 + 943.95x +
254157
0.0474
0.7813
0.9944
0.9983
35. ITC 571 Emerging Technologies & Innovation Final Project Report
Abhinay Reddy Singaiahgari 11564841
8 (e)
8 (f)
8 (g)
8 (h)
International Students commencing
in New Zealand (Fig : 8( e))
International Students commencing
in Japan (Fig : 8 (f))
International Students commencing
in United Kingdom (Fig : 8 (g))
International Students commencing
in United States of America (Fig :
8(h))
Expenditure by Funding Source
of Private & Public Universities in
OECD Countries
Expenditure by Funding Source of
Private & Public Universities in
Australia (Fig : 9( a))
Expenditure by Funding Source of
Private & Public Universities in
Canada ( Fig : 9(b))
Expenditure by Funding Source of
Private & Public Universities in
France (Fig : 9( c))
Expenditure by Funding Source of
Private & Public Universities in
Germany (Fig : 9 (d))
Expenditure by Funding Source of
Private & Public Universities in
Japan (Fig : 9( e))
Expenditure by Funding Source of
Private & Public Universities in
New Zealand (Fig : 9(f))
Expenditure by Funding Source of
Private & Public Universities in
United Kingdom (Fig : 9(g))
Expenditure by Funding Source of
Private & Public Universities in
United States of America (Fig :
9(h))
y = 2626.9 ln(x) + 69576
y=15016 ln(x)+131888
y=51879 ln(x)+499361
y = 1671x2 + 18089x + 641102
0.948
0.9444
0.9993
0.9995
9.
9 (a)
9(b)
9(c)
9(d)
9 (e)
9 (f)
9 (g)
9 (h)
y=16085 ln(x)+69300
y = -83.5x2 + 5268.1x + 89406
y=4823 ln(x)+120964
y=10936 ln(x)+124643
y = 190172x2 - 1E+06x + 3E+07
y = -131.5x2 + 1700.3x + 10745
y = 56005x2.1082
y = 5440.5x2 - 15203x + 1E+06
0.9774
0.9711
0.966
0.9967
0.9996
0.9715
0.7581
0.9544
36. ITC 571 Emerging Technologies & Innovation Final Project Report
Abhinay Reddy Singaiahgari 11564841
TABLE 11: The Statistics denote the real value and model predicted value of Australian Higher
Education.
Value denotes number of students and staff
Fig
No.
Topic Real data Predicted data
2010 2011 2012 2013 2014 2015 2016
1. Higher
Education
Students
Enrollment
in Australia
1192657 1221008 1257722 1313776 1373230 1272300 1358500
2. Public
University
Student
Enrollment
in Australia
1111352 1137511 1171737 1215367 1263669 1229494 1294588
3. Private
University
Students
Enrollment
in Australia
81,305 83,497 85,985 98,409 109,561 127,110 148,176
4. Higher
Education
teaching
staff in
universities
in Australia
110,351 114,271 118,946 120,136 122,421 123,330 123,900
5. Government
operating
expenses on
primary and
secondary
education in
Australia
39,101 40,166 38,736 40,625 41,763 42,438 42,991
6. Government
operating
expenses on
tertiary
education in
Australia
24,215 26,195 27,447 29,016 29,185 30,043 30,416
7. Employment
of bachelor
degree
graduates in
Australia
65,045 68,205 67,626 70,373 72,737 75,546 78,721
37. ITC 571 Emerging Technologies & Innovation Final Project Report
Abhinay Reddy Singaiahgari 11564841
TABLE 12: The Statistics denote the real value and model predicted value of International
Students Commencement in universities in OECD Countries
Value denotes number of students
Fig
No:
Countries Real data Predicted data
2009 2010 2011 2012 2013 2014 2015 2016
8(a) Australia 292,545 307,653 301,643 291,889 302,976 298,919 299,077 299,213
8(b) Canada 191,202 195,550 203,823 221,406 201,120 202,674 203,987 205,125
8(c) France 249,143 259,935 268,212 271,399 275,610 278,610 281,160 283,360
8(d) Germany 256,719 263,972 272,797 287,353 304,520 325550 350,230 378,560
8(e) New
Zealand
69,763 70,883 72,796 73,209 71,412 71,620 71,796 71,948
8(f) Japan 131,599 141,599 151,461 150,617 156,060 158,790 161,110 163,110
8(g) United
kingdom
498,998 534,555 559,948 568,816 582,860 592,320 600,310 607,240
8(h) United
States of
America
660,581 684,807 709,565 740,475 773,322 809792 849,604 892,758
38. ITC 571 Emerging Technologies & Innovation Final Project Report
Abhinay Reddy Singaiahgari 11564841
TABLE 13: The Statistics denote the real value and model predicted value of Expenditure by
funding source of public and private universities in OECD Counties
Values denote expenditure in millions ( $)
Fig
No:
Country,
Currency
Real data Predicted data
2008 2009 2010 2011 2012 2013 2014 2015 2016
9(a) Australia,
Dollars
69,260 79,668 89,047 90,345 95,188 98,120 100,600 102,750 104,640
9(b) Canada,
Dollars
95,009 98,353 105,714 108,724 113,659 118,010 122,190 126,210 130,060
9(c) France,
Euro
121,161 123,652 126,888 127,481 128,730 129,610 130,350 130,990 131,560
9(d) Germany,
Euro
124,667 131,957 137,182 139,520 142,240 144,240 145,920 147,380 148,670
9(e) Japan,
Yen
29,596,475
28,896,197
28,612,104
28,672,515
29,754,300
30,846,192
32,318,428
34,171,008
36,403,932
9(f) New
Zealand,
dollars
12,224 13,889 14,393 15,532 15,959 16,213 16,204 15,931 15,396
9(g) United
kingdom
81,762
87,916
1,045,871
1,063,089
1,666,500
2,447,500
3,387,400
4,488,700
5,753,900
9(h) United
States of
America
1,029,922
1,025,378
1,045,871
1,063,089
1,060,000
1,104,640
1,160,200
1,226,568
1,303,900
39. ITC 571 Emerging Technologies & Innovation Final Project Report
Abhinay Reddy Singaiahgari 11564841
TABLE 14: The Statistics research denotes number of students and staff in Australia and
International Students commencing in OECD countries are calculated in terms of Mean, Standard
deviation, Geometric Mean and 25th – 75th percentile:
Values denote Number of students and staff.
Figure Minimum Maximum Mean / Standard
Deviation
Geometric
Mean
25th – 75th Percentile
1. 1192657 1373230 1271678.6 / 72614.715 1270037.85 1206832.5 - 1343503
2. 1111352 1263669 1179927.2 / 60904.515 1178679.231 1124431.5 - 1239518
3. 81305 109561 91751.4 / 11958.462 91154.964 82401 - 103985
4. 110351 122421 117225 / 4858.29 117143.513 112311 - 121278.5
7. 63493 72737 67446.71 / 3326.41 67377.100 64648 - 70373
8.a) 292545 307653 299341.2 / 6879.67 299277.87 292217 - 305314.5
8.b) 191202 221406 202995.25 / 13343.57 202674.07 193376 - 212614.5
8.c) 249143 271399 262172.25 / 9939.452 262029.37 254539 - 269805.5
8.d) 256719 287353 270210.25 / 13184.52 269971.425 260345.5 - 280075
8.e) 69763 73209 71662.75 / 1621.95 71648.946 70323 - 73002.5
8.f) 131599 151461 143819 / 9289.23 143589.24 136599 – 151039
8.g) 498998 568816 540579.25 / 31292.99 539886.75 516776.5 – 564382
8.h) 660581 740475 698857 / 34201.23 698231.13 672694 – 725020
Large Surveys are desired to verify our findings and to provide reliable knowledge on delivery of
Tertiary Education in Australia and data collection settings are significantly important in
comparison of different studies pf effect of Staff and students and Graduate outcome in Australia
with relate to OECD countries pursuing Tertiary Education. Percentile values are calculated to
know the rank values of statistics.
40. ITC 571 Emerging Technologies & Innovation Final Project Report
Abhinay Reddy Singaiahgari 11564841
TABLE 15: The Statistics research denote expenditure spent by funding source to Public and
Private Universities in OECD Countries are calculated in terms of Mean, Standard deviation,
Geometric Mean and 25th – 75th percentile:
Values denote expenditure in millions ( $)
The large collection of data findings in regard to Expenditure funding on Public and Private
Universities in Australia and OECD countries which denote nevertheless effect of funding to
Universities measured to have an average analysis of Future funding to Universities in order meet
the Key demand areas of Tertiary Education system. The Analysis is conducted to note the
framework of funding for Australian and other countries comparative analysis to improve the
Education system. Percentile values are calculated to know the rank values of statistics.
Figure Country,
Currency
Minimum Maximum Mean / Standard
deviation
Geometric
mean
25th – 75th
percentile
5. Australia,
Dollars
33105 41763 38916 / 3047.06 38809.672 38736 –
40625
6. Australia,
Dollars
23042 29185 26516.66 / 2518.19 26415.116 24215 –
29016
9.a) Australia,
Dollars
69260 90345 82080 / 9781.265 81624.86 74464 –
89696
9.b) Canada,
dollars
95009 108724 101950 / 6355.33 101801.123 96681 –
107219
9.c) France,
Euro
121161 127481 124795.5 / 2950.008 124769.232 122406.5 –
127184.5
9.d) Germany,
Euro
124667 139520 133331.5 / 6585.0004 133207.71 128312 –
138351
9.e) Japan,
Yen
28612104 29596475 28944322.759/ 451614.65 28941701.8655 28642309.5 –
29246336
9.f) New
Zealand,
Dollars
12224 15532 14009.5 / 1374.48 13957.76 13056.5 –
13056.5
9.g) United
kingdom,
Pound
Sterling
81762 1063089 569659.5/ 559872.257 298996.97 84839 –
1054480
9.h) USA,
dollars
1025378 1063089 1041065 / 17111.425 1040959.9457 1027650 –
1027650
41. ITC 571 Emerging Technologies & Innovation Final Project Report
Abhinay Reddy Singaiahgari 11564841
6. Barriers / Challenges
The challenges to implement framework on concept based delivery of tertiary education in
managing delivery of public and private Australian universities in process of improved
management system with substantial development of globalized education meeting demand and
supply of staff, expenditure on tertiary education so that students will have more interest on
international education in Australia for career growth and advantage to the business process for
the country growth.
7. Conclusion:
In the investigation, we performed analysis on Higher Education of Australia
statistics of staff , students enrollments, expenditure spent on Public and Private universities
,Government funding sources and students commencing in OECD countries focusing on
ideological demands which are widely acknowledged to make a substantial development in public
and private partnership looking into management problems and staff and students support to have
customer satisfactory development in PPP (public and private partnership) to be success to meet
required demand supply in terms of globalization, international education, tertiary education,
student demands and staff demands and funding schemes. In total 104 measurements were taken
for analysis of Higher education system in Australia and OECD countries. Additionally we
developed data collection protocol and performed various measurements for improvement of
delivery of higher education in Australia .Our results show highest and lowest values measured
within a range of 63,493 – 1,373,230 of staff/students in Higher Education Universities and highest
and lowest values measured within a range of 12,224 – 29,596,475 million ($) expenditure funding
on Higher Education Public and Private Universities. If expenditure is on PPP’s are released more
for development research areas for staff which in turn will be helpful for students to carryout
education in Australia and to have globalization for becoming an Employment Graduate in
Australia to have great economic business progress in delivery of Higher education. Nevertheless
of this study should be useful as a reference for many Industry professionals and researchers
without direct access to paper equipment. This research would provide basis of improvement of
education system to meet key demand areas of Higher Education/ tertiary Education in Australia
and support development of suitable guidelines by authorities.
42. ITC 571 Emerging Technologies & Innovation Final Project Report
Abhinay Reddy Singaiahgari 11564841
Several Important Conclusions arise from this Project:
Scientific Contribution:
1. This research is conducted to analyze level of higher education system in Australia and key
areas demands of education system and the research was able to predict the trending change of
delivery of tertiary education in Australia for next 2 years.
2. Many researches were carried focusing mainly on Higher education statistics of Australia in
terms of data collection protocol performed various measurements of 104 values of staff and
students of Public and Private University, Bachelor degree graduates, Government Operating
expenses on primary, secondary and tertiary Education, International student’s commencement in
OECD countries and Expenditure by funding source in OECD countries statistics in order to
analyze the growth of trending changes of Education system in Australia.
3. We have contributed to larger extent of globalization of higher education system in Australia
over the past decade. We have observed the International students and funding source for tertiary
Education in OECD countries contribution for future prediction.
4. We have predicted that by the year 2016 there will be large increase in growth of students
commencing for Higher education in Australia in compare to other OECD countries so in order to
have more students want to pursue Higher education in Australia government has to contribute
more expenditure in terms of research and staff.
5. In total 104 measurement values are analyzed and results show highest and lowest values
measured within a range of 63,493 – 1,373,230 of staff/students in Higher Education Universities
and highest and lowest values measured within a range of 12,224 – 29,596,475 million ($)
expenditure funding on Higher Education Public and Private Universities.
Important Conclusion:
1. Most of previous researches which were carried out on Delivery of Tertiary Education in
Australia has carried out elements which include staff and students. Very few researchers have
43. ITC 571 Emerging Technologies & Innovation Final Project Report
Abhinay Reddy Singaiahgari 11564841
been carried out concentrating on Expenditure for Public and private university funding sources,
International students commencing and bachelor graduates.
2. If expenditure is on PPP’s are released more for development research areas for staff which in
turn will be helpful for students to carryout education in Australia and to have globalization for
becoming an Employment Graduate in Australia and to meet key demand areas of education
system like tertiary education, globalization, demand and supply, funding schemes and
International Education and implementing various new economic programs and identity domestic
and International programs.
3. The future predictions and researches on delivery of tertiary education in Australia should
consider on researches programs of Information Technology, Science, Arts etc., International
education and staff of public and private universities.
8. Appendix:
The Department of statistics of Higher Education, Australian Government
1. Higher Education Statistics – 2010, 2011, 2012, 2013, 2014 Student data
(https://www.education.gov.au/student-data)
2. Higher Education Statistics – 2010, 2011, 2012, 2013, 2014 Staff data
(https://www.education.gov.au/staff-data)
3. Higher Education Providers in Australia – 2010, 2011, 2012, 2013, 2014 Higher Education
providers (https://www.education.gov.au/higher-education-statistics)
4. Employment Graduate Statistics of Australia 2008, 2009, 2010, 2011, 2012, 2013, 2014.
(http://www.graduatecareers.com.au/wp-
content/uploads/2014/12/GCA_GradStats_2014.pdf and
http://www.graduatecareers.com.au/wp-content/uploads/2012/01/gca002770.pdf)
44. ITC 571 Emerging Technologies & Innovation Final Project Report
Abhinay Reddy Singaiahgari 11564841
5. Government operating expenses statistics on Tertiary Education in Australia 2009,
2010, 2011, 2012, 2013, 2014. (http://www.abs.gov.au/ausstats/abs@.nsf/mf/5518.0.55.001)
6. International Students in OECD Countries and Expenditure by funding source in Public
And Private universities in OECD Countries.
(http://stats.oecd.org/viewhtml.aspx?datasetcode=RFOREIGN&lang=en)
8.1. List of Acronyms:
AQF – Australian Qualifications Framework
AQUA – Australian Universities Quality AGENCY
HESA – Higher Education Support Act
NSAI - Non-Self Accrediting Institutions
SAI - Self Accrediting Institutions
TEQSA – Tertiary Education Quality and Standards Agency
OECD – Organization for Economic Cooperation and development.
9. References:
1. Woodhouse, 2011. Australian Universities Quality Agency (AQUA) Melbourne
Regulation and Quality Assurance of Higher Education Institutions in Australia , p1 -11 ,
ISBN : 978-1-61284-256-1
2. Boer, 2013. Continuing Higher Education in Australia retrieved from
http://www.rijksoverheid.nl/bestanden/documenten-en-
publicaties/publicaties/2013/04/09/studie-cheps-continuing-higher-education-2/studie-
cheps-continuing-higher-education-part-2.pdf
3. Okoye, 2013. Private Public partnership and Technical Vocational Education & Training
(TVET) in developing Economy, Vol. 2, No: 10
4. Roosli, 2015. Organizational Innovation: The impact of Organizational culture in PPP
Adoption, ISSN-1995-0756 EISSN-1998-1066
45. ITC 571 Emerging Technologies & Innovation Final Project Report
Abhinay Reddy Singaiahgari 11564841
5. Breen, 2001. Cooperative Education Partnerships; an Examination of reciprocal
relationships between universities and industry organizations in providing professional
development, retrieved from
http://epubs.scu.edu.au/cgi/viewcontent.cgi?article=1053&context=theses
6. Nell, 2007. key Challenges to Public Private Partnerships retrieved from http://castalia-
advisors.com/files/12345.pdf
7. Terpestra, D., 1996. ‘Recruitment and Selection: The Search for Effective Placements’,
HR Focus, May, pp. 16-17.
8. Chattopadhay, 2013. Public – Private Partnership in Education, Journal of International
Development retrieved from http://onlinelibrary.wiley.com/doi/10.1002/jid.2930/abstract
9. Patrinos HA, 2009. The Role and Impact of Public–Private Partnerships in Education.
World Bank: Washington, DC.
10. Sosale S. 2007. Mobilizing the Private Sector for Public Education: A View from the
Trenches, World Bank: Washington, DC.
11. Maiorescu, 2015. Quality Management to Excellence in Higher Education Institutions,
Vol. 5, No. 2.
12. Heitor, 2015. University Global partnerships of international Affairs, Technological
Forecasting and Social Change retrieved from
http://www.manifesto2015.com/docs/HEITOR-2015-TFSC-University-global-
partnerships-vol95.pdf
13. Taseska, 2008. Overview of Public Private Partnerships in Australia: Financing,
Regulation, Auditing and Proposed Improvements ,Volume 14 , No 2 , pp 77-90
46. ITC 571 Emerging Technologies & Innovation Final Project Report
Abhinay Reddy Singaiahgari 11564841
14. Knight, J., 2007. The internationalization of higher education: Motivations and realities. J.
Stud. Int. Educ. 11 (3/4), 290–305.
15. Leydesdorff, L., 2000b. The dynamics of innovation: from national Systems and ‘mode 2’
to a Triple Helix of university–industry–government Relations. Res. Policy 29 (2), 109–
123.
16. Mazzucato, M., 2013. The Entrepreneurial State — Debunking Public vs. Private Sector
Myths. Anthem Press, London.
17. Foreign / International Students Enrolled, OECD Statistics retrieved from
http://stats.oecd.org/viewhtml.aspx?datasetcode=RFOREIGN&lang=en
18. Government Expenditure 5518.0.55.001, Australian Bureau of Statistics retrieved from
http://www.abs.gov.au/ausstats/abs@.nsf/mf/5518.0.55.001
19. Spence, A., 2014. Sch. of Inf. Technol., Deakin Univ., Waurn Ponds, VIC, Australia ,
interactive technology for lectures in higher education information technology ,pp 224-230
, doi : 10.1109/TALE.2014.7062626
20. Stella, 2011. Australian Universities Quality Agency (AQUA) Melbourne Regulation and
Quality Assurance of Higher Education Institutions in Australia , p1 -11 , ISBN : 978-1-
61284-256-1
21. Bozbura, 2011, A Causal Model of Quality Management Practices and Stakeholder
Interests in Higher Education Institutions: Comparison of Public and Private Universities,
Technology management in Energy Smart World, ISBN: 978-1-4577-1552-5, IEEE July
31 2011-Aug. 4 2011, pp 1-12.
22. Higher Education System tertiary level retrieved from
https://www.google.com.au/?gfe_rd=cr&ei=Xi_PVZqTEq3u8weE3bI4&gws_rd=ssl#q=h
igher+education+tertiary+level+australia
47. ITC 571 Emerging Technologies & Innovation Final Project Report
Abhinay Reddy Singaiahgari 11564841
23. Higher Education Statistics data, Australian Government, Department of Education and
Training retrieved from https://www.education.gov.au/higher-education-statistics
24. Higher Education student Enrollment data, Australian Government, Department of
Education and Training retrieved from https://www.education.gov.au/student-data
25. Higher Education staff data at Universities, Australian Government, Department of
Education and Training retrieved from https://www.education.gov.au/staff-data
26. International Students in OECD Countries and Expenditure by funding source in Public
And Private universities in OECD Countries retrieved from
http://stats.oecd.org/viewhtml.aspx?datasetcode=RFOREIGN&lang=en
27. Government operating expenses statistics on Tertiary Education in Australia
2009, 2010, 2011,2012,2013,2014 retrieved from
http://www.abs.gov.au/ausstats/abs@.nsf/mf/5518.0.55.001
28. Employment Graduate Statistics of Australia 2008, 2009, 2010, 2011, 2012, 2013, 2014.
Retrieved from
http://www.graduatecareers.com.au/wp-content/uploads/2014/12/GCA_GradStats_2014.pdf
29. Expenditure by Funding source to OECD Countries retrieved from
http://stats.oecd.org/Index.aspx?DatasetCode=RGRADSTY