Contenu connexe
Similaire à ADP Regional Employment Report: May 2015
Similaire à ADP Regional Employment Report: May 2015 (20)
ADP Regional Employment Report: May 2015
- 1. Regional Employment Report®
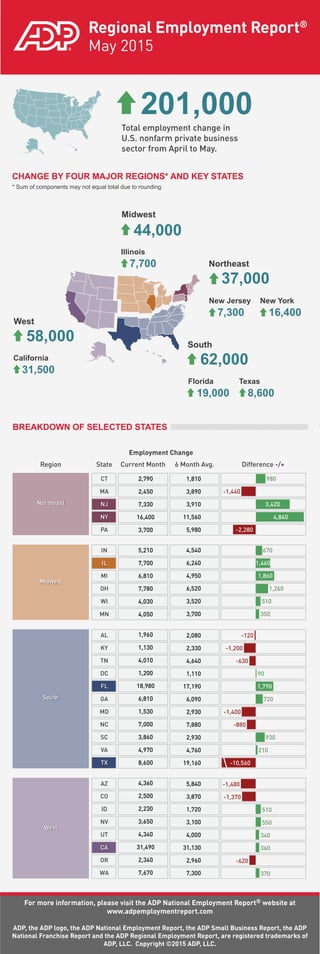
May 2015
CHANGE BY FOUR MAJOR REGIONS* AND KEY STATES
* Sum of components may not equal total due to rounding.
BREAKDOWN OF SELECTED STATES
Midwest
Illinois
New Jersey
California
Florida Texas
New York
Northeast
South
West
201,000
44,000
37,000
Total employment change in
U.S. nonfarm private business
sector from April to May.
7,700
7,300
31,500
19,000 8,600
16,400
62,000
58,000
Region State Current Month
Employment Change
6 Month Avg. Difference -/+
CT
Northeast
MA
NJ
NY
PA
IN
Midwest
IL
MI
OH
WI
MN
AL
South
KY
TN
DC
FL
GA
MD
NC
SC
VA
TX
AZ
West
CO
ID
NV
UT
CA
OR
WA
For more information, please visit the ADP National Employment Report® website at
www.adpemploymentreport.com
ADP, the ADP logo, the ADP National Employment Report, the ADP Small Business Report, the ADP
National Franchise Report and the ADP Regional Employment Report, are registered trademarks of
ADP, LLC. Copyright ©2015 ADP, LLC.
2,790
2,450
7,330
16,400
3,700
5,210
7,700
6,810
7,780
4,030
4,050
1,960
1,130
4,010
1,200
18,980
6,810
1,530
7,000
3,860
4,970
8,600
4,360
2,500
2,230
3,650
4,340
31,490
2,340
7,670
980
-1,440
3,420
4,840
-2,280
670
1,460
1,860
1,260
510
350
-120
-1,200
-630
90
1,790
720
-1,400
-880
930
210
-10,560
-1,480
-1,370
510
550
340
360
-620
370
1,810
3,890
3,910
11,560
5,980
4,540
6,240
4,950
6,520
3,520
3,700
2,080
2,330
4,640
1,110
17,190
6,090
2,930
7,880
2,930
4,760
19,160
5,840
3,870
1,720
3,100
4,000
31,130
2,960
7,300