Promotions & advertising: accurately measured but poorly understood
•
1 j'aime•276 vues

Promotions & advertising: accurately measured but poorly understood

Recommandé
Recommandé
Contenu connexe
En vedette
En vedette (8)
Plus de adtech
Plus de adtech (20)
Dernier
Dernier (20)
Promotions & advertising: accurately measured but poorly understood
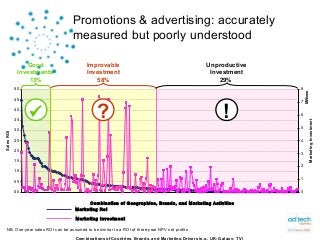
- 1. 0.0 0.5 1.0 1.5 2.0 2.5 3.0 3.5 4.0 4.5 5.0 SalesROI 0 1 2 3 4 5 6 7 8 Millions MarketingInvestment Good Investments 13% Improvable Investment 58% Unproductive Investment 29% NB. One-year sales ROI can be assumed to be similar to a ROI of three-year NPV net profits Combination of Geographies, Brands, and Marketing Activities Marketing RoI Marketing Investment !? Promotions & advertising: accurately measured but poorly understood
- 2. The customer journey: Offline influences Online. Online influences Offline
- 3. OutputsInputs Modelling ►Marketing impact for individual investments ►Marketing mix strategy ►Optimised budget allocation ►Validated data set covering all investments and key business outcomes ECONOMETRICMODEL National TV Time Display Sales Price Promotion Search Competitor Actions Base Sales TV GRP Tier 1 Marketing Activity Inputs Direct Marketing TV GRP Tier 2 National Press Search Competitor Spend Display Jan-00 Jan-01 Jan-02 0 5 10 15 20 25 0.0 0.2 0.4 0.6 0.8 1.0 0 5 10 0 10 20 30 40 50 0 0 0 0 0 0.0 0.5 1.0 1.5 0.0 0.5 1.0 1.5 Jan-00 Jan-01 Jan-02 0 5 10 15 20 25 0.0 0.2 0.4 0.6 0.8 1.0 0 5 10 0 10 20 30 40 50 0 0 0 0 0 0.0 0.5 1.0 1.5 0.0 0.5 1.0 1.5 Increasing investment drives profit Marketing Investment SalesandProfit Sales Profit Current plan Base Plan Optimised Investment IncrementalNetsales Marketing Investment $0 $5 $10 $15 $20 $25 $30 $35 $- $2 $4 $6 $8 $10 Display Search Determining the correct attribution to sales
- 4. Week 1 Week 2 Week 3 Week 4 Search Display Response time Responsedistribution 90% 90% 95% 100% Use channels in concert. Example: display produces a faster response than search Search has very low channel loyalty Paid has comparatively high channel loyalty !