SlideShare une entreprise Scribd logo
1  sur  13
Télécharger pour lire hors ligne
American International Journal of Business Management (AIJBM)
ISSN- 2379-106X, www.aijbm.com Volume 4, Issue 07 (July-2021), PP 01-13
*Corresponding Author: ZOGO EKASSI Richard1
www.aijbm.com 1 | Page
Does Trade Openness Increase Income Inequality in Africa? An
Analysis Using the Squalli and Wilson Indexes, 2011
ZOGO EKASSI Richard
University of Yaounde II, Cameroon,
Summary: In this paper, we assess the effect of trade openness on income inequality in Africa. Using a sample
of 38 countries, we specify and estimate a panel data model using Double Least Squares (DLS) over the period
1980-2018. Using the indicators of Squalli and Wilson (2011), the results show that the relative shares of
domestic country trade, domestic country trade to average world trade, world trade composition, exports and
imports to GDP increase income inequality. We suggest the consolidation of structural reforms to improve the
competitiveness of the industrial fabric and the diversification of the supply of goods and services.
Keywords: Africa, DLS, Inequality, Trade openness.
I. Introduction
Globalization continues to reveal two major trends. On the one hand, the increasing openness of
emerging markets, with a decrease in the degree of trade protection, and greater amplitude of capital flows. On
the other hand, an increase in intra- and inter-country inequalities (Daymon, 2012). This situation induces
uncertainty insofar as the relationship between trade openness and inequality in developing countries remains
absurd. Although free trade helps alleviate poverty through improved private sector efficiency (Winters, 2002),
in the short run, trade liberalization causes significant redistributional effects within the economy and there is no
consensus on the accompanying macroeconomic policies to implement.
One of the fundamental issues in trade is the distribution of income across factors. Until the 1990s, the
ideal framework for understanding the link between trade and income inequality is the Stolper-Samuelson (SS)
theorem in the Heckscher-Ohlin model (Lee and Wei, 2015). One implication is that trade liberalization should
reduce income inequality in developing countries since trade can increase the real return to the relatively
abundant factor. However, rising income inequality has been observed in developing countries (Harrison et al.,
2010).
The adoption of the 2030 Agenda for Sustainable Development and its 17 Sustainable Development
Goals (SDGs) in September 2015 drew attention to income inequality in Sub-Saharan Africa (UNDP, 2017).
Although Sub-Saharan Africa observed a 3.4 percentage point decline in the unweighted average value of its
Gini coefficient between 1991 and 2011, it remains one of the regions with the highest levels of inequality
globally. Indeed, it is home to 10 of the 19 most unequal countries in the world. It is also home to seven
economies that are considered outliers in terms of their Gini coefficients and, as such, are responsible for the
inequality observed in the region. Between 1991 and 2011, a clear duality in inequality trends emerged among
countries in the region. Moreover, 17 African countries (mostly agricultural economies in West Africa and some
in other subregions) experienced declining inequality, while 12 countries, mostly in Southern and Central Africa
and characterized by a large oil and mining sector, experienced rising inequality.
This observation has led to the urgent need for economists to rethink the drivers of income inequality
beyond the simple prediction of the Stolper-Samuelson theorem. The first argument is to extend the Heckscher-
Ohlin model for explanation (Xu (2003). The second argument is the skill bias and the technology channel
(Rattso and Stokke, 2013). The third is the increase in trade in intermediate goods and vertical specialization
(Grossman and Rossi-Hansberg, 2008).
The dramatic trade liberalizations implemented by developing countries or their partners since the
1980s have provided an unprecedented opportunity to learn more about the effects of trade on growth,
inequality, and poverty in developing countries (Goldberg and Pavcnik, 2007). Three possible arguments support
the relationship between trade openness and income inequality. First, factor endowments (Spilimbergo et al.,
1999; Gourdon et al., 2008). Second, trade-related investment and outsourcing (Feenstra and Hanson, 1999;
Krugman, 2008). Third, technological changes that reflect real world market conditions to the analysis of the
effect of trade on income inequality (Lim and McNelis, 2016). While growth and technology improve income
inequality, trade openness has mixed effects on income inequality (Jaumotte et al., 2013; Dollar and Kraay,
2002).
Theoretically, the impact of trade on inequality in developing countries could be different. Empirically,
in the literature, the direction so far has been mixed. Wood (1997) concludes that trade openness is differently
associated with wage inequality in Asian Tiger economies and Latin American countries. Green et al, (2001)
Does Trade Openness Increase Income Inequality in Africa? An Analysis....
*Corresponding Author: ZOGO EKASSI Richard1
www.aijbm.com 2 | Page
point out that trade liberalization has no significant effect on wage dispersion in Brazil. Meschi and Vivarelli
(2009) show that trade liberalization has an impact on income distribution in developing countries. A key issue,
often emphasized in the literature, is that trade is endogenous in determining income levels, and hence income
inequality.
At the same time, rising inequality within a country has been a major concern in both developed and
developing countries (Asteriou et al., 2014). Several studies have investigated how economic freedom and
globalization are associated with income inequality (Bergh and Nilsson, 2010). For example, Dreher and Gaston
(2008) find that globalization increases household income inequality, particularly in Organization for Economic
Cooperation and Development (OECD) countries. Similarly, recognizing the importance of international trade,
the relationship between trade or trade openness and income inequality has been discussed in the literature.
Savvides (1998) concludes that trade openness worsens income distribution in less developed countries,
especially open economies, in the late 1980s. However, Reuveny and Li (2003) find that trade openness reduces
income inequality. Most existing studies use the share of trade in the gross domestic product (GDP) as a measure
of trade openness (Anderson, 2005).
From the non-exhaustive review of the literature on the impact of trade openness on income inequality,
two main points can be made. First, most of the work has focused on the influence of international trade. Yet, in
the long tradition of international economics, trade openness and inequality are frequently presented as
complementary and associated with the stability of international relations (Baldwin and Krugman, 1989).
Second, the literature ignores the problem of the level of trade openness resulting from the fragmentation of
trade flows. Moreover, the use of multiple indices of trade openness seems not to have been addressed in the
literature. Our paper aims to provide some empirical evidence on these shortcomings.
Following this theoretical framework and drawing on empirical methodologies widely documented in
the literature, the objective of this paper, which constitutes its originality, is to examine the effects of five
dimensions of trade openness on income inequality in Sub-Saharan Africa. To this end, we consider a sample of
38 African countries over the period 1980-2018 and apply Double Least Squares (DLS). The results show that
the relative shares of domestic country trade, domestic country trade to average world trade, world trade
composition, exports and imports to GDP increase income inequality. To this end, and more specifically, the
study contributes to the literature on the subject in at least three ways. First, it incorporates, in addition to the
traditional determinants, trade openness as a relevant indicator of income inequality. Second, it uses
disaggregated indices of trade openness to better illustrate the relative relevance of each of the indices on income
inequality in Sub-Saharan Africa. Finally, it shows its polysemic nature, which can be understood through the
use of disaggregated indices, in order to make relevant recommendations.
The rest of the article is divided into five additional sections. The second section outlines synthesis of the
state of the art. The third presents the stylized facts. The fourth presents the empirical strategy. The fifth analyses
the results. The sixth concludes and suggests some policy recommendations.
II. Review of the literature
The dynamics of trade openness favor the emergence of challenges and opportunities related to
inequalities (Ravallion, 2001). It is accompanied by processes of human, physical, financial and commercial
integration that transform the well-being of populations (Dollar and Kraay, 2002). Policies must respond to these
inequalities to promote trade in sustainable goods and services to foster inclusive growth and accelerate
structural transformation.
Following Adam Smith (1776), who based explanations of inequalities in international trade on absolute
advantages, the literature on trade openness has been characterized by three main theories. First, the traditional
theories that include Ricardo's theory of comparative advantage (1817) and the Heckscher-Ohlin-Samuelson
(HOS) model. Then, the modern theories that incorporate the new theory of international trade developed by
Krugman (1979) and the institutional theory with North (1981). Finally, the financial theories highlight two
effects. A direct effect based on the postulate that a country with a developed financial system favors trade
openness through the channeling of financial flows, diversification and risk management, as well as the
densification of trade in goods and services (Levine, 2005). An indirect effect that explains trade openness by a
country's ability to have a sufficiently developed financial system and greater access to finance that can stimulate
economic activities (Enrique et al., 2014).
Previous work on the trade and inequality relationship is based on the Heckscher-Ohlin (HO) model,
which predicts that countries benefit from trade using their many factors (Chang and Wu, 2016). The Stolper-
Samuelson theorem explains the main link between trade openness and income inequality. According to this
theorem, capital-rich developed countries tend to export capital-intensive goods, while labor-rich developing
countries tend to export labor-intensive goods. Once they open their markets, the relative prices of capital-
intensive goods rise in developed countries, increasing the incomes of those with capital and reducing the
Does Trade Openness Increase Income Inequality in Africa? An Analysis....
*Corresponding Author: ZOGO EKASSI Richard1
www.aijbm.com 3 | Page
incomes of labor. The opposite effects occur in developing countries, increasing the relative incomes of those
who benefit from lower capital.
The growing interconnection of economies has led to the need to explore the impact of trade openness
on inequality, the roots of which go back to the seminal work of Kletzer and Bardhan (1987), which showed that
imperfections in goods and services markets resulting from trade openness affect income inequality. These
aspects left no doubt about the relevance of such a relationship, showing that income inequality depends on trade
openness. Yet trade openness plays a major role in the evolution of inequality within countries through its effect
on the prices of goods and factors. According to international trade theories, the degree of a country's exposure
to foreign trade alters household incomes through changes in relative prices, reallocations of resources, and the
introduction of new production techniques-all of which affect the organization of production, job creation, and
labor incomes (Anderson, 2005). According to the traditional Heckscher-Ohlin model associated with the
Stolper-Samuelson theorem (HOS), trade openness contributes to greater specialization of countries, an increase
in their national income, and a change in the primary distribution of income according to factor endowments.
The literature identifies three types of factors that determine inequality. First, economic determinants
such as population density (Heerink et al., 2001), income (Midlarsky and Roberts, 1985), natural resources
(Anyanwu et al., 2016), trade globalization (Laigle, 2005), financial globalization (Jaumotte et al., 2013),
government spending (Lee et al., 2013), inequality (Ongo-Nkoa and Song, 2019), and investments (Fosu, 2018).
Second, social determinants such as education (Buffi and Atolia, 2012), household size (Mahmood and Noor,
2014), unemployment (Shafiullah, 2011), and aid (Monnin, 2014). Third, institutional determinants such as
democracy (Brunori et al., 2015), governance (Campante and Do, 2007), colonial background (Bigstein, 2018),
and ethnolinguistic fragmentation (Shimeles et Nabassaga, 2018).
However, Bergh and Nilsson (2010) and Fluckiger et al (2002), using time series analysis, find that
increased trade openness generates income inequality in Switzerland. Similarly, Zhang and Zhang (2003) find
that trade globalization has increased inequality in China through the promotion of large regional income
differences. Aradhyula et al (2007) and Chakrabarti (2000) have investigated the effect of trade openness on
income and distributional levels. Using panel data from sixty paid surveys over the period 1985-1994, they find
that trade openness increases income inequality. Other studies have distinguished between the impact of trade
openness on developed and developing countries, finding that greater openness increases inequality, at least in
poor countries (Barro 2000; Ravallion 2001; Easterly, 2007; Bensidoun et al., 2011). For example, Borras
(2007) and Galiani and Sanguinatti (2003) pointed out that although trade openness led to increased production
in the agricultural sector, with local farmers competing with imports from neighboring countries, trade openness
not only failed to improve living standards in the Philippines but increased poverty and income inequality.
Furthermore, Dutt and Mukhopadhyay (2005) analyzed the correlation between globalization and income
inequality in developing countries between 1977 and 1998, concluding that trade openness and capital flows
have led to an increase in income inequality.
Recently, Anderson (2020) using computable general equilibrium models, finds that trade liberalization
tends to reduce poverty, but is more likely to increase income inequality in developing countries. Similarly, Hirte
et al, (2020) applying a gravity-type instrument that uses natural disasters hitting trading partners, as well as a
Bartik-type instrument, conclude that trade openness increases economic disparities in countries that have higher
domestic heterogeneity in terms of global market access and their intra-country trade costs.
However, other studies have confirmed a negative relationship between trade openness and income
inequality (Calderon and Chong, 2001), suggesting that greater trade openness is associated with lower income
inequality. Dollar and Kraay (2004) find that greater openness to improving the rule of law favorably affects
income distribution. This occurs if countries reduce regulatory barriers to competition, trade openness and
foreign direct investment. Reuveny and Li (2003) find that trade globalization significantly reduces levels of
income inequality in both developed and developing countries. Meyer (2003) finds that trade openness is
accompanied by a reduction in income inequality, gender inequality and sex segregation. Wagle (2007), Rama
(2002) concluded that trade openness reduces income inequality in developing countries. Causa, de Serres and
Ruiz (2015) pointed out that some trade reforms have contributed to narrowing inequality. Lin and Fu (2016)
using the Stolper-Samuelson theorem in the Heckscher-Ohlin model in a sample of developed and developing
countries over the period 1985-2012 found that trade openness reduces income inequality. Arabiyat et al, (2019),
Hartmann et al, (2017) show that countries exporting complex products have lower income inequality than those
exporting simple products. Similarly, Goh and Law (2019) using the system generalized method of moments in a
sample of 65 developed and developing countries over the period 1984-2012, find that trade openness
contributes to lower income inequality. Mahesh (2016) using the method of generalized moments in the system
over the period 1991-2013, finds that increasing trade openness contributes to the deterioration of income
inequality in BRICS countries.
However, Kentor (2001) finds no effect of trade globalization levels on income inequality trends in a
panel of 88 developing countries over the period 1980-1997. Meschi and Vivarelli (2009) suggest an
Does Trade Openness Increase Income Inequality in Africa? An Analysis....
*Corresponding Author: ZOGO EKASSI Richard1
www.aijbm.com 4 | Page
insignificant relationship between trade openness and income inequality in developing countries, but they find
that trade with developed countries intensifies income inequality in developing countries.
III. Some stylized facts
Three stylized facts can be noted to characterize trade openness and income inequality in Sub-Saharan Africa.
Trade openness remains low in Sub-Saharan Africa
According to Penn World Trade (2018), Sub-Saharan Africa remains on the margins of global trade,
accounting for less than 1.7 percent, compared to 40 percent for the European Union, 28 percent for East Asia,
14.5 percent for North America, 5 percent for Latin America, and 2 percent for Africa. Although Sub-Saharan
Africa's share of world trade is still marginal, some countries stand out such as Nigeria (0.054), Rwanda (0.043),
Kenya (0.040) and Botswana (0.039) due to the implementation of structural transformation strategies and
industrialization efforts. However, the composition of world trade is improving because exports are mainly
primary at 94 percent. Plausible explanations for this are the staking of value chains and efforts to diversify
production structures. Sub-Saharan Africa's participation in value chains is characterized by producing countries
supplying, mainly to developed countries, raw materials and semi-processed intermediate products with low
added value. As shown in Figure 1, intraregional trade in the regional economic communities was highest and
estimated at $34.7 billion in the Southern African Development Community (SADC), $18.7 billion in the
Community of Sahel-Saharan States (CEN-SAD), $11.4 billion in the Economic Community of West African
States (ECOWAS), and $10.7 billion in the African Union (AU), 10.7 billion for the Common Market for
Eastern and Southern Africa (COMESA), $4.2 billion for the Arab Maghreb Union (AMU), $3.1 billion for the
East African Community (EAC), and $0.8 billion for the Economic Community of Central African States
(ECCAS).
Graph 1 : Evolution of intra-regional trade in Sub-Saharan Africa (in billions of dollars between 1980-2018)
Source: Author, from World Bank Database (2019).
Income Inequality Rising in Sub-Saharan Africa
Figure 1 shows that seven of the ten most unequal countries in the world are in Sub-Saharan Africa.
Significant disparities remain between urban and rural areas, across regions and between countries. These
inequalities stem from the highly dualistic structure of the economy, multinational corporations and the
extractive sector, which offer a limited capacity to generate employment compared to the informal sector, and
lack of respect for environmental standards. In addition, the high concentration of physical capital, human capital
and land, and the limited distributive role of the state, manifested through the natural resource cause, amplify the
divergence in inequality in Sub-Saharan Africa.
0
5
10
15
20
25
30
35
40
SADC CEN-SAD ECOWAS COMESA CAE
Does Trade Openness Increase Income Inequality in Africa? An Analysis....
*Corresponding Author: ZOGO EKASSI Richard1
www.aijbm.com 5 | Page
Figure 2 : Average trends in income inequalities in Sub-Saharan Africa (1980-2018)
Source: Author, World Bank Database (2019).
Trade openness is positively correlated with income inequality
Trade openness is positively correlated with income inequality, as shown in Figure 3, provided that
countries ease the constraints on integration faced by economic operators and firms. These aspects, in addition to
constituting an issue for inequalities, favor the emergence of projects that are accompanied by a capacity for
insertion, innovation and hiring. Also, the capacity for trade increases income in those parts of the world where
diversification is advocated and reduces it in those localities where the concentration of export products is
accentuated.
Figure 1 : Correlations between trade openness and inequalities in Sub-Saharan Africa
Source: Author, World Bank Database (2019).
IV. Methodological strategy
The methodological strategy is presented in three steps: the empirical model, the estimation technique and
the data.
4.1. The empirical model
The model is inspired by the work of Mahesh (2016) and Hartmann et al, (2017) which highlight the
impact of exports and trade openness on income inequality in Africa. The compact version of the model is
described by equation 1.
_ _ (1)
it it it i t it
Income inequality Trade openness X
     
     
Where Income_inequalityit represents the inequality index of country i at date t. They describe the
income gap between the affluent who can afford better living conditions and those living below the income
0
10
20
30
40
50
60
70
Burundi
Burundi
Burundi
Burundi
Burundi
Burundi
Burundi
Burundi
Burundi
Burundi
Burundi
Burundi
Burundi
Burundi
Burundi
Burundi
Burundi
Burundi
Burundi
Burundi
Burundi
Burundi
Burundi
Burundi
Burundi
Burundi
Burundi
Burundi
Burundi
Burundi
Burundi
Burundi
Burundi
Burundi
Burundi
Burundi
Burundi
Burundi
Cameroon
Cameroon
Cameroon
Cameroon
Cameroon
Cameroon
Cameroon
Cameroon
Cameroon
Cameroon
Cameroon
Cameroon
Cameroon
Cameroon
Cameroon
Cameroon
Cameroon
Cameroon
Cameroon
Cameroon
Cameroon
Cameroon
Cameroon
Cameroon
Cameroon
Cameroon
Cameroon
Cameroon
Cameroon
Cameroon
Cameroon
Cameroon
Cameroon
Cameroon
Cameroon
Cameroon
Cameroon
Cameroon
Cabo Verde
Cabo Verde
Cabo Verde
Cabo Verde
Cabo Verde
Cabo Verde
Cabo Verde
Cabo Verde
Cabo Verde
Cabo Verde
Cabo Verde
Cabo Verde
Cabo Verde
Cabo Verde
Cabo Verde
Cabo Verde
Cabo Verde
Cabo Verde
Cabo Verde
Cabo Verde
Cabo Verde
Cabo Verde
Cabo Verde
Cabo Verde
Cabo Verde
Cabo Verde
Cabo Verde
Cabo Verde
Cabo Verde
Cabo Verde
Cabo Verde
Cabo Verde
Cabo Verde
Cabo Verde
Cabo Verde
Cabo Verde
Cabo Verde
Cabo Verde
Kenya
Kenya
Kenya
Kenya
Kenya
Kenya
Kenya
Kenya
Kenya
Kenya
Kenya
Kenya
Kenya
Kenya
Kenya
Kenya
Kenya
Kenya
Kenya
Kenya
Kenya
Kenya
Kenya
Kenya
Kenya
Kenya
Kenya
Kenya
Kenya
Kenya
Kenya
Kenya
Kenya
Kenya
Kenya
Kenya
Kenya
Kenya
Cote d'Ivoire
Cote d'Ivoire
Cote d'Ivoire
Cote d'Ivoire
Cote d'Ivoire
Cote d'Ivoire
Cote d'Ivoire
Cote d'Ivoire
Cote d'Ivoire
Cote d'Ivoire
Cote d'Ivoire
Cote d'Ivoire
Cote d'Ivoire
Cote d'Ivoire
Cote d'Ivoire
Cote d'Ivoire
Cote d'Ivoire
Cote d'Ivoire
Cote d'Ivoire
Cote d'Ivoire
Cote d'Ivoire
Cote d'Ivoire
Cote d'Ivoire
Cote d'Ivoire
Cote d'Ivoire
Cote d'Ivoire
Cote d'Ivoire
Cote d'Ivoire
Cote d'Ivoire
Cote d'Ivoire
Cote d'Ivoire
Cote d'Ivoire
Cote d'Ivoire
Cote d'Ivoire
Cote d'Ivoire
Cote d'Ivoire
Cote d'Ivoire
Cote d'Ivoire
Burkina Faso
Burkina Faso
Burkina Faso
Burkina Faso
Burkina Faso
Burkina Faso
Burkina Faso
Burkina Faso
Burkina Faso
Burkina Faso
Burkina Faso
Burkina Faso
Burkina Faso
Burkina Faso
Burkina Faso
Burkina Faso
Burkina Faso
Burkina Faso
Burkina Faso
Burkina Faso
Burkina Faso
Burkina Faso
Burkina Faso
Burkina Faso
Burkina Faso
Burkina Faso
Burkina Faso
Burkina Faso
Burkina Faso
Burkina Faso
Burkina Faso
Burkina Faso
Burkina Faso
Burkina Faso
Burkina Faso
Burkina Faso
Burkina Faso
Burkina Faso
Equatorial Guinea
Equatorial Guinea
Equatorial Guinea
Equatorial Guinea
Equatorial Guinea
Equatorial Guinea
Equatorial Guinea
Equatorial Guinea
Equatorial Guinea
Equatorial Guinea
Equatorial Guinea
Equatorial Guinea
Equatorial Guinea
Equatorial Guinea
Equatorial Guinea
Equatorial Guinea
Equatorial Guinea
Equatorial Guinea
Equatorial Guinea
Equatorial Guinea
Equatorial Guinea
Equatorial Guinea
Equatorial Guinea
Equatorial Guinea
Equatorial Guinea
Equatorial Guinea
Equatorial Guinea
Equatorial Guinea
Equatorial Guinea
Equatorial Guinea
Equatorial Guinea
Equatorial Guinea
Equatorial Guinea
Equatorial Guinea
Equatorial Guinea
Equatorial Guinea
Equatorial Guinea
Equatorial Guinea
Comoros
Comoros
Comoros
Comoros
Comoros
Comoros
Comoros
Comoros
Comoros
Comoros
Comoros
Comoros
Comoros
Comoros
Comoros
Comoros
Comoros
Comoros
Comoros
Comoros
Comoros
Comoros
Comoros
Comoros
Comoros
Comoros
Comoros
Comoros
Comoros
Comoros
Comoros
Comoros
Comoros
Comoros
Comoros
Comoros
Comoros
Comoros
Madagascar
Madagascar
Madagascar
Madagascar
Madagascar
Madagascar
Madagascar
Madagascar
Madagascar
Madagascar
Madagascar
Madagascar
Madagascar
Madagascar
Madagascar
Madagascar
Madagascar
Madagascar
Madagascar
Madagascar
Madagascar
Madagascar
Madagascar
Madagascar
Madagascar
Madagascar
Madagascar
Madagascar
Madagascar
Madagascar
Madagascar
Madagascar
Madagascar
Madagascar
Madagascar
Madagascar
Madagascar
Madagascar
Gabon
Gabon
Gabon
Gabon
Gabon
Gabon
Gabon
Gabon
Gabon
Gabon
Gabon
Gabon
Gabon
Gabon
Gabon
Gabon
Gabon
Gabon
Gabon
Gabon
Gabon
Gabon
Gabon
Gabon
Gabon
Gabon
Gabon
Gabon
Gabon
Gabon
Gabon
Gabon
Gabon
Gabon
Gabon
Gabon
Gabon
Gabon
Congo, Dem. Rep.
Congo, Dem. Rep.
Congo, Dem. Rep.
Congo, Dem. Rep.
Congo, Dem. Rep.
Congo, Dem. Rep.
Congo, Dem. Rep.
Congo, Dem. Rep.
Congo, Dem. Rep.
Congo, Dem. Rep.
Congo, Dem. Rep.
Congo, Dem. Rep.
Congo, Dem. Rep.
Congo, Dem. Rep.
Congo, Dem. Rep.
Congo, Dem. Rep.
Congo, Dem. Rep.
Congo, Dem. Rep.
Congo, Dem. Rep.
Congo, Dem. Rep.
Congo, Dem. Rep.
Congo, Dem. Rep.
Congo, Dem. Rep.
Congo, Dem. Rep.
Congo, Dem. Rep.
Congo, Dem. Rep.
Congo, Dem. Rep.
Congo, Dem. Rep.
Congo, Dem. Rep.
Congo, Dem. Rep.
Congo, Dem. Rep.
Congo, Dem. Rep.
Congo, Dem. Rep.
Congo, Dem. Rep.
Congo, Dem. Rep.
Congo, Dem. Rep.
Congo, Dem. Rep.
Congo, Dem. Rep.
Ethiopia
Ethiopia
Ethiopia
Ethiopia
Ethiopia
Ethiopia
Ethiopia
Ethiopia
Ethiopia
Ethiopia
Ethiopia
Ethiopia
Ethiopia
Ethiopia
Ethiopia
Ethiopia
Ethiopia
Ethiopia
Ethiopia
Ethiopia
Ethiopia
Ethiopia
Ethiopia
Ethiopia
Ethiopia
Ethiopia
Ethiopia
Ethiopia
Ethiopia
Ethiopia
Ethiopia
Ethiopia
Ethiopia
Ethiopia
Ethiopia
Ethiopia
Ethiopia
Ethiopia
Botswana
Botswana
Botswana
Botswana
Botswana
Botswana
Botswana
Botswana
Botswana
Botswana
Botswana
Botswana
Botswana
Botswana
Botswana
Botswana
Botswana
Botswana
Botswana
Botswana
Botswana
Botswana
Botswana
Botswana
Botswana
Botswana
Botswana
Botswana
Botswana
Botswana
Botswana
Botswana
Botswana
Botswana
Botswana
Botswana
Botswana
Botswana
Gambia, The
Gambia, The
Gambia, The
Gambia, The
Gambia, The
Gambia, The
Gambia, The
Gambia, The
Gambia, The
Gambia, The
Gambia, The
Gambia, The
Gambia, The
Gambia, The
Gambia, The
Gambia, The
Gambia, The
Gambia, The
Gambia, The
Gambia, The
Gambia, The
Gambia, The
Gambia, The
Gambia, The
Gambia, The
Gambia, The
Gambia, The
Gambia, The
Gambia, The
Gambia, The
Gambia, The
Gambia, The
Gambia, The
Gambia, The
Gambia, The
Gambia, The
Gambia, The
Gambia, The
Mali
Mali
Mali
Mali
Mali
Mali
Mali
Mali
Mali
Mali
Mali
Mali
Mali
Mali
Mali
Mali
Mali
Mali
Mali
Mali
Mali
Mali
Mali
Mali
Mali
Mali
Mali
Mali
Mali
Mali
Mali
Mali
Mali
Mali
Mali
Mali
Mali
Mali
Eritrea
Eritrea
Eritrea
Eritrea
Eritrea
Eritrea
Eritrea
Eritrea
Eritrea
Eritrea
Eritrea
Eritrea
Eritrea
Eritrea
Eritrea
Eritrea
Eritrea
Eritrea
Eritrea
Eritrea
Eritrea
Eritrea
Eritrea
Eritrea
Eritrea
Eritrea
Eritrea
Eritrea
Eritrea
Eritrea
Eritrea
Eritrea
Eritrea
Eritrea
Eritrea
Eritrea
Eritrea
Eritrea
Guinea
Guinea
Guinea
Guinea
Guinea
Guinea
Guinea
Guinea
Guinea
Guinea
Guinea
Guinea
Guinea
Guinea
Guinea
Guinea
Guinea
Guinea
Guinea
Guinea
Guinea
Guinea
Guinea
Guinea
Guinea
Guinea
Guinea
Guinea
Guinea
Guinea
Guinea
Guinea
Guinea
Guinea
Guinea
Guinea
Guinea
Guinea
Benin
Benin
Benin
Benin
Benin
Benin
Benin
Benin
Benin
Benin
Benin
Benin
Benin
Benin
Benin
Benin
Benin
Benin
Benin
Benin
Benin
Benin
Benin
Benin
Benin
Benin
Benin
Benin
Benin
Benin
Benin
Benin
Benin
Benin
Benin
Benin
Benin
Benin
Lesotho
Lesotho
Lesotho
Lesotho
Lesotho
Lesotho
Lesotho
Lesotho
Lesotho
Lesotho
Lesotho
Lesotho
Lesotho
Lesotho
Lesotho
Lesotho
Lesotho
Lesotho
Lesotho
Lesotho
Lesotho
Lesotho
Lesotho
Lesotho
Lesotho
Lesotho
Lesotho
Lesotho
Lesotho
Lesotho
Lesotho
Lesotho
Lesotho
Lesotho
Lesotho
Lesotho
Lesotho
Lesotho
Ghana
Ghana
Ghana
Ghana
Ghana
Ghana
Ghana
Ghana
Ghana
Ghana
Ghana
Ghana
Ghana
Ghana
Ghana
Ghana
Ghana
Ghana
Ghana
Ghana
Ghana
Ghana
Ghana
Ghana
Ghana
Ghana
Ghana
Ghana
Ghana
Ghana
Ghana
Ghana
Ghana
Ghana
Ghana
Ghana
Ghana
Ghana
Congo, Rep.
Congo, Rep.
Congo, Rep.
Congo, Rep.
Congo, Rep.
Congo, Rep.
Congo, Rep.
Congo, Rep.
Congo, Rep.
Congo, Rep.
Congo, Rep.
Congo, Rep.
Congo, Rep.
Congo, Rep.
Congo, Rep.
Congo, Rep.
Congo, Rep.
Congo, Rep.
Congo, Rep.
Congo, Rep.
Congo, Rep.
Congo, Rep.
Congo, Rep.
Congo, Rep.
Congo, Rep.
Congo, Rep.
Congo, Rep.
Congo, Rep.
Congo, Rep.
Congo, Rep.
Congo, Rep.
Congo, Rep.
Congo, Rep.
Congo, Rep.
Congo, Rep.
Congo, Rep.
Congo, Rep.
Congo, Rep.
Mauritius
Mauritius
Mauritius
Mauritius
Mauritius
Mauritius
Mauritius
Mauritius
Mauritius
Mauritius
Mauritius
Mauritius
Mauritius
Mauritius
Mauritius
Mauritius
Mauritius
Mauritius
Mauritius
Mauritius
Mauritius
Mauritius
Mauritius
Mauritius
Mauritius
Mauritius
Mauritius
Mauritius
Mauritius
Mauritius
Mauritius
Mauritius
Mauritius
Mauritius
Mauritius
Mauritius
Mauritius
Mauritius
Liberia
Liberia
Liberia
Liberia
Liberia
Liberia
Liberia
Liberia
Liberia
Liberia
Liberia
Liberia
Liberia
Liberia
Liberia
Liberia
Liberia
Liberia
Liberia
Liberia
Liberia
Liberia
Liberia
Liberia
Liberia
Liberia
Liberia
Liberia
Liberia
Liberia
Liberia
Liberia
Liberia
Liberia
Liberia
Liberia
Liberia
Liberia
Guinea-Bissau
Guinea-Bissau
Guinea-Bissau
Guinea-Bissau
Guinea-Bissau
Guinea-Bissau
Guinea-Bissau
Guinea-Bissau
Guinea-Bissau
Guinea-Bissau
Guinea-Bissau
Guinea-Bissau
Guinea-Bissau
Guinea-Bissau
Guinea-Bissau
Guinea-Bissau
Guinea-Bissau
Guinea-Bissau
Guinea-Bissau
Guinea-Bissau
Guinea-Bissau
Guinea-Bissau
Guinea-Bissau
Guinea-Bissau
Guinea-Bissau
Guinea-Bissau
Guinea-Bissau
Guinea-Bissau
Guinea-Bissau
Guinea-Bissau
Guinea-Bissau
Guinea-Bissau
Guinea-Bissau
Guinea-Bissau
Guinea-Bissau
Guinea-Bissau
Guinea-Bissau
Guinea-Bissau
Central African Republic
Angola
Angola
Angola
Angola
Angola
Angola
Angola
Angola
Angola
Angola
Angola
Angola
Angola
Angola
Angola
Angola
Angola
Angola
Angola
Angola
Angola
Angola
Angola
Angola
Angola
Angola
Angola
Angola
Angola
Angola
Angola
Angola
Angola
Angola
Angola
Angola
Angola
Angola
Mozambique
Mozambique
Mozambique
Mozambique
Mozambique
Mozambique
Mozambique
Mozambique
Mozambique
Mozambique
Mozambique
Mozambique
Mozambique
Mozambique
Mozambique
Mozambique
Mozambique
Mozambique
Mozambique
Mozambique
Mozambique
Mozambique
Mozambique
Mozambique
Mozambique
Mozambique
Mozambique
Mozambique
Mozambique
Mozambique
Mozambique
Mozambique
Mozambique
Mozambique
Mozambique
Mozambique
Mozambique
Mozambique
0
2
4
6
8
Income
Inequality
0 50 100 150
Trade Openness
Coef. Slope = 0.01 Std. Err. = 0.00 F-Stat. = 34.35
Does Trade Openness Increase Income Inequality in Africa? An Analysis....
*Corresponding Author: ZOGO EKASSI Richard1
www.aijbm.com 6 | Page
poverty line (Mahmmod and Noor, 2014). 〖Trade_openness〗_it is trade openness as measured by Squalli and
Wilson's (2011) indicators. It incorporates five indicators that take into account:
 The trade share of country i in world trade (TS), i.e. the sum of exports and imports in relation to GDP. With
TS, the Trade Share index; X is the volume of exports; M is the volume of imports; GDP is the gross
domestic product in real terms and i is the index relative to the different countries. This measure is
important because it allows us to capture the trade gains of the country under consideration. Its formula is as
follows :
( )/
i
TS X M PIB
 
 The proportion of the country's trade in relation to the world average. For a value greater than 1, the country
participates strongly in the world average trade. With CTSirepresents the composite trade share index or
Composite Trade Share. The CTSi index is calculated as follows:
1
( ) ( )
*
1
( )
i i
i n
i
j
j
X M X M
CTS
PIB
X M
n 
 



 The trade openness index is measured by the World Trade Share or WTSi. It captures the relative
contribution that a country has in world trade. With j the index of all countries in a considered group. The
larger WTSi of country i, the better the country's contribution to world trade. Its formula is as follows:
1
( )
( )
i
i n
j
j
X M
WTS
X M





For the first three indices of trade openness presented above, Organization for Economic Cooperation
and Development (OECD) countries lead in the following order: United States, Germany, Russia, Great Britain,
and Japan (Squalli and Wilson, 2011). Generally, African countries occupy the last places in the ranking.
 The share of exports in the GDP of country i as a measure of trade openness. This index provides
information on the weight of exports in the GDP of country i. Overall, it provides an overview of the
volume of exports in relation to national production. On the other hand, it provides little information on the
behavior of the country in relation to the trade volume of other countries. However, high weight of the
volume of exports in the GDP reflects its degree of openness. Its formula is as follows.
i
i
i
X
x
PIB

 The share of imports in the GDP of country i. The index provides information on the volume of imports
in the GDP.
i
i
i
M
m
PIB

The last two indices capture the volume of trade in the country's GDP. They provide little information
on the positioning of the country in relation to other countries at the global level (Harrison, 1996). These
measures illustrate the ranking of African countries according to their degree of trade openness.
X is the vector of control variables composed of:(i) real gross domestic product (GDP) growth increases
the volume of trade based on diversification of production on the one hand and the search for gains from trade on
the other (Chen and Turnovsky, 2010); (ii) human capital approximated by the number of students enrolled in
secondary school. It explains the ability to acquire and internalize new technologies (Anyanwu, 2014). A better-
educated population will tend to import sophisticated goods, thus compensating for the insufficient
modernization of the national production system; (iii) domestic investment, measured by gross fixed capital
formation, reflects the acquisition of new equipment in order to increase production and captures the
contribution of the private sector to national production (Choong et al., 2010). Thus, µi captures unobserved
country-specific effects. νt captures the time-specific effect common to all countries and εit is the error term.
Thus, α, β and φ are the parameters to be estimated.
4.2. The estimation technique
The estimation technique adopted is Double Least Squares (DLS), which is used when in a linear
regression at least one of the explanatory variables is endogenous or when an explanatory variable is measured
with error (Nwakuya and Ijomah, 2017). In this case, that variable and the error term will be correlated. To
estimate such a model, it is more advisable to consider instrumental variables. In the case of an endogeneity
problem, it is also advisable to use the generalized method of moments. However, considering that the changes
in the data on the Women's Political Empowerment indices, very little fluctuation emerges. Thus, the lagged
variables have little influence on the present variables. We then decline this technique. However, if an
endogenous variable exists, the classic model techniques are no longer considered. If such a variable exists, it is
Does Trade Openness Increase Income Inequality in Africa? An Analysis....
*Corresponding Author: ZOGO EKASSI Richard1
www.aijbm.com 7 | Page
possible to obtain a convergent estimate of the parameter of interest. The most classical estimator is the double
least squares estimator. It is obtained by regressing the dependent variable not on the endogenous regressor, but
on its ordinary least squares prediction from the first stage regression. We then carry out a double estimation,
hence the name of Double Least Square. Moreover, having verified the non-existence of an endogeneity
problem, the robustness of the results is achieved by estimating the basic model by Ordinary Least Squares. This
technique reduces the problem of measuring the dependent variable.
4.3. The data
The sample consists of 38 countries in Africa (Table 1). The study covers the period 1980-2018. The
availability of data on the various indices of trade openness justifies the sample size. Macroeconomic variables
are taken from the World Bank's World Development Indicators (2018). Income inequality specific data are
taken from Standardized World Income Inequality Database (SWIID).
Table1: List of countries
Sierra Leone, Seychelles, Gabon, Ghana, Zambia, Mauritius, Mozambique, Benin, Malawi, Erythree, Ouganda,
Rwanda, Sao Tome and Principe, Guinea-Bissau, Cape Verde, Afrique du sud, Botswana
Kenya, Nigeria, Equatorial Guinea, Madagascar, Gambia, RDC, Comores, Guinea, Angola, Namibia, Burundi,
Burkina Faso, Cote d'Ivoire, Chad, Senegal, Mali, Tanzania, Swaziland, RCA, Congo, Togo, Lesotho,
Cameroon, Liberia, Ethiopia, Niger
Source: author.
The descriptive statistics show small variations (Table 2). It is recognized that when the data fluctuate
slightly, the results tend to converge.
Table2:Descriptives statistics
Variables Observations Moyennes Ecart-type Minimum Maximum
Income inequalities 1634 3.937821 12.87274 8.740 65.8
Trade share(TS) 1634 69.32657 35.94212 6.320343 311.3541
Composition of trade(CTS) 1634 87.14805 215.7527 0 1931.51
World trade share(WTS) 1634 6286.614 18728.93 0 193151
Export/PIB 1634 29.45556 18.83434 2.524688 107.9944
Import/PIB 1634 39.87101 21.45984 2.982036 236.391
GDP/Capiter 1634 4.011719 7.128599 -50.24807 149.973
Human capital 1634 33.38022 24.71945 2.48434 115.9565
Private investment 1634 20.33231 9.203847 -2.424358 89.38613
Source: author, from World Bank Database (2019).
The correlations between the different analysis variables are not high enough to cause serious
multicollinearity problems (Table 3). Financial development indicators are positively correlated with trade
openness.
Tableau 3 : Correlation matrix
Income_ine TS CTS WTS WTSPRIME X/PIB M/PIB GDP Hum_cap Dom_inv
Income_ine 1.0000
TS -0.0132 1.0000
CTS 0.0021 0.0526 1.0000
WTS 0.0045 0.0762 1.0000 1.0000
WTSPRIME 0.0046 0.0762 1.0000 1.0000 1.0000
X/PIB 0.3398 0.6510 0.6728 0.4650 0.0280 1.0000
M/PIB 0.0938 0.1832 0.2103 0.0664 0.1277 -0.063 1.0000
GDP -0.0058 0.1241 0.0479 0.0258 0.0257 0.0434 -0.025 1.0000
Human_cap 0.0441 0.4492 0.3398 0.3552 0.3553 0.6728 0.4650 0.0280 1.0000
Domes_inves -0.0108 0.3120 0.0938 0.1118 0.1118 0.2103 0.0664 0.1277 0.2184 1.0000
Source: author.
V. Results and interpretations
We first present the results of the basic model and then we perform a robustness analysis.
5.1. Trade Openness and Inequality: Results from the Basic Model
Table 4 below illustrates the relative relevance of the variables. Overall, the results show that the
relative shares of home country trade, home country trade to world average trade, world trade composition,
exports and imports to GDP increase income inequality in SSA. As a result, there are barriers to social inclusion,
which fuel poverty as people seek better opportunities. In addition, the low diversification of traded products and
the lack of true value chains in the different commodity chains is not beneficial to the poor in SSA, as it hinders
Does Trade Openness Increase Income Inequality in Africa? An Analysis....
*Corresponding Author: ZOGO EKASSI Richard1
www.aijbm.com 8 | Page
the efficient allocation of capital, which inhibits overall growth by tightening credit constraints that largely
disadvantage households, to the benefit of income inequality. However, trade flows accentuate the inequity of
income and wage distribution. Although these results run counter to traditional HOS theory, they confirm the
theoretical model of Feenstra and Hanson (1996). Indeed, when developing countries trade with developed
countries, income inequality increases. Although trade openness is unequal in terms of income distribution, in
developed countries it is the main source of income for the poor. Trade liberalization has aggravated income
inequality in Sub-Saharan Africa by reducing the share of value added in manufacturing, coupled with relative
macroeconomic stability, higher inflation, and a less competitive real exchange rate that exacerbates income
disparity. The increase in inequality is also attributable to the decline in the share of value added of labor-
intensive manufacturing in total output, which has been induced by trade liberalization and the corresponding
decline in the average tariff rate.
While trade openness in Africa has helped improve production efficiency, it has not allowed
firms to achieve economies of scale (lower unit production costs as the market size increases). This lack
of price decline is compounded by the lack of diversity of supply, which is a source of price instability,
particularly in agricultural markets. The embryonic development of global value chains does not allow
for the integration of some African countries into globalization, thus reducing national income per
capita. Yet GVCs offer the opportunity to integrate into global markets at lower cost, since firms will
only produce a portion of the final product. As a result, the gains from participating in GVCs and
globalization, in general, are not equally distributed across and within countries, leading to rising
inequality. The adverse effects of trade openness are very often localized and long-lasting because of
interregional and intersectoral rigidities in labor mobility. These aspects exacerbate inequalities due to
the predominance of large firms, wage premiums that reflect rents that firms share with labor, and the
intensification of competition in the final goods market that the elimination of trade barriers bring about.
Thus, trade openness affects industrial wage premiums through labor productivity. Indeed, if industrial
firms facing the largest tariff cuts following liberalization of their sector manage to improve their
relative productivity, they will be able to transfer part of these productivity gains in the form of wage
increases. Nevertheless, there is a significant risk that rising income inequality will lead to conflict and
civil war.
Table 4: Effects of trade openness on income inequality in Sub-Saharan Africa
Estimation technique : Doubles Least Squares
Dependante variable: Income inequality
(1) (2) (3) (4) (5) (6)
GDP/Capita 0.0344** 0.0434** 0.0459*** 0.0348* 0.0396*** 0.0419***
(0.0283) (0.0283) (0.0334) (0.0282) (0.0284) (0.0281)
Human capital 0.0446*** 0.0368*** 0.0529*** 0.0499*** 0.0404*** 0.0376***
(0.0058) (0.0063) (0.0066) (0.0061) (0.0063) (0.0060)
Domestic investment 0.0486*** 0.0369** 0.0648*** 0.0465*** 0.0445*** 0.0335**
(0.0148) (0.0152) (0.0164) (0.0148) (0.0150) (0.0152)
Trade Share (TS) 0.0144***
(0.0448)
Composition Trade Share (CTS) 0.00175***
(0.0066)
World Trade Share (WTS) 0.0508*
(0.0292)
Exportations/GDP 0.0139*
(0.0827)
Importations/GDP 0.0294***
(0.0757)
Constante -0.706* -1.140*** -1.206*** -0.698* -0.850** -1.292***
(0.372) (0.394) (0.429) (0.371) (0.382) (0.399)
Observations 817 817 693 817 817 817 817
Countries 38 38 38 38 38 38 38
R2
0.098 0.110 0.130 0.107 0.107 0.101 0.115
Notes: ( ) standard deviations robust to heteroscedasticity *, **, and *** indicate significance at the 10%, 5%,
and 1% confidence level respectively.
Source: author.
Real GDP per capita increases income inequality in Sub-Saharan Africa. The plausible explanations are
that the low level of income that characterizes African wage earners and non-wage earners does not allow them
Does Trade Openness Increase Income Inequality in Africa? An Analysis....
*Corresponding Author: ZOGO EKASSI Richard1
www.aijbm.com 9 | Page
to meet their basic needs or to afford decent housing because of the high cost of living. In addition, the
inefficient redistribution of the benefits of growth, particularly natural resources, does not benefit all segments of
the population. As a result, marginalized populations find themselves in a precarious situation, unable to find
housing even at lower costs. This finding corroborates that of Fosu (2018) who points out that socioeconomic
disparities increase income inequality in Africa.
Human capital contributes to accentuating income inequalities because of the knowledge acquired by
populations, and therefore membership in international organizations by almost all African countries restricts
activities that affect income disparities. Indeed, human capital induces a propensity for educated people to want
to migrate even though they do not have the means. As a result, these people end up in uncomfortable housing at
the risk of their well-being. Education and learning are of relative quality and inequality and exclusion exist at all
levels. Even with the substantial increase in the number of children accessing basic education, a large number are
still out of school due to the distribution of essential infrastructure such as schools. These findings are consistent
with those of Acosta et al (2008).
Private investment has a positive and statistically significant effect on income inequality in Sub-Saharan
Africa. Moreover, human capital is a multidimensional and multifunctional factor in income inequality. As a
component inserted in specific socio-historical systems, it constitutes a process of formation of economic agents,
but not of socialization, which crowds out the diffuse process of transmission and creation of value, favoring the
perpetual stockpiling of skills, the absence of innovation within production units, which reduces their supply to
international trade. This result could be explained by the fact that private investment is not a prerequisite and
indispensable condition for the processes of reducing disparities, as well as for the effective application of
strategies to eradicate the daily obstacles of households. As the engine that drives the economic machine, it does
not allow entrepreneurs to gather the resources needed to produce goods and services that are conducive to job
creation, the adoption of innovations, and especially international trade. These results corroborate those of
Alejandro et Chavèz (2016).
5.2. Robustness analysis
In order to ensure the robustness of our results, we estimate the effects of trade openness on income
inequality in Sub-Saharan Africa using the Pool Mean Group econometric technique.
Overall, the results are consistent with those obtained in the baseline model and the empirical
literature. The relative shares of home country trade, home country trade to average world trade, world
trade composition, exports and imports to GDP increase income inequality in Sub-Saharan Africa as
shown in Table 5 below. Without claiming to be exhaustive, three explanations can be put forward. First,
the highly dualistic structure of the economy, where jobs in government, multinationals, and the resource
sector are reserved for elites, while the majority of workers have to make do with much lower incomes
from the formal economy or the subsistence sector (Buffi and Atolia, 2012). Second, the high
concentration of physical capital, human capital, and land, especially in the East and Southern African
economies and in specific groups or regions. Finally, the limited distributive role of the state, often
manifested through the "natural resource curse," urban bias in public policy, and ethnic and gender
inequalities. These explanations are compounded by rising domestic and international investment in
extractive industries and rising terms of trade in resource-rich countries, which polarize income
disparities. Recent literature also highlights the suboptimal structural transition of the economy from
cash crop agriculture characterized by low levels of inequality to sectors with high levels of inequality,
such as livestock production, trade, transport, and formal and informal services, which are responsible
for inequality. There is also an uneven distribution of socioeconomic and physical facilities (roads,
electricity, schools, hospitals, water, and sanitation) between rural and urban areas and across regions,
leading to income disparities. These results are consistent with those ofHirte et al., (2020), Bergh et Nilsson
(2010).
Table 5: Effects of trade openness on income inequality in Sub-Saharan Africa
Estimation technique : Pool Mean Group
Dependante variable: Income inequality
(1) (2) (3) (4) (5) (6)
GDP/Capita 0.0276**
0.0378**
* 0.0409 0.0258* 0.0334* 0.0369*
(0.0202) (0.0214) (0.0268) (0.0196) (0.0217) (0.0208)
Human capital
0.0456**
*
0.0376**
* 0.0544*** 0.0515***
0.0411**
* 0.0382***
(0.0050) (0.0070) (0.0053) (0.0053) (0.0077) (0.0052)
Investissement
domestique
0.0446**
* 0.0312** 0.0571*** 0.0433***
0.0397**
* 0.0275**
Does Trade Openness Increase Income Inequality in Africa? An Analysis....
*Corresponding Author: ZOGO EKASSI Richard1
www.aijbm.com 10 | Page
(0.0125) (0.0143) (0.0158) (0.0122) (0.0138) (0.0130)
Trade Share (TS) 0.0158*
(0.0086)
Composition Trade Share (CTS) 0.0174***
(0.0044)
World Trade Share (WTS) 0.0456***
(0.0050)
Exportations/PIB 0.0165
(0.0181)
Importations/PIB 0.0315***
(0.0108)
Constante -0.683**
-
1.170*** -1.117*** -0.730***
-
0.872*** -1.290***
(0.270) (0.313) (0.315) (0.268) (0.274) (0.318)
Observations 817 817 693 817 817 817
Countries 38 38 38 38 38 38
R2
0.76 0.84 0.64 0.67 0.83 0.57
Notes: ( ) standard deviations robust to heteroscedasticity *, **, and *** indicate significance at the 10%, 5%,
and 1% confidence level respectively.
Source: author.
IV. Conclusion
The objective of this paper was to assess the role of trade openness on income inequality using a sample
of 38 Sub-Saharan African countries over the period 1980-2018. Starting from traditional and modern theories of
international trade and inequality, we considered the five measures of trade openness proposed by Squalli and
Wilson (2011). To the best of our knowledge, very few works have taken such an encompassing empirical
approach. From the estimates made on a dynamic panel data model by Double Least Squares, the results indicate
that the relative share of domestic country trade, the relative share of trade in the composition of world trade, the
share of exports to GDP, the share of imports to GDP, and the relative share of domestic country trade to average
world trade increase income inequality in Sub-Saharan Africa.
From these results, some non-exhaustive policy suggestions can be made to mitigate income inequality
in SSA. First, the implementation of appropriate strategies to attract investment in processing sectors,
particularly in industry, in order to reduce raw product exports and consolidate the industrial fabric of African
economies. Second, to reduce imports, particularly of food products, by implementing reforms to increase the
productivity of agricultural sectors and organize regional markets. Third, consolidate and finalize the
implementation of structural reforms to improve the competitiveness of traditional export sectors and diversify
the supply of goods and services.
References
[1]. Adam S. (1776), Research on the nature and causes of the wealth of nations. Book IV: Systems of
political economy.
[2]. Anderson E. (2020), The impact of trade liberalization on poverty and inequality: evidence from CGE
models, Journal of Policy Modeling (2020), doi: https://doi.org/10.1016/j.jpolmod.2020.05.006
[3]. Alderson A-S, Nielsen F (2003), Globalization and the Great U-turn: Income Inequality Trends in 16
OECD Countries. American Journal of Sociology, 107: 1244-1299.
[4]. Anderson E. (2005). Openness and Inequality in Developing Countries: A review of theory and recent
evidence. World Development, 33(7),1045-1063.
[5]. Anyanwu J-C., Andrew E-O., Erhijakpor, Emeka O. (2016) Empirical Analysis of the Key Drivers of
Income Inequality in West Africa. African Development Review, 28(1), 18-38.
[6]. Arabiyat T. S., Metri F. M., Samawi G. A. (2019), Trade Openness, Inclusive Growth, And Inequality:
Evidence from Jordan. Journal of Developing Areas.
[7]. Aradhyula S., Rahman T., Seenivasan K. (2007), Impact of international trade on income and income
inequality”, paper presented at American Agricultural Economics Association Annual Meeting,
Portland.
[8]. Asteriou D., Dimelis S., Moudatsou A. (2014), Globalization and income inequality: A panel data
econometric approach for the EU27 countries. Economic Modelling, 36, 592-599.
[9]. Baldwin R., Krugman P. (1989), Persistent trade effects of large exchange rate shocks. Quarterly
Journal of Economics, 104 (4), 635-654.
Does Trade Openness Increase Income Inequality in Africa? An Analysis....
*Corresponding Author: ZOGO EKASSI Richard1
www.aijbm.com 11 | Page
[10]. Barro R. J. (2000), Inequality and growth in a panel of countries. Journal of Economic Growth, 5(1), 5-
32.
[11]. Bensidoun I. Jean S., Sztulman A. (2011), International trade and income distribution: reconsidering the
evidence’, Review of World Economics, 147(4), 593-619.
[12]. Bergh A., Nilsson T. (2010), Do liberalization and globalization increase income inequality? European
Journal of Political Economy, 26(4),488-505.
[13]. Bigsten A. (2018), Determinants of the Evolution of Inequality in Africa. Journal of African
Economies, 27(1),127-148.
[14]. Borras Jr. S. M. (2007), Free market, export-led development strategy and its impact on rural
livelihoods, poverty and inequality: The Philippine experience seen from a Southeast Asian perspective.
Review of International Political Economy, 14(1), 143-175.
[15]. Brunori P., Palmisano F., Peragine V. (2015), Inequality of opportunity in Sub-Saharan Africa. Policy
Research Working Paper No. 7782, World Bank, Washington, DC.
[16]. Buffie E., Atolia M. (2012), Trade, growth and poverty in Zambia: insights from a dynamic GE model.
Journal of Policy Modeling, 34, 211-229.
[17]. Chakrabarti A. (2000). Does trade cause inequality? Journal of Economic Development, 25(2), 1-21.
[18]. Calderon C., Chong A. (2001), External sector and income inequality in interdependent economies
using a dynamic panel data approach. Economics Letters, 71, 225-231.
[19]. Campante F., Do Q-A. (2007), Inequality, Redistribution, and Population. Faculty Research Working
Papers Series, RWP07-046, John F. Kennedy School of Government, Harvard University, October.
[20]. Chang E. C. C., Wu W-C. (2016), Preferential trade agreements, income inequality, and authoritarian
survival. Political Research Quarterly, 69 (2), 281-294.
[21]. Chen Y. C., Turnovsky S. J. (2010), Growth & inequality in a small open economy. Journal of
Macroeconomics, 32, 497-514.
[22]. Choong Ch., Baharumshah A., Yusop Z. et Habibullah M. (2010), Private Capital Flows, Stock Market
and Economic Growth in Developed and Developing Countries: A Comparative Analysis. Japan and
the World Economy, 22, 107-117.
[23]. Daymon C. (2012), Ouverture commerciale, inégalités de revenu et répartition salariale dans les pays du
Sud et de l’Est de la méditerranée. Région et Développement, 35, 84-98.
[24]. Dollar D., Kraay A. (2002), Growth is good for the poor. Journal of Economic Growth, 7(3), 195-225.
[25]. Dollar D., Kraay A. (2004), Trade, growth, and poverty. The Economic Journal, 114, 22-49.
[26]. Dreher A., Gaston N. (2008), Has globalization increased inequality. Review of International
Economics, 16 (3), 516-536.
[27]. Dutt A. K., Mukhopadhyay K. (2005), Globalisation and the inequality among nations: A VAR
approach. Economics Letters, 88(3), 295-299.
[28]. Easterly W. (2007), Globalization, prosperity, and poverty’ in Globalization and poverty, eds A
Harrison, University of Chicago Press for National Bureau of Economic Research., Chicago, pp. 109–
142.
[29]. Enrique G., Gulde A.-M., Rodolfo M. (2014), Développement financier en Afrique subsaharienne : les
enjeux pour une croissance soutenue. Revue d’Economie Financière, 116(4), 19-42.
[30]. Feenstra, R. C., Hanson G. H. (1996), Foreign Investment, Outsourcing and Relative Wages. Pages 89–
127 of: Feenstra, Robert C., Grossman, Gene M., & Irwin, Douglas A. (eds), The Political Economy of
Trade Policy: Papers in Honor of Jagdish Bhagwati. Cambridge: MIT Press.
[31]. Fluckiger Y., Ramirez J., Deutsch J., Silber J. (2002). Inequality of income and openness to foreign
trade. Schweizerische Zeitschrift fur Soziologie, 28, 241-265.
[32]. Fosu A. (2018) Economic Structure, Growth, and Evolution of Inequality and Poverty in Africa: An
Overview. Journal of African Economies, 27(1), 1-9.
[33]. Galiani S., Sanguinetti P. (2003), The impact of trade liberalization on wage inequality: Evidence from
Argentina, Journal of Development Economics, 72(2), 497-513.
[34]. Goldberg P. K., Pavcnik N. (2007), Distributional effects of globalization in developing countries.
Journal of Economic Literature, 45(1), 39-82.
[35]. Gourdon, J., Maystre, N., De Melo, J. (2008), Openness, inequality and poverty: Endowments matter.
Journal of International Trade & Economic Development, 17(3), 343-378.
[36]. Grossman G. M., Rossi-Hansberg E. (2008), Trading tasks: A simple theory of Offshoring. American
Economic Review, 98(5), 1978-1997.
[37]. Green F., Dickerson A., Arbache J. (2001), A picture of wage inequality and the allocation of labor
through a period of trade liberalization: The case of Brazil. World Development, 29(11), 1923-1939.
[38]. Harrison A., McLaren J., McMillan M. (2010), Recent findings on trade and inequality. NBER Working
Paper Series No.16425. Cambridge, MA: National Bureau of Economic Research.
Does Trade Openness Increase Income Inequality in Africa? An Analysis....
*Corresponding Author: ZOGO EKASSI Richard1
www.aijbm.com 12 | Page
[39]. Hartmann D., Mayra B., Lodolo B., Pinheiro E. L. (2017), International trade, development traps, and
the core-periphery structure of income inequality. EconomiA, 21, 255-278.
[40]. Heerink N., Mulatu A., Bulte E. (2001), Income inequality and the environment: aggregation bias in
environmental Kuznets curves. Ecological Economics, 38(3), 359-367.
[41]. Hirte G., Lessmann C., Seide A. (2020), International trade, geographic heterogeneity and interregional
inequality. European Economic Review, 127, 103427. https://doi.org/10.1016/j.euroecorev.2020.103427
[42]. Jaumotte F., Lall S., Papageorgiou C. (2013) Rising Income Inequality: Technology, or Trade and
Financial Globalization? IMF Economic Review, 61(2), 271-309.
[43]. Kentor J. (2001), The long-term effects of globalization on income inequality, population growth, and
economic development. Social Problems, 48, 435-455.
[44]. Kletzer K., Bardhan P. (1987), Credit markets and patterns of international trade. Journal of
Development Economics, 27(7), 57-70.
[45]. Krugman P. R. (1979), Increasing Returns, Monopolistic Competition, and International Trade. Journal
of International Economics, 9(4), 469-479.
[46]. Krugman P. R. (2008), Trade and Wages, Reconsidered. Brookings Papers on Economic Activity,
2008(1), 103-154.
[47]. Laigle L. (2005), Inégalités et développement urbain, Programme Politiques territoriales de
développement durable, PUCA – METATTM.
[48]. Lee H-Y., Kim J., Cin B-C. (2013) Empirical Analysis on the Determinants of Income Inequality in
Korea. International Journal of Advanced Science and Technology, 53, 95-109.
[49]. Lee J., Wei D. (2015), Technological change, skill demand, and wage inequality: Evidence from
Indonesia. World Development, 67, 238-250.
[50]. Levine R. (2005), Finance and Growth: Theory and Evidence, in Aghion P. et Durlauf S. (éd.),
Handbook of Economic Growth, edition 1, vol. 1, chap. 12, pp. 865-934.
[51]. Lim G. C., McNelis P. D. (2016), Income growth and inequality: The threshold effects of trade and
financial openness. Economic Modelling, http://dx.doi.org/10.1016/j.econmod.2016.05.010
[52]. Lin F., Fu D. (2016), Trade, Institution Quality and Income Inequality. World Development, 77, 129-
142,
[53]. Mahesh M. (2016), The effects of trade openness on income inequality - evidence from BRIC countries,
Economics Bulletin, 36(3), 1751-1761
[54]. Mahmood S., Noor Z-M. (2014), Human capital and income inequality in developing countries: new
evidence using the Gini coefficient. Journal of Entrepreneurship and Business, 2(1), 40-48.
[55]. Meschi E., Vivarelli M. (2009). Trade and income inequality in developing countries. Journal of World
Development, 37(2), 287-302
[56]. Midlarsky M., Roberts K. (1985), Class, State, and Revolution in Central America: Nicaragua and El
Salvador Compared. Journal of Conflict Resolution, 29, 163-193.
[57]. Monnin P. (2014), Inflation and Income Inequality in Developed Economies. CEP Working Paper
2014/1,
[58]. May.
[59]. North D. C. (1981), Structure and Change in Economic History. New York: W.W. Norton. (1990)
Institutions, Institutional Change, and Economic Performance. Cambridge: Cambridge University Press.
[60]. Nwakuya M., Ijomah M. (2017), Fixed effect ver-sus random effects modeling in a panel data analysis;
A consideration of economic and political indicators in six African countries. International Journal of
Statistics and Applications, 7(6), 275-279.
[61]. Ongo-Nkoa B. E., Song J. S. (2019), Urbanisation et Inégalités en Afrique : une étude à partir des
indices désagrégés. Revue d’Économie Régionale & Urbaine, 3, 447 à 484.
[62]. Penn World Data, http://pwt.econ.upenn.edu/.
[63]. Rama M. (2002). Globalization, inequality and labor market policies. Revue d’Economie du
Développement, 1-2, 43-84.
[64]. Rattso J., Stokk H. E. (2013), Trade, skill biased technical change and wage inequality in South Africa.
Review of International Economics, 21(3), 419-431.
[65]. Ravallion M. (2001), Growth inequality and poverty: looking beyond averages. World Development,
29(11), 1803-1815.
[66]. Reuveny R., Li Q. (2003), Economic openness, democracy, and income inequality: An empirical
analysis. Comparative Political Studies, 36(5),575-601.
[67]. Ricardo D. (1817), On the principles of political economy and taxation. 3rd edition 1821, Batoche
Books, Kitchner, Ontario, Ontario, 2001.
[68]. Savvides A. (1998), Trade policy and income inequality. Economics Letters, 61(3),365-372.
Does Trade Openness Increase Income Inequality in Africa? An Analysis....
*Corresponding Author: ZOGO EKASSI Richard1
www.aijbm.com 13 | Page
[69]. Shafiullah M. (2011), Foreign Aid and its Impact on Income Inequality. International Review of
Business Research Papers, 7, 91-105.
[70]. Shimeles A., Nabassaga T. (2018), Why Is Inequality High in Africa? Journal of African Economies,
27(1), 108-126.
[71]. Spilimbergo A., Londono J. L., Szekely M. (1999), Income distribution, factor endowments, and trade
openness. Journal of Development Economics, 59(1), 77-101.
[72]. Squalli J., Wilson K. (2011), A New Measure of Trade Openness. World Economy, 34, 1745-1770.
[73]. Stolper W. F., Samuelson P. A. (1941), Protective and real wages. The review of Economies Studies,
9(1), 58-73.
[74]. Wagle U. R. (2007). Are economic liberalization and equity compatible? Evidence from South Asia.
World Development, 35(11), 1836-1857.
[75]. Winters L. A. (2002), Trade Liberalisation and Poverty: What are the Links? The World Economy,
25(9), 1339-1367.
[76]. Wood A. (1997), Openness and Wage Inequality in Developing Countries: The Latin American
Challenge to East Asian Conventional Wisdom. The World Bank Economic Review, 11(1), 33-57.
[77]. Xu B. (2003), Trade liberalization, wage inequality, and endogenously determined nontraded goods.
Journal of International Economics, 60(2), 417-431.
[78]. Zhang X., Zhang K.H. (2003), How does globalization affect regional inequality within a developing
country? Evidence from China. Journal of Development Studies, 39, 47-67.

Contenu connexe

Tendances

M48111118.pdf
M48111118.pdfM48111118.pdf
M48111118.pdfaijbm
 
Small–medium enterprise formation and nigerian economic growth
Small–medium enterprise formation and nigerian economic growthSmall–medium enterprise formation and nigerian economic growth
Small–medium enterprise formation and nigerian economic growthYing wei (Joe) Chou
 
An Investigation of the Effect of Challenges Encounters Female Entrepreneuria...
An Investigation of the Effect of Challenges Encounters Female Entrepreneuria...An Investigation of the Effect of Challenges Encounters Female Entrepreneuria...
An Investigation of the Effect of Challenges Encounters Female Entrepreneuria...AkashSharma618775
 
The Twin Deficits Hypothesis: Evidence from Kenya
The Twin Deficits Hypothesis: Evidence from KenyaThe Twin Deficits Hypothesis: Evidence from Kenya
The Twin Deficits Hypothesis: Evidence from KenyaAkashSharma618775
 
Determinants of performance of small firms within four
Determinants of performance of small firms within fourDeterminants of performance of small firms within four
Determinants of performance of small firms within fourAlexander Decker
 
Challenges of Small Scale Entrepreneurs in Dodoma Tanzania
Challenges of Small Scale Entrepreneurs in Dodoma TanzaniaChallenges of Small Scale Entrepreneurs in Dodoma Tanzania
Challenges of Small Scale Entrepreneurs in Dodoma Tanzaniainventionjournals
 
Effect of market penetration management strategies on performance of Small En...
Effect of market penetration management strategies on performance of Small En...Effect of market penetration management strategies on performance of Small En...
Effect of market penetration management strategies on performance of Small En...AkashSharma618775
 
1 determinants of s and f -1-15
1 determinants of s and f -1-151 determinants of s and f -1-15
1 determinants of s and f -1-15Alexander Decker
 
11.measuring impact of demographic and environmental factors on small busines...
11.measuring impact of demographic and environmental factors on small busines...11.measuring impact of demographic and environmental factors on small busines...
11.measuring impact of demographic and environmental factors on small busines...Alexander Decker
 
measuring impact of demographic and environmental factors on small business p...
measuring impact of demographic and environmental factors on small business p...measuring impact of demographic and environmental factors on small business p...
measuring impact of demographic and environmental factors on small business p...Alexander Decker
 
Passion driven entrepreneurship in small and medium-sized towns - empirical e...
Passion driven entrepreneurship in small and medium-sized towns - empirical e...Passion driven entrepreneurship in small and medium-sized towns - empirical e...
Passion driven entrepreneurship in small and medium-sized towns - empirical e...Ying wei (Joe) Chou
 
N47123133.pdf
N47123133.pdfN47123133.pdf
N47123133.pdfaijbm
 
External Business Environment and Performance of Microfinance Institutions: E...
External Business Environment and Performance of Microfinance Institutions: E...External Business Environment and Performance of Microfinance Institutions: E...
External Business Environment and Performance of Microfinance Institutions: E...AkashSharma618775
 
TheCompetitiveness And Economic Performance OfRegency/City In East Java Indon...
TheCompetitiveness And Economic Performance OfRegency/City In East Java Indon...TheCompetitiveness And Economic Performance OfRegency/City In East Java Indon...
TheCompetitiveness And Economic Performance OfRegency/City In East Java Indon...iosrjce
 
The Importance of Entrepreneurship and Information Technology for SMEs Strate...
The Importance of Entrepreneurship and Information Technology for SMEs Strate...The Importance of Entrepreneurship and Information Technology for SMEs Strate...
The Importance of Entrepreneurship and Information Technology for SMEs Strate...ijtsrd
 

Tendances (19)

M48111118.pdf
M48111118.pdfM48111118.pdf
M48111118.pdf
 
Small–medium enterprise formation and nigerian economic growth
Small–medium enterprise formation and nigerian economic growthSmall–medium enterprise formation and nigerian economic growth
Small–medium enterprise formation and nigerian economic growth
 
An Investigation of the Effect of Challenges Encounters Female Entrepreneuria...
An Investigation of the Effect of Challenges Encounters Female Entrepreneuria...An Investigation of the Effect of Challenges Encounters Female Entrepreneuria...
An Investigation of the Effect of Challenges Encounters Female Entrepreneuria...
 
The Twin Deficits Hypothesis: Evidence from Kenya
The Twin Deficits Hypothesis: Evidence from KenyaThe Twin Deficits Hypothesis: Evidence from Kenya
The Twin Deficits Hypothesis: Evidence from Kenya
 
Determinants of performance of small firms within four
Determinants of performance of small firms within fourDeterminants of performance of small firms within four
Determinants of performance of small firms within four
 
Challenges of Small Scale Entrepreneurs in Dodoma Tanzania
Challenges of Small Scale Entrepreneurs in Dodoma TanzaniaChallenges of Small Scale Entrepreneurs in Dodoma Tanzania
Challenges of Small Scale Entrepreneurs in Dodoma Tanzania
 
Investigation Of Academic Thesis And Articles Produced In The Field Of Financ...
Investigation Of Academic Thesis And Articles Produced In The Field Of Financ...Investigation Of Academic Thesis And Articles Produced In The Field Of Financ...
Investigation Of Academic Thesis And Articles Produced In The Field Of Financ...
 
Effect of market penetration management strategies on performance of Small En...
Effect of market penetration management strategies on performance of Small En...Effect of market penetration management strategies on performance of Small En...
Effect of market penetration management strategies on performance of Small En...
 
1 determinants of s and f -1-15
1 determinants of s and f -1-151 determinants of s and f -1-15
1 determinants of s and f -1-15
 
11.measuring impact of demographic and environmental factors on small busines...
11.measuring impact of demographic and environmental factors on small busines...11.measuring impact of demographic and environmental factors on small busines...
11.measuring impact of demographic and environmental factors on small busines...
 
measuring impact of demographic and environmental factors on small business p...
measuring impact of demographic and environmental factors on small business p...measuring impact of demographic and environmental factors on small business p...
measuring impact of demographic and environmental factors on small business p...
 
Passion driven entrepreneurship in small and medium-sized towns - empirical e...
Passion driven entrepreneurship in small and medium-sized towns - empirical e...Passion driven entrepreneurship in small and medium-sized towns - empirical e...
Passion driven entrepreneurship in small and medium-sized towns - empirical e...
 
N47123133.pdf
N47123133.pdfN47123133.pdf
N47123133.pdf
 
5
55
5
 
External Business Environment and Performance of Microfinance Institutions: E...
External Business Environment and Performance of Microfinance Institutions: E...External Business Environment and Performance of Microfinance Institutions: E...
External Business Environment and Performance of Microfinance Institutions: E...
 
TheCompetitiveness And Economic Performance OfRegency/City In East Java Indon...
TheCompetitiveness And Economic Performance OfRegency/City In East Java Indon...TheCompetitiveness And Economic Performance OfRegency/City In East Java Indon...
TheCompetitiveness And Economic Performance OfRegency/City In East Java Indon...
 
Nguyen van duy nghiencuudinhluong.com
Nguyen van duy nghiencuudinhluong.comNguyen van duy nghiencuudinhluong.com
Nguyen van duy nghiencuudinhluong.com
 
My future entrepreneurial self
My future entrepreneurial selfMy future entrepreneurial self
My future entrepreneurial self
 
The Importance of Entrepreneurship and Information Technology for SMEs Strate...
The Importance of Entrepreneurship and Information Technology for SMEs Strate...The Importance of Entrepreneurship and Information Technology for SMEs Strate...
The Importance of Entrepreneurship and Information Technology for SMEs Strate...
 

Similaire à A470113.pdf

Impact Of Trade On Inequalities
Impact Of Trade On InequalitiesImpact Of Trade On Inequalities
Impact Of Trade On InequalitiesLing-en HSIA
 
Determinants of bilateral trade between ethiopia and its major trading partne...
Determinants of bilateral trade between ethiopia and its major trading partne...Determinants of bilateral trade between ethiopia and its major trading partne...
Determinants of bilateral trade between ethiopia and its major trading partne...Alexander Decker
 
External Trade Benefits and Poverty Reduction in English Speaking West Africa...
External Trade Benefits and Poverty Reduction in English Speaking West Africa...External Trade Benefits and Poverty Reduction in English Speaking West Africa...
External Trade Benefits and Poverty Reduction in English Speaking West Africa...iosrjce
 
E352127
E352127E352127
E352127aijbm
 
International Trade.ppt
International Trade.pptInternational Trade.ppt
International Trade.pptMSameerAsadi1
 
© Koninklijke Brill NV, Leiden, 2012 DOI 10.1163156914912X62.docx
© Koninklijke Brill NV, Leiden, 2012 DOI 10.1163156914912X62.docx© Koninklijke Brill NV, Leiden, 2012 DOI 10.1163156914912X62.docx
© Koninklijke Brill NV, Leiden, 2012 DOI 10.1163156914912X62.docxsusanschei
 
An empirical investigation between trade liberalization and
An empirical investigation between trade liberalization andAn empirical investigation between trade liberalization and
An empirical investigation between trade liberalization andAlexander Decker
 
A century of economic growth in latin america
A century of economic growth in latin americaA century of economic growth in latin america
A century of economic growth in latin americaVinalle Francois
 
Study: Transatlantic Trade and Investment Partnership (TTIP) Who benefits fro...
Study: Transatlantic Trade and Investment Partnership (TTIP) Who benefits fro...Study: Transatlantic Trade and Investment Partnership (TTIP) Who benefits fro...
Study: Transatlantic Trade and Investment Partnership (TTIP) Who benefits fro...GED Project - Global Economic Dynamics
 
Effect of international trade on economic growth in kenya
Effect of international trade on economic growth in kenyaEffect of international trade on economic growth in kenya
Effect of international trade on economic growth in kenyaAlexander Decker
 
73Globalization Is Good for YouRonald BaileyTrade—.docx
73Globalization Is Good for YouRonald BaileyTrade—.docx73Globalization Is Good for YouRonald BaileyTrade—.docx
73Globalization Is Good for YouRonald BaileyTrade—.docxalinainglis
 

Similaire à A470113.pdf (20)

Impact Of Trade On Inequalities
Impact Of Trade On InequalitiesImpact Of Trade On Inequalities
Impact Of Trade On Inequalities
 
Determinants of bilateral trade between ethiopia and its major trading partne...
Determinants of bilateral trade between ethiopia and its major trading partne...Determinants of bilateral trade between ethiopia and its major trading partne...
Determinants of bilateral trade between ethiopia and its major trading partne...
 
External Trade Benefits and Poverty Reduction in English Speaking West Africa...
External Trade Benefits and Poverty Reduction in English Speaking West Africa...External Trade Benefits and Poverty Reduction in English Speaking West Africa...
External Trade Benefits and Poverty Reduction in English Speaking West Africa...
 
Globalization, Trade, and Interdependence
Globalization, Trade, and InterdependenceGlobalization, Trade, and Interdependence
Globalization, Trade, and Interdependence
 
E352127
E352127E352127
E352127
 
International Trade.ppt
International Trade.pptInternational Trade.ppt
International Trade.ppt
 
© Koninklijke Brill NV, Leiden, 2012 DOI 10.1163156914912X62.docx
© Koninklijke Brill NV, Leiden, 2012 DOI 10.1163156914912X62.docx© Koninklijke Brill NV, Leiden, 2012 DOI 10.1163156914912X62.docx
© Koninklijke Brill NV, Leiden, 2012 DOI 10.1163156914912X62.docx
 
Transfer Pricing of Multinational Corporations and Macroeconomic Volatility: ...
Transfer Pricing of Multinational Corporations and Macroeconomic Volatility: ...Transfer Pricing of Multinational Corporations and Macroeconomic Volatility: ...
Transfer Pricing of Multinational Corporations and Macroeconomic Volatility: ...
 
Export Trade and Economic Growth in Malawi: A Disaggregated Approach
Export Trade and Economic Growth in Malawi: A Disaggregated ApproachExport Trade and Economic Growth in Malawi: A Disaggregated Approach
Export Trade and Economic Growth in Malawi: A Disaggregated Approach
 
Export Trade and Economic Growth in Malawi: A Disaggregated Approach
Export Trade and Economic Growth in Malawi: A Disaggregated ApproachExport Trade and Economic Growth in Malawi: A Disaggregated Approach
Export Trade and Economic Growth in Malawi: A Disaggregated Approach
 
An empirical investigation between trade liberalization and
An empirical investigation between trade liberalization andAn empirical investigation between trade liberalization and
An empirical investigation between trade liberalization and
 
A century of economic growth in latin america
A century of economic growth in latin americaA century of economic growth in latin america
A century of economic growth in latin america
 
Study: Transatlantic Trade and Investment Partnership (TTIP) Who benefits fro...
Study: Transatlantic Trade and Investment Partnership (TTIP) Who benefits fro...Study: Transatlantic Trade and Investment Partnership (TTIP) Who benefits fro...
Study: Transatlantic Trade and Investment Partnership (TTIP) Who benefits fro...
 
wp13135
wp13135wp13135
wp13135
 
Gender and Trade
Gender and TradeGender and Trade
Gender and Trade
 
Effect of international trade on economic growth in kenya
Effect of international trade on economic growth in kenyaEffect of international trade on economic growth in kenya
Effect of international trade on economic growth in kenya
 
Economic growth 2
Economic growth 2Economic growth 2
Economic growth 2
 
73Globalization Is Good for YouRonald BaileyTrade—.docx
73Globalization Is Good for YouRonald BaileyTrade—.docx73Globalization Is Good for YouRonald BaileyTrade—.docx
73Globalization Is Good for YouRonald BaileyTrade—.docx
 
Mwito et al. (2015)
Mwito et al. (2015)Mwito et al. (2015)
Mwito et al. (2015)
 
Threshold Effects of Financial Markets on Economic Growth in Africa: An Appli...
Threshold Effects of Financial Markets on Economic Growth in Africa: An Appli...Threshold Effects of Financial Markets on Economic Growth in Africa: An Appli...
Threshold Effects of Financial Markets on Economic Growth in Africa: An Appli...
 

Plus de aijbm

E582740.pdf
E582740.pdfE582740.pdf
E582740.pdfaijbm
 
A580108.pdf
A580108.pdfA580108.pdf
A580108.pdfaijbm
 
F584145.pdf
F584145.pdfF584145.pdf
F584145.pdfaijbm
 
B580914.pdf
B580914.pdfB580914.pdf
B580914.pdfaijbm
 
H585357.pdf
H585357.pdfH585357.pdf
H585357.pdfaijbm
 
G584652.pdf
G584652.pdfG584652.pdf
G584652.pdfaijbm
 
D582026.pdf
D582026.pdfD582026.pdf
D582026.pdfaijbm
 
C581519.pdf
C581519.pdfC581519.pdf
C581519.pdfaijbm
 
P57130135.pdf
P57130135.pdfP57130135.pdf
P57130135.pdfaijbm
 
M5799113.pdf
M5799113.pdfM5799113.pdf
M5799113.pdfaijbm
 
O57120129.pdf
O57120129.pdfO57120129.pdf
O57120129.pdfaijbm
 
R57139145.pdf
R57139145.pdfR57139145.pdf
R57139145.pdfaijbm
 
J577177.pdf
J577177.pdfJ577177.pdf
J577177.pdfaijbm
 
Q57136138.pdf
Q57136138.pdfQ57136138.pdf
Q57136138.pdfaijbm
 
C572126.pdf
C572126.pdfC572126.pdf
C572126.pdfaijbm
 
F574050.pdf
F574050.pdfF574050.pdf
F574050.pdfaijbm
 
E573539.pdf
E573539.pdfE573539.pdf
E573539.pdfaijbm
 
I576670.pdf
I576670.pdfI576670.pdf
I576670.pdfaijbm
 
S57146154.pdf
S57146154.pdfS57146154.pdf
S57146154.pdfaijbm
 
K577886.pdf
K577886.pdfK577886.pdf
K577886.pdfaijbm
 

Plus de aijbm (20)

E582740.pdf
E582740.pdfE582740.pdf
E582740.pdf
 
A580108.pdf
A580108.pdfA580108.pdf
A580108.pdf
 
F584145.pdf
F584145.pdfF584145.pdf
F584145.pdf
 
B580914.pdf
B580914.pdfB580914.pdf
B580914.pdf
 
H585357.pdf
H585357.pdfH585357.pdf
H585357.pdf
 
G584652.pdf
G584652.pdfG584652.pdf
G584652.pdf
 
D582026.pdf
D582026.pdfD582026.pdf
D582026.pdf
 
C581519.pdf
C581519.pdfC581519.pdf
C581519.pdf
 
P57130135.pdf
P57130135.pdfP57130135.pdf
P57130135.pdf
 
M5799113.pdf
M5799113.pdfM5799113.pdf
M5799113.pdf
 
O57120129.pdf
O57120129.pdfO57120129.pdf
O57120129.pdf
 
R57139145.pdf
R57139145.pdfR57139145.pdf
R57139145.pdf
 
J577177.pdf
J577177.pdfJ577177.pdf
J577177.pdf
 
Q57136138.pdf
Q57136138.pdfQ57136138.pdf
Q57136138.pdf
 
C572126.pdf
C572126.pdfC572126.pdf
C572126.pdf
 
F574050.pdf
F574050.pdfF574050.pdf
F574050.pdf
 
E573539.pdf
E573539.pdfE573539.pdf
E573539.pdf
 
I576670.pdf
I576670.pdfI576670.pdf
I576670.pdf
 
S57146154.pdf
S57146154.pdfS57146154.pdf
S57146154.pdf
 
K577886.pdf
K577886.pdfK577886.pdf
K577886.pdf
 

Dernier

The+State+of+Careers+In+Retention+Marketing-2.pdf
The+State+of+Careers+In+Retention+Marketing-2.pdfThe+State+of+Careers+In+Retention+Marketing-2.pdf
The+State+of+Careers+In+Retention+Marketing-2.pdfSocial Samosa
 
Social media, ppt. Features, characteristics
Social media, ppt. Features, characteristicsSocial media, ppt. Features, characteristics
Social media, ppt. Features, characteristicswasim792942
 
Unraveling the Mystery of The Circleville Letters.pptx
Unraveling the Mystery of The Circleville Letters.pptxUnraveling the Mystery of The Circleville Letters.pptx
Unraveling the Mystery of The Circleville Letters.pptxelizabethella096
 
Google 3rd-Party Cookie Deprecation [Update] + 5 Best Strategies
Google 3rd-Party Cookie Deprecation [Update] + 5 Best StrategiesGoogle 3rd-Party Cookie Deprecation [Update] + 5 Best Strategies
Google 3rd-Party Cookie Deprecation [Update] + 5 Best StrategiesSearch Engine Journal
 
Aryabhata I, II of mathematics of both.pptx
Aryabhata I, II of mathematics of both.pptxAryabhata I, II of mathematics of both.pptx
Aryabhata I, II of mathematics of both.pptxtegevi9289
 
BDSM⚡Call Girls in Sector 144 Noida Escorts >༒8448380779 Escort Service
BDSM⚡Call Girls in Sector 144 Noida Escorts >༒8448380779 Escort ServiceBDSM⚡Call Girls in Sector 144 Noida Escorts >༒8448380779 Escort Service
BDSM⚡Call Girls in Sector 144 Noida Escorts >༒8448380779 Escort ServiceDelhi Call girls
 
VIP 7001035870 Find & Meet Hyderabad Call Girls Film Nagar high-profile Call ...
VIP 7001035870 Find & Meet Hyderabad Call Girls Film Nagar high-profile Call ...VIP 7001035870 Find & Meet Hyderabad Call Girls Film Nagar high-profile Call ...
VIP 7001035870 Find & Meet Hyderabad Call Girls Film Nagar high-profile Call ...aditipandeya
 
CALL ON ➥8923113531 🔝Call Girls Hazratganj Lucknow best sexual service Online
CALL ON ➥8923113531 🔝Call Girls Hazratganj Lucknow best sexual service OnlineCALL ON ➥8923113531 🔝Call Girls Hazratganj Lucknow best sexual service Online
CALL ON ➥8923113531 🔝Call Girls Hazratganj Lucknow best sexual service Onlineanilsa9823
 
BDSM⚡Call Girls in Sector 39 Noida Escorts Escorts >༒8448380779 Escort Service
BDSM⚡Call Girls in Sector 39 Noida Escorts Escorts >༒8448380779 Escort ServiceBDSM⚡Call Girls in Sector 39 Noida Escorts Escorts >༒8448380779 Escort Service
BDSM⚡Call Girls in Sector 39 Noida Escorts Escorts >༒8448380779 Escort ServiceDelhi Call girls
 
Social Media Marketing PPT-Includes Paid media
Social Media Marketing PPT-Includes Paid mediaSocial Media Marketing PPT-Includes Paid media
Social Media Marketing PPT-Includes Paid mediaadityabelde2
 
What is Google Search Console and What is it provide?
What is Google Search Console and What is it provide?What is Google Search Console and What is it provide?
What is Google Search Console and What is it provide?riteshhsociall
 
Enjoy Night⚡Call Girls Dlf City Phase 4 Gurgaon >༒8448380779 Escort Service
Enjoy Night⚡Call Girls Dlf City Phase 4 Gurgaon >༒8448380779 Escort ServiceEnjoy Night⚡Call Girls Dlf City Phase 4 Gurgaon >༒8448380779 Escort Service
Enjoy Night⚡Call Girls Dlf City Phase 4 Gurgaon >༒8448380779 Escort ServiceDelhi Call girls
 
Five Essential Tools for International SEO - Natalia Witczyk - SearchNorwich 15
Five Essential Tools for International SEO - Natalia Witczyk - SearchNorwich 15Five Essential Tools for International SEO - Natalia Witczyk - SearchNorwich 15
Five Essential Tools for International SEO - Natalia Witczyk - SearchNorwich 15SearchNorwich
 
Factors-Influencing-Branding-Strategies.pptx
Factors-Influencing-Branding-Strategies.pptxFactors-Influencing-Branding-Strategies.pptx
Factors-Influencing-Branding-Strategies.pptxVikasTiwari846641
 
Digital-Marketing-Into-by-Zoraiz-Ahmad.pptx
Digital-Marketing-Into-by-Zoraiz-Ahmad.pptxDigital-Marketing-Into-by-Zoraiz-Ahmad.pptx
Digital-Marketing-Into-by-Zoraiz-Ahmad.pptxZACGaming
 
BLOOM_April2024. Balmer Lawrie Online Monthly Bulletin
BLOOM_April2024. Balmer Lawrie Online Monthly BulletinBLOOM_April2024. Balmer Lawrie Online Monthly Bulletin
BLOOM_April2024. Balmer Lawrie Online Monthly BulletinBalmerLawrie
 

Dernier (20)

The+State+of+Careers+In+Retention+Marketing-2.pdf
The+State+of+Careers+In+Retention+Marketing-2.pdfThe+State+of+Careers+In+Retention+Marketing-2.pdf
The+State+of+Careers+In+Retention+Marketing-2.pdf
 
BUY GMAIL ACCOUNTS PVA USA IP INDIAN IP GMAIL
BUY GMAIL ACCOUNTS PVA USA IP INDIAN IP GMAILBUY GMAIL ACCOUNTS PVA USA IP INDIAN IP GMAIL
BUY GMAIL ACCOUNTS PVA USA IP INDIAN IP GMAIL
 
Social media, ppt. Features, characteristics
Social media, ppt. Features, characteristicsSocial media, ppt. Features, characteristics
Social media, ppt. Features, characteristics
 
Brand Strategy Master Class - Juntae DeLane
Brand Strategy Master Class - Juntae DeLaneBrand Strategy Master Class - Juntae DeLane
Brand Strategy Master Class - Juntae DeLane
 
Unraveling the Mystery of The Circleville Letters.pptx
Unraveling the Mystery of The Circleville Letters.pptxUnraveling the Mystery of The Circleville Letters.pptx
Unraveling the Mystery of The Circleville Letters.pptx
 
Google 3rd-Party Cookie Deprecation [Update] + 5 Best Strategies
Google 3rd-Party Cookie Deprecation [Update] + 5 Best StrategiesGoogle 3rd-Party Cookie Deprecation [Update] + 5 Best Strategies
Google 3rd-Party Cookie Deprecation [Update] + 5 Best Strategies
 
Aryabhata I, II of mathematics of both.pptx
Aryabhata I, II of mathematics of both.pptxAryabhata I, II of mathematics of both.pptx
Aryabhata I, II of mathematics of both.pptx
 
BDSM⚡Call Girls in Sector 144 Noida Escorts >༒8448380779 Escort Service
BDSM⚡Call Girls in Sector 144 Noida Escorts >༒8448380779 Escort ServiceBDSM⚡Call Girls in Sector 144 Noida Escorts >༒8448380779 Escort Service
BDSM⚡Call Girls in Sector 144 Noida Escorts >༒8448380779 Escort Service
 
Creator Influencer Strategy Master Class - Corinne Rose Guirgis
Creator Influencer Strategy Master Class - Corinne Rose GuirgisCreator Influencer Strategy Master Class - Corinne Rose Guirgis
Creator Influencer Strategy Master Class - Corinne Rose Guirgis
 
VIP 7001035870 Find & Meet Hyderabad Call Girls Film Nagar high-profile Call ...
VIP 7001035870 Find & Meet Hyderabad Call Girls Film Nagar high-profile Call ...VIP 7001035870 Find & Meet Hyderabad Call Girls Film Nagar high-profile Call ...
VIP 7001035870 Find & Meet Hyderabad Call Girls Film Nagar high-profile Call ...
 
CALL ON ➥8923113531 🔝Call Girls Hazratganj Lucknow best sexual service Online
CALL ON ➥8923113531 🔝Call Girls Hazratganj Lucknow best sexual service OnlineCALL ON ➥8923113531 🔝Call Girls Hazratganj Lucknow best sexual service Online
CALL ON ➥8923113531 🔝Call Girls Hazratganj Lucknow best sexual service Online
 
BDSM⚡Call Girls in Sector 39 Noida Escorts Escorts >༒8448380779 Escort Service
BDSM⚡Call Girls in Sector 39 Noida Escorts Escorts >༒8448380779 Escort ServiceBDSM⚡Call Girls in Sector 39 Noida Escorts Escorts >༒8448380779 Escort Service
BDSM⚡Call Girls in Sector 39 Noida Escorts Escorts >༒8448380779 Escort Service
 
Social Media Marketing PPT-Includes Paid media
Social Media Marketing PPT-Includes Paid mediaSocial Media Marketing PPT-Includes Paid media
Social Media Marketing PPT-Includes Paid media
 
What is Google Search Console and What is it provide?
What is Google Search Console and What is it provide?What is Google Search Console and What is it provide?
What is Google Search Console and What is it provide?
 
Enjoy Night⚡Call Girls Dlf City Phase 4 Gurgaon >༒8448380779 Escort Service
Enjoy Night⚡Call Girls Dlf City Phase 4 Gurgaon >༒8448380779 Escort ServiceEnjoy Night⚡Call Girls Dlf City Phase 4 Gurgaon >༒8448380779 Escort Service
Enjoy Night⚡Call Girls Dlf City Phase 4 Gurgaon >༒8448380779 Escort Service
 
Five Essential Tools for International SEO - Natalia Witczyk - SearchNorwich 15
Five Essential Tools for International SEO - Natalia Witczyk - SearchNorwich 15Five Essential Tools for International SEO - Natalia Witczyk - SearchNorwich 15
Five Essential Tools for International SEO - Natalia Witczyk - SearchNorwich 15
 
Factors-Influencing-Branding-Strategies.pptx
Factors-Influencing-Branding-Strategies.pptxFactors-Influencing-Branding-Strategies.pptx
Factors-Influencing-Branding-Strategies.pptx
 
Digital-Marketing-Into-by-Zoraiz-Ahmad.pptx
Digital-Marketing-Into-by-Zoraiz-Ahmad.pptxDigital-Marketing-Into-by-Zoraiz-Ahmad.pptx
Digital-Marketing-Into-by-Zoraiz-Ahmad.pptx
 
BLOOM_April2024. Balmer Lawrie Online Monthly Bulletin
BLOOM_April2024. Balmer Lawrie Online Monthly BulletinBLOOM_April2024. Balmer Lawrie Online Monthly Bulletin
BLOOM_April2024. Balmer Lawrie Online Monthly Bulletin
 
Digital Strategy Master Class - Andrew Rupert
Digital Strategy Master Class - Andrew RupertDigital Strategy Master Class - Andrew Rupert
Digital Strategy Master Class - Andrew Rupert
 

A470113.pdf

  • 1. American International Journal of Business Management (AIJBM) ISSN- 2379-106X, www.aijbm.com Volume 4, Issue 07 (July-2021), PP 01-13 *Corresponding Author: ZOGO EKASSI Richard1 www.aijbm.com 1 | Page Does Trade Openness Increase Income Inequality in Africa? An Analysis Using the Squalli and Wilson Indexes, 2011 ZOGO EKASSI Richard University of Yaounde II, Cameroon, Summary: In this paper, we assess the effect of trade openness on income inequality in Africa. Using a sample of 38 countries, we specify and estimate a panel data model using Double Least Squares (DLS) over the period 1980-2018. Using the indicators of Squalli and Wilson (2011), the results show that the relative shares of domestic country trade, domestic country trade to average world trade, world trade composition, exports and imports to GDP increase income inequality. We suggest the consolidation of structural reforms to improve the competitiveness of the industrial fabric and the diversification of the supply of goods and services. Keywords: Africa, DLS, Inequality, Trade openness. I. Introduction Globalization continues to reveal two major trends. On the one hand, the increasing openness of emerging markets, with a decrease in the degree of trade protection, and greater amplitude of capital flows. On the other hand, an increase in intra- and inter-country inequalities (Daymon, 2012). This situation induces uncertainty insofar as the relationship between trade openness and inequality in developing countries remains absurd. Although free trade helps alleviate poverty through improved private sector efficiency (Winters, 2002), in the short run, trade liberalization causes significant redistributional effects within the economy and there is no consensus on the accompanying macroeconomic policies to implement. One of the fundamental issues in trade is the distribution of income across factors. Until the 1990s, the ideal framework for understanding the link between trade and income inequality is the Stolper-Samuelson (SS) theorem in the Heckscher-Ohlin model (Lee and Wei, 2015). One implication is that trade liberalization should reduce income inequality in developing countries since trade can increase the real return to the relatively abundant factor. However, rising income inequality has been observed in developing countries (Harrison et al., 2010). The adoption of the 2030 Agenda for Sustainable Development and its 17 Sustainable Development Goals (SDGs) in September 2015 drew attention to income inequality in Sub-Saharan Africa (UNDP, 2017). Although Sub-Saharan Africa observed a 3.4 percentage point decline in the unweighted average value of its Gini coefficient between 1991 and 2011, it remains one of the regions with the highest levels of inequality globally. Indeed, it is home to 10 of the 19 most unequal countries in the world. It is also home to seven economies that are considered outliers in terms of their Gini coefficients and, as such, are responsible for the inequality observed in the region. Between 1991 and 2011, a clear duality in inequality trends emerged among countries in the region. Moreover, 17 African countries (mostly agricultural economies in West Africa and some in other subregions) experienced declining inequality, while 12 countries, mostly in Southern and Central Africa and characterized by a large oil and mining sector, experienced rising inequality. This observation has led to the urgent need for economists to rethink the drivers of income inequality beyond the simple prediction of the Stolper-Samuelson theorem. The first argument is to extend the Heckscher- Ohlin model for explanation (Xu (2003). The second argument is the skill bias and the technology channel (Rattso and Stokke, 2013). The third is the increase in trade in intermediate goods and vertical specialization (Grossman and Rossi-Hansberg, 2008). The dramatic trade liberalizations implemented by developing countries or their partners since the 1980s have provided an unprecedented opportunity to learn more about the effects of trade on growth, inequality, and poverty in developing countries (Goldberg and Pavcnik, 2007). Three possible arguments support the relationship between trade openness and income inequality. First, factor endowments (Spilimbergo et al., 1999; Gourdon et al., 2008). Second, trade-related investment and outsourcing (Feenstra and Hanson, 1999; Krugman, 2008). Third, technological changes that reflect real world market conditions to the analysis of the effect of trade on income inequality (Lim and McNelis, 2016). While growth and technology improve income inequality, trade openness has mixed effects on income inequality (Jaumotte et al., 2013; Dollar and Kraay, 2002). Theoretically, the impact of trade on inequality in developing countries could be different. Empirically, in the literature, the direction so far has been mixed. Wood (1997) concludes that trade openness is differently associated with wage inequality in Asian Tiger economies and Latin American countries. Green et al, (2001)
  • 2. Does Trade Openness Increase Income Inequality in Africa? An Analysis.... *Corresponding Author: ZOGO EKASSI Richard1 www.aijbm.com 2 | Page point out that trade liberalization has no significant effect on wage dispersion in Brazil. Meschi and Vivarelli (2009) show that trade liberalization has an impact on income distribution in developing countries. A key issue, often emphasized in the literature, is that trade is endogenous in determining income levels, and hence income inequality. At the same time, rising inequality within a country has been a major concern in both developed and developing countries (Asteriou et al., 2014). Several studies have investigated how economic freedom and globalization are associated with income inequality (Bergh and Nilsson, 2010). For example, Dreher and Gaston (2008) find that globalization increases household income inequality, particularly in Organization for Economic Cooperation and Development (OECD) countries. Similarly, recognizing the importance of international trade, the relationship between trade or trade openness and income inequality has been discussed in the literature. Savvides (1998) concludes that trade openness worsens income distribution in less developed countries, especially open economies, in the late 1980s. However, Reuveny and Li (2003) find that trade openness reduces income inequality. Most existing studies use the share of trade in the gross domestic product (GDP) as a measure of trade openness (Anderson, 2005). From the non-exhaustive review of the literature on the impact of trade openness on income inequality, two main points can be made. First, most of the work has focused on the influence of international trade. Yet, in the long tradition of international economics, trade openness and inequality are frequently presented as complementary and associated with the stability of international relations (Baldwin and Krugman, 1989). Second, the literature ignores the problem of the level of trade openness resulting from the fragmentation of trade flows. Moreover, the use of multiple indices of trade openness seems not to have been addressed in the literature. Our paper aims to provide some empirical evidence on these shortcomings. Following this theoretical framework and drawing on empirical methodologies widely documented in the literature, the objective of this paper, which constitutes its originality, is to examine the effects of five dimensions of trade openness on income inequality in Sub-Saharan Africa. To this end, we consider a sample of 38 African countries over the period 1980-2018 and apply Double Least Squares (DLS). The results show that the relative shares of domestic country trade, domestic country trade to average world trade, world trade composition, exports and imports to GDP increase income inequality. To this end, and more specifically, the study contributes to the literature on the subject in at least three ways. First, it incorporates, in addition to the traditional determinants, trade openness as a relevant indicator of income inequality. Second, it uses disaggregated indices of trade openness to better illustrate the relative relevance of each of the indices on income inequality in Sub-Saharan Africa. Finally, it shows its polysemic nature, which can be understood through the use of disaggregated indices, in order to make relevant recommendations. The rest of the article is divided into five additional sections. The second section outlines synthesis of the state of the art. The third presents the stylized facts. The fourth presents the empirical strategy. The fifth analyses the results. The sixth concludes and suggests some policy recommendations. II. Review of the literature The dynamics of trade openness favor the emergence of challenges and opportunities related to inequalities (Ravallion, 2001). It is accompanied by processes of human, physical, financial and commercial integration that transform the well-being of populations (Dollar and Kraay, 2002). Policies must respond to these inequalities to promote trade in sustainable goods and services to foster inclusive growth and accelerate structural transformation. Following Adam Smith (1776), who based explanations of inequalities in international trade on absolute advantages, the literature on trade openness has been characterized by three main theories. First, the traditional theories that include Ricardo's theory of comparative advantage (1817) and the Heckscher-Ohlin-Samuelson (HOS) model. Then, the modern theories that incorporate the new theory of international trade developed by Krugman (1979) and the institutional theory with North (1981). Finally, the financial theories highlight two effects. A direct effect based on the postulate that a country with a developed financial system favors trade openness through the channeling of financial flows, diversification and risk management, as well as the densification of trade in goods and services (Levine, 2005). An indirect effect that explains trade openness by a country's ability to have a sufficiently developed financial system and greater access to finance that can stimulate economic activities (Enrique et al., 2014). Previous work on the trade and inequality relationship is based on the Heckscher-Ohlin (HO) model, which predicts that countries benefit from trade using their many factors (Chang and Wu, 2016). The Stolper- Samuelson theorem explains the main link between trade openness and income inequality. According to this theorem, capital-rich developed countries tend to export capital-intensive goods, while labor-rich developing countries tend to export labor-intensive goods. Once they open their markets, the relative prices of capital- intensive goods rise in developed countries, increasing the incomes of those with capital and reducing the
  • 3. Does Trade Openness Increase Income Inequality in Africa? An Analysis.... *Corresponding Author: ZOGO EKASSI Richard1 www.aijbm.com 3 | Page incomes of labor. The opposite effects occur in developing countries, increasing the relative incomes of those who benefit from lower capital. The growing interconnection of economies has led to the need to explore the impact of trade openness on inequality, the roots of which go back to the seminal work of Kletzer and Bardhan (1987), which showed that imperfections in goods and services markets resulting from trade openness affect income inequality. These aspects left no doubt about the relevance of such a relationship, showing that income inequality depends on trade openness. Yet trade openness plays a major role in the evolution of inequality within countries through its effect on the prices of goods and factors. According to international trade theories, the degree of a country's exposure to foreign trade alters household incomes through changes in relative prices, reallocations of resources, and the introduction of new production techniques-all of which affect the organization of production, job creation, and labor incomes (Anderson, 2005). According to the traditional Heckscher-Ohlin model associated with the Stolper-Samuelson theorem (HOS), trade openness contributes to greater specialization of countries, an increase in their national income, and a change in the primary distribution of income according to factor endowments. The literature identifies three types of factors that determine inequality. First, economic determinants such as population density (Heerink et al., 2001), income (Midlarsky and Roberts, 1985), natural resources (Anyanwu et al., 2016), trade globalization (Laigle, 2005), financial globalization (Jaumotte et al., 2013), government spending (Lee et al., 2013), inequality (Ongo-Nkoa and Song, 2019), and investments (Fosu, 2018). Second, social determinants such as education (Buffi and Atolia, 2012), household size (Mahmood and Noor, 2014), unemployment (Shafiullah, 2011), and aid (Monnin, 2014). Third, institutional determinants such as democracy (Brunori et al., 2015), governance (Campante and Do, 2007), colonial background (Bigstein, 2018), and ethnolinguistic fragmentation (Shimeles et Nabassaga, 2018). However, Bergh and Nilsson (2010) and Fluckiger et al (2002), using time series analysis, find that increased trade openness generates income inequality in Switzerland. Similarly, Zhang and Zhang (2003) find that trade globalization has increased inequality in China through the promotion of large regional income differences. Aradhyula et al (2007) and Chakrabarti (2000) have investigated the effect of trade openness on income and distributional levels. Using panel data from sixty paid surveys over the period 1985-1994, they find that trade openness increases income inequality. Other studies have distinguished between the impact of trade openness on developed and developing countries, finding that greater openness increases inequality, at least in poor countries (Barro 2000; Ravallion 2001; Easterly, 2007; Bensidoun et al., 2011). For example, Borras (2007) and Galiani and Sanguinatti (2003) pointed out that although trade openness led to increased production in the agricultural sector, with local farmers competing with imports from neighboring countries, trade openness not only failed to improve living standards in the Philippines but increased poverty and income inequality. Furthermore, Dutt and Mukhopadhyay (2005) analyzed the correlation between globalization and income inequality in developing countries between 1977 and 1998, concluding that trade openness and capital flows have led to an increase in income inequality. Recently, Anderson (2020) using computable general equilibrium models, finds that trade liberalization tends to reduce poverty, but is more likely to increase income inequality in developing countries. Similarly, Hirte et al, (2020) applying a gravity-type instrument that uses natural disasters hitting trading partners, as well as a Bartik-type instrument, conclude that trade openness increases economic disparities in countries that have higher domestic heterogeneity in terms of global market access and their intra-country trade costs. However, other studies have confirmed a negative relationship between trade openness and income inequality (Calderon and Chong, 2001), suggesting that greater trade openness is associated with lower income inequality. Dollar and Kraay (2004) find that greater openness to improving the rule of law favorably affects income distribution. This occurs if countries reduce regulatory barriers to competition, trade openness and foreign direct investment. Reuveny and Li (2003) find that trade globalization significantly reduces levels of income inequality in both developed and developing countries. Meyer (2003) finds that trade openness is accompanied by a reduction in income inequality, gender inequality and sex segregation. Wagle (2007), Rama (2002) concluded that trade openness reduces income inequality in developing countries. Causa, de Serres and Ruiz (2015) pointed out that some trade reforms have contributed to narrowing inequality. Lin and Fu (2016) using the Stolper-Samuelson theorem in the Heckscher-Ohlin model in a sample of developed and developing countries over the period 1985-2012 found that trade openness reduces income inequality. Arabiyat et al, (2019), Hartmann et al, (2017) show that countries exporting complex products have lower income inequality than those exporting simple products. Similarly, Goh and Law (2019) using the system generalized method of moments in a sample of 65 developed and developing countries over the period 1984-2012, find that trade openness contributes to lower income inequality. Mahesh (2016) using the method of generalized moments in the system over the period 1991-2013, finds that increasing trade openness contributes to the deterioration of income inequality in BRICS countries. However, Kentor (2001) finds no effect of trade globalization levels on income inequality trends in a panel of 88 developing countries over the period 1980-1997. Meschi and Vivarelli (2009) suggest an
  • 4. Does Trade Openness Increase Income Inequality in Africa? An Analysis.... *Corresponding Author: ZOGO EKASSI Richard1 www.aijbm.com 4 | Page insignificant relationship between trade openness and income inequality in developing countries, but they find that trade with developed countries intensifies income inequality in developing countries. III. Some stylized facts Three stylized facts can be noted to characterize trade openness and income inequality in Sub-Saharan Africa. Trade openness remains low in Sub-Saharan Africa According to Penn World Trade (2018), Sub-Saharan Africa remains on the margins of global trade, accounting for less than 1.7 percent, compared to 40 percent for the European Union, 28 percent for East Asia, 14.5 percent for North America, 5 percent for Latin America, and 2 percent for Africa. Although Sub-Saharan Africa's share of world trade is still marginal, some countries stand out such as Nigeria (0.054), Rwanda (0.043), Kenya (0.040) and Botswana (0.039) due to the implementation of structural transformation strategies and industrialization efforts. However, the composition of world trade is improving because exports are mainly primary at 94 percent. Plausible explanations for this are the staking of value chains and efforts to diversify production structures. Sub-Saharan Africa's participation in value chains is characterized by producing countries supplying, mainly to developed countries, raw materials and semi-processed intermediate products with low added value. As shown in Figure 1, intraregional trade in the regional economic communities was highest and estimated at $34.7 billion in the Southern African Development Community (SADC), $18.7 billion in the Community of Sahel-Saharan States (CEN-SAD), $11.4 billion in the Economic Community of West African States (ECOWAS), and $10.7 billion in the African Union (AU), 10.7 billion for the Common Market for Eastern and Southern Africa (COMESA), $4.2 billion for the Arab Maghreb Union (AMU), $3.1 billion for the East African Community (EAC), and $0.8 billion for the Economic Community of Central African States (ECCAS). Graph 1 : Evolution of intra-regional trade in Sub-Saharan Africa (in billions of dollars between 1980-2018) Source: Author, from World Bank Database (2019). Income Inequality Rising in Sub-Saharan Africa Figure 1 shows that seven of the ten most unequal countries in the world are in Sub-Saharan Africa. Significant disparities remain between urban and rural areas, across regions and between countries. These inequalities stem from the highly dualistic structure of the economy, multinational corporations and the extractive sector, which offer a limited capacity to generate employment compared to the informal sector, and lack of respect for environmental standards. In addition, the high concentration of physical capital, human capital and land, and the limited distributive role of the state, manifested through the natural resource cause, amplify the divergence in inequality in Sub-Saharan Africa. 0 5 10 15 20 25 30 35 40 SADC CEN-SAD ECOWAS COMESA CAE
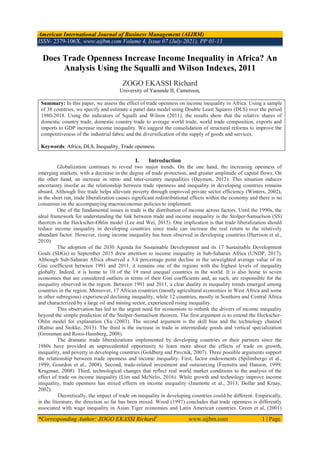
  • 5. Does Trade Openness Increase Income Inequality in Africa? An Analysis.... *Corresponding Author: ZOGO EKASSI Richard1 www.aijbm.com 5 | Page Figure 2 : Average trends in income inequalities in Sub-Saharan Africa (1980-2018) Source: Author, World Bank Database (2019). Trade openness is positively correlated with income inequality Trade openness is positively correlated with income inequality, as shown in Figure 3, provided that countries ease the constraints on integration faced by economic operators and firms. These aspects, in addition to constituting an issue for inequalities, favor the emergence of projects that are accompanied by a capacity for insertion, innovation and hiring. Also, the capacity for trade increases income in those parts of the world where diversification is advocated and reduces it in those localities where the concentration of export products is accentuated. Figure 1 : Correlations between trade openness and inequalities in Sub-Saharan Africa Source: Author, World Bank Database (2019). IV. Methodological strategy The methodological strategy is presented in three steps: the empirical model, the estimation technique and the data. 4.1. The empirical model The model is inspired by the work of Mahesh (2016) and Hartmann et al, (2017) which highlight the impact of exports and trade openness on income inequality in Africa. The compact version of the model is described by equation 1. _ _ (1) it it it i t it Income inequality Trade openness X             Where Income_inequalityit represents the inequality index of country i at date t. They describe the income gap between the affluent who can afford better living conditions and those living below the income 0 10 20 30 40 50 60 70 Burundi Burundi Burundi Burundi Burundi Burundi Burundi Burundi Burundi Burundi Burundi Burundi Burundi Burundi Burundi Burundi Burundi Burundi Burundi Burundi Burundi Burundi Burundi Burundi Burundi Burundi Burundi Burundi Burundi Burundi Burundi Burundi Burundi Burundi Burundi Burundi Burundi Burundi Cameroon Cameroon Cameroon Cameroon Cameroon Cameroon Cameroon Cameroon Cameroon Cameroon Cameroon Cameroon Cameroon Cameroon Cameroon Cameroon Cameroon Cameroon Cameroon Cameroon Cameroon Cameroon Cameroon Cameroon Cameroon Cameroon Cameroon Cameroon Cameroon Cameroon Cameroon Cameroon Cameroon Cameroon Cameroon Cameroon Cameroon Cameroon Cabo Verde Cabo Verde Cabo Verde Cabo Verde Cabo Verde Cabo Verde Cabo Verde Cabo Verde Cabo Verde Cabo Verde Cabo Verde Cabo Verde Cabo Verde Cabo Verde Cabo Verde Cabo Verde Cabo Verde Cabo Verde Cabo Verde Cabo Verde Cabo Verde Cabo Verde Cabo Verde Cabo Verde Cabo Verde Cabo Verde Cabo Verde Cabo Verde Cabo Verde Cabo Verde Cabo Verde Cabo Verde Cabo Verde Cabo Verde Cabo Verde Cabo Verde Cabo Verde Cabo Verde Kenya Kenya Kenya Kenya Kenya Kenya Kenya Kenya Kenya Kenya Kenya Kenya Kenya Kenya Kenya Kenya Kenya Kenya Kenya Kenya Kenya Kenya Kenya Kenya Kenya Kenya Kenya Kenya Kenya Kenya Kenya Kenya Kenya Kenya Kenya Kenya Kenya Kenya Cote d'Ivoire Cote d'Ivoire Cote d'Ivoire Cote d'Ivoire Cote d'Ivoire Cote d'Ivoire Cote d'Ivoire Cote d'Ivoire Cote d'Ivoire Cote d'Ivoire Cote d'Ivoire Cote d'Ivoire Cote d'Ivoire Cote d'Ivoire Cote d'Ivoire Cote d'Ivoire Cote d'Ivoire Cote d'Ivoire Cote d'Ivoire Cote d'Ivoire Cote d'Ivoire Cote d'Ivoire Cote d'Ivoire Cote d'Ivoire Cote d'Ivoire Cote d'Ivoire Cote d'Ivoire Cote d'Ivoire Cote d'Ivoire Cote d'Ivoire Cote d'Ivoire Cote d'Ivoire Cote d'Ivoire Cote d'Ivoire Cote d'Ivoire Cote d'Ivoire Cote d'Ivoire Cote d'Ivoire Burkina Faso Burkina Faso Burkina Faso Burkina Faso Burkina Faso Burkina Faso Burkina Faso Burkina Faso Burkina Faso Burkina Faso Burkina Faso Burkina Faso Burkina Faso Burkina Faso Burkina Faso Burkina Faso Burkina Faso Burkina Faso Burkina Faso Burkina Faso Burkina Faso Burkina Faso Burkina Faso Burkina Faso Burkina Faso Burkina Faso Burkina Faso Burkina Faso Burkina Faso Burkina Faso Burkina Faso Burkina Faso Burkina Faso Burkina Faso Burkina Faso Burkina Faso Burkina Faso Burkina Faso Equatorial Guinea Equatorial Guinea Equatorial Guinea Equatorial Guinea Equatorial Guinea Equatorial Guinea Equatorial Guinea Equatorial Guinea Equatorial Guinea Equatorial Guinea Equatorial Guinea Equatorial Guinea Equatorial Guinea Equatorial Guinea Equatorial Guinea Equatorial Guinea Equatorial Guinea Equatorial Guinea Equatorial Guinea Equatorial Guinea Equatorial Guinea Equatorial Guinea Equatorial Guinea Equatorial Guinea Equatorial Guinea Equatorial Guinea Equatorial Guinea Equatorial Guinea Equatorial Guinea Equatorial Guinea Equatorial Guinea Equatorial Guinea Equatorial Guinea Equatorial Guinea Equatorial Guinea Equatorial Guinea Equatorial Guinea Equatorial Guinea Comoros Comoros Comoros Comoros Comoros Comoros Comoros Comoros Comoros Comoros Comoros Comoros Comoros Comoros Comoros Comoros Comoros Comoros Comoros Comoros Comoros Comoros Comoros Comoros Comoros Comoros Comoros Comoros Comoros Comoros Comoros Comoros Comoros Comoros Comoros Comoros Comoros Comoros Madagascar Madagascar Madagascar Madagascar Madagascar Madagascar Madagascar Madagascar Madagascar Madagascar Madagascar Madagascar Madagascar Madagascar Madagascar Madagascar Madagascar Madagascar Madagascar Madagascar Madagascar Madagascar Madagascar Madagascar Madagascar Madagascar Madagascar Madagascar Madagascar Madagascar Madagascar Madagascar Madagascar Madagascar Madagascar Madagascar Madagascar Madagascar Gabon Gabon Gabon Gabon Gabon Gabon Gabon Gabon Gabon Gabon Gabon Gabon Gabon Gabon Gabon Gabon Gabon Gabon Gabon Gabon Gabon Gabon Gabon Gabon Gabon Gabon Gabon Gabon Gabon Gabon Gabon Gabon Gabon Gabon Gabon Gabon Gabon Gabon Congo, Dem. Rep. Congo, Dem. Rep. Congo, Dem. Rep. Congo, Dem. Rep. Congo, Dem. Rep. Congo, Dem. Rep. Congo, Dem. Rep. Congo, Dem. Rep. Congo, Dem. Rep. Congo, Dem. Rep. Congo, Dem. Rep. Congo, Dem. Rep. Congo, Dem. Rep. Congo, Dem. Rep. Congo, Dem. Rep. Congo, Dem. Rep. Congo, Dem. Rep. Congo, Dem. Rep. Congo, Dem. Rep. Congo, Dem. Rep. Congo, Dem. Rep. Congo, Dem. Rep. Congo, Dem. Rep. Congo, Dem. Rep. Congo, Dem. Rep. Congo, Dem. Rep. Congo, Dem. Rep. Congo, Dem. Rep. Congo, Dem. Rep. Congo, Dem. Rep. Congo, Dem. Rep. Congo, Dem. Rep. Congo, Dem. Rep. Congo, Dem. Rep. Congo, Dem. Rep. Congo, Dem. Rep. Congo, Dem. Rep. Congo, Dem. Rep. Ethiopia Ethiopia Ethiopia Ethiopia Ethiopia Ethiopia Ethiopia Ethiopia Ethiopia Ethiopia Ethiopia Ethiopia Ethiopia Ethiopia Ethiopia Ethiopia Ethiopia Ethiopia Ethiopia Ethiopia Ethiopia Ethiopia Ethiopia Ethiopia Ethiopia Ethiopia Ethiopia Ethiopia Ethiopia Ethiopia Ethiopia Ethiopia Ethiopia Ethiopia Ethiopia Ethiopia Ethiopia Ethiopia Botswana Botswana Botswana Botswana Botswana Botswana Botswana Botswana Botswana Botswana Botswana Botswana Botswana Botswana Botswana Botswana Botswana Botswana Botswana Botswana Botswana Botswana Botswana Botswana Botswana Botswana Botswana Botswana Botswana Botswana Botswana Botswana Botswana Botswana Botswana Botswana Botswana Botswana Gambia, The Gambia, The Gambia, The Gambia, The Gambia, The Gambia, The Gambia, The Gambia, The Gambia, The Gambia, The Gambia, The Gambia, The Gambia, The Gambia, The Gambia, The Gambia, The Gambia, The Gambia, The Gambia, The Gambia, The Gambia, The Gambia, The Gambia, The Gambia, The Gambia, The Gambia, The Gambia, The Gambia, The Gambia, The Gambia, The Gambia, The Gambia, The Gambia, The Gambia, The Gambia, The Gambia, The Gambia, The Gambia, The Mali Mali Mali Mali Mali Mali Mali Mali Mali Mali Mali Mali Mali Mali Mali Mali Mali Mali Mali Mali Mali Mali Mali Mali Mali Mali Mali Mali Mali Mali Mali Mali Mali Mali Mali Mali Mali Mali Eritrea Eritrea Eritrea Eritrea Eritrea Eritrea Eritrea Eritrea Eritrea Eritrea Eritrea Eritrea Eritrea Eritrea Eritrea Eritrea Eritrea Eritrea Eritrea Eritrea Eritrea Eritrea Eritrea Eritrea Eritrea Eritrea Eritrea Eritrea Eritrea Eritrea Eritrea Eritrea Eritrea Eritrea Eritrea Eritrea Eritrea Eritrea Guinea Guinea Guinea Guinea Guinea Guinea Guinea Guinea Guinea Guinea Guinea Guinea Guinea Guinea Guinea Guinea Guinea Guinea Guinea Guinea Guinea Guinea Guinea Guinea Guinea Guinea Guinea Guinea Guinea Guinea Guinea Guinea Guinea Guinea Guinea Guinea Guinea Guinea Benin Benin Benin Benin Benin Benin Benin Benin Benin Benin Benin Benin Benin Benin Benin Benin Benin Benin Benin Benin Benin Benin Benin Benin Benin Benin Benin Benin Benin Benin Benin Benin Benin Benin Benin Benin Benin Benin Lesotho Lesotho Lesotho Lesotho Lesotho Lesotho Lesotho Lesotho Lesotho Lesotho Lesotho Lesotho Lesotho Lesotho Lesotho Lesotho Lesotho Lesotho Lesotho Lesotho Lesotho Lesotho Lesotho Lesotho Lesotho Lesotho Lesotho Lesotho Lesotho Lesotho Lesotho Lesotho Lesotho Lesotho Lesotho Lesotho Lesotho Lesotho Ghana Ghana Ghana Ghana Ghana Ghana Ghana Ghana Ghana Ghana Ghana Ghana Ghana Ghana Ghana Ghana Ghana Ghana Ghana Ghana Ghana Ghana Ghana Ghana Ghana Ghana Ghana Ghana Ghana Ghana Ghana Ghana Ghana Ghana Ghana Ghana Ghana Ghana Congo, Rep. Congo, Rep. Congo, Rep. Congo, Rep. Congo, Rep. Congo, Rep. Congo, Rep. Congo, Rep. Congo, Rep. Congo, Rep. Congo, Rep. Congo, Rep. Congo, Rep. Congo, Rep. Congo, Rep. Congo, Rep. Congo, Rep. Congo, Rep. Congo, Rep. Congo, Rep. Congo, Rep. Congo, Rep. Congo, Rep. Congo, Rep. Congo, Rep. Congo, Rep. Congo, Rep. Congo, Rep. Congo, Rep. Congo, Rep. Congo, Rep. Congo, Rep. Congo, Rep. Congo, Rep. Congo, Rep. Congo, Rep. Congo, Rep. Congo, Rep. Mauritius Mauritius Mauritius Mauritius Mauritius Mauritius Mauritius Mauritius Mauritius Mauritius Mauritius Mauritius Mauritius Mauritius Mauritius Mauritius Mauritius Mauritius Mauritius Mauritius Mauritius Mauritius Mauritius Mauritius Mauritius Mauritius Mauritius Mauritius Mauritius Mauritius Mauritius Mauritius Mauritius Mauritius Mauritius Mauritius Mauritius Mauritius Liberia Liberia Liberia Liberia Liberia Liberia Liberia Liberia Liberia Liberia Liberia Liberia Liberia Liberia Liberia Liberia Liberia Liberia Liberia Liberia Liberia Liberia Liberia Liberia Liberia Liberia Liberia Liberia Liberia Liberia Liberia Liberia Liberia Liberia Liberia Liberia Liberia Liberia Guinea-Bissau Guinea-Bissau Guinea-Bissau Guinea-Bissau Guinea-Bissau Guinea-Bissau Guinea-Bissau Guinea-Bissau Guinea-Bissau Guinea-Bissau Guinea-Bissau Guinea-Bissau Guinea-Bissau Guinea-Bissau Guinea-Bissau Guinea-Bissau Guinea-Bissau Guinea-Bissau Guinea-Bissau Guinea-Bissau Guinea-Bissau Guinea-Bissau Guinea-Bissau Guinea-Bissau Guinea-Bissau Guinea-Bissau Guinea-Bissau Guinea-Bissau Guinea-Bissau Guinea-Bissau Guinea-Bissau Guinea-Bissau Guinea-Bissau Guinea-Bissau Guinea-Bissau Guinea-Bissau Guinea-Bissau Guinea-Bissau Central African Republic Central African Republic Central African Republic Central African Republic Central African Republic Central African Republic Central African Republic Central African Republic Central African Republic Central African Republic Central African Republic Central African Republic Central African Republic Central African Republic Central African Republic Central African Republic Central African Republic Central African Republic Central African Republic Central African Republic Central African Republic Central African Republic Central African Republic Central African Republic Central African Republic Central African Republic Central African Republic Central African Republic Central African Republic Central African Republic Central African Republic Central African Republic Central African Republic Central African Republic Central African Republic Central African Republic Central African Republic Central African Republic Angola Angola Angola Angola Angola Angola Angola Angola Angola Angola Angola Angola Angola Angola Angola Angola Angola Angola Angola Angola Angola Angola Angola Angola Angola Angola Angola Angola Angola Angola Angola Angola Angola Angola Angola Angola Angola Angola Mozambique Mozambique Mozambique Mozambique Mozambique Mozambique Mozambique Mozambique Mozambique Mozambique Mozambique Mozambique Mozambique Mozambique Mozambique Mozambique Mozambique Mozambique Mozambique Mozambique Mozambique Mozambique Mozambique Mozambique Mozambique Mozambique Mozambique Mozambique Mozambique Mozambique Mozambique Mozambique Mozambique Mozambique Mozambique Mozambique Mozambique Mozambique 0 2 4 6 8 Income Inequality 0 50 100 150 Trade Openness Coef. Slope = 0.01 Std. Err. = 0.00 F-Stat. = 34.35
  • 6. Does Trade Openness Increase Income Inequality in Africa? An Analysis.... *Corresponding Author: ZOGO EKASSI Richard1 www.aijbm.com 6 | Page poverty line (Mahmmod and Noor, 2014). 〖Trade_openness〗_it is trade openness as measured by Squalli and Wilson's (2011) indicators. It incorporates five indicators that take into account:  The trade share of country i in world trade (TS), i.e. the sum of exports and imports in relation to GDP. With TS, the Trade Share index; X is the volume of exports; M is the volume of imports; GDP is the gross domestic product in real terms and i is the index relative to the different countries. This measure is important because it allows us to capture the trade gains of the country under consideration. Its formula is as follows : ( )/ i TS X M PIB    The proportion of the country's trade in relation to the world average. For a value greater than 1, the country participates strongly in the world average trade. With CTSirepresents the composite trade share index or Composite Trade Share. The CTSi index is calculated as follows: 1 ( ) ( ) * 1 ( ) i i i n i j j X M X M CTS PIB X M n        The trade openness index is measured by the World Trade Share or WTSi. It captures the relative contribution that a country has in world trade. With j the index of all countries in a considered group. The larger WTSi of country i, the better the country's contribution to world trade. Its formula is as follows: 1 ( ) ( ) i i n j j X M WTS X M      For the first three indices of trade openness presented above, Organization for Economic Cooperation and Development (OECD) countries lead in the following order: United States, Germany, Russia, Great Britain, and Japan (Squalli and Wilson, 2011). Generally, African countries occupy the last places in the ranking.  The share of exports in the GDP of country i as a measure of trade openness. This index provides information on the weight of exports in the GDP of country i. Overall, it provides an overview of the volume of exports in relation to national production. On the other hand, it provides little information on the behavior of the country in relation to the trade volume of other countries. However, high weight of the volume of exports in the GDP reflects its degree of openness. Its formula is as follows. i i i X x PIB   The share of imports in the GDP of country i. The index provides information on the volume of imports in the GDP. i i i M m PIB  The last two indices capture the volume of trade in the country's GDP. They provide little information on the positioning of the country in relation to other countries at the global level (Harrison, 1996). These measures illustrate the ranking of African countries according to their degree of trade openness. X is the vector of control variables composed of:(i) real gross domestic product (GDP) growth increases the volume of trade based on diversification of production on the one hand and the search for gains from trade on the other (Chen and Turnovsky, 2010); (ii) human capital approximated by the number of students enrolled in secondary school. It explains the ability to acquire and internalize new technologies (Anyanwu, 2014). A better- educated population will tend to import sophisticated goods, thus compensating for the insufficient modernization of the national production system; (iii) domestic investment, measured by gross fixed capital formation, reflects the acquisition of new equipment in order to increase production and captures the contribution of the private sector to national production (Choong et al., 2010). Thus, µi captures unobserved country-specific effects. νt captures the time-specific effect common to all countries and εit is the error term. Thus, α, β and φ are the parameters to be estimated. 4.2. The estimation technique The estimation technique adopted is Double Least Squares (DLS), which is used when in a linear regression at least one of the explanatory variables is endogenous or when an explanatory variable is measured with error (Nwakuya and Ijomah, 2017). In this case, that variable and the error term will be correlated. To estimate such a model, it is more advisable to consider instrumental variables. In the case of an endogeneity problem, it is also advisable to use the generalized method of moments. However, considering that the changes in the data on the Women's Political Empowerment indices, very little fluctuation emerges. Thus, the lagged variables have little influence on the present variables. We then decline this technique. However, if an endogenous variable exists, the classic model techniques are no longer considered. If such a variable exists, it is
  • 7. Does Trade Openness Increase Income Inequality in Africa? An Analysis.... *Corresponding Author: ZOGO EKASSI Richard1 www.aijbm.com 7 | Page possible to obtain a convergent estimate of the parameter of interest. The most classical estimator is the double least squares estimator. It is obtained by regressing the dependent variable not on the endogenous regressor, but on its ordinary least squares prediction from the first stage regression. We then carry out a double estimation, hence the name of Double Least Square. Moreover, having verified the non-existence of an endogeneity problem, the robustness of the results is achieved by estimating the basic model by Ordinary Least Squares. This technique reduces the problem of measuring the dependent variable. 4.3. The data The sample consists of 38 countries in Africa (Table 1). The study covers the period 1980-2018. The availability of data on the various indices of trade openness justifies the sample size. Macroeconomic variables are taken from the World Bank's World Development Indicators (2018). Income inequality specific data are taken from Standardized World Income Inequality Database (SWIID). Table1: List of countries Sierra Leone, Seychelles, Gabon, Ghana, Zambia, Mauritius, Mozambique, Benin, Malawi, Erythree, Ouganda, Rwanda, Sao Tome and Principe, Guinea-Bissau, Cape Verde, Afrique du sud, Botswana Kenya, Nigeria, Equatorial Guinea, Madagascar, Gambia, RDC, Comores, Guinea, Angola, Namibia, Burundi, Burkina Faso, Cote d'Ivoire, Chad, Senegal, Mali, Tanzania, Swaziland, RCA, Congo, Togo, Lesotho, Cameroon, Liberia, Ethiopia, Niger Source: author. The descriptive statistics show small variations (Table 2). It is recognized that when the data fluctuate slightly, the results tend to converge. Table2:Descriptives statistics Variables Observations Moyennes Ecart-type Minimum Maximum Income inequalities 1634 3.937821 12.87274 8.740 65.8 Trade share(TS) 1634 69.32657 35.94212 6.320343 311.3541 Composition of trade(CTS) 1634 87.14805 215.7527 0 1931.51 World trade share(WTS) 1634 6286.614 18728.93 0 193151 Export/PIB 1634 29.45556 18.83434 2.524688 107.9944 Import/PIB 1634 39.87101 21.45984 2.982036 236.391 GDP/Capiter 1634 4.011719 7.128599 -50.24807 149.973 Human capital 1634 33.38022 24.71945 2.48434 115.9565 Private investment 1634 20.33231 9.203847 -2.424358 89.38613 Source: author, from World Bank Database (2019). The correlations between the different analysis variables are not high enough to cause serious multicollinearity problems (Table 3). Financial development indicators are positively correlated with trade openness. Tableau 3 : Correlation matrix Income_ine TS CTS WTS WTSPRIME X/PIB M/PIB GDP Hum_cap Dom_inv Income_ine 1.0000 TS -0.0132 1.0000 CTS 0.0021 0.0526 1.0000 WTS 0.0045 0.0762 1.0000 1.0000 WTSPRIME 0.0046 0.0762 1.0000 1.0000 1.0000 X/PIB 0.3398 0.6510 0.6728 0.4650 0.0280 1.0000 M/PIB 0.0938 0.1832 0.2103 0.0664 0.1277 -0.063 1.0000 GDP -0.0058 0.1241 0.0479 0.0258 0.0257 0.0434 -0.025 1.0000 Human_cap 0.0441 0.4492 0.3398 0.3552 0.3553 0.6728 0.4650 0.0280 1.0000 Domes_inves -0.0108 0.3120 0.0938 0.1118 0.1118 0.2103 0.0664 0.1277 0.2184 1.0000 Source: author. V. Results and interpretations We first present the results of the basic model and then we perform a robustness analysis. 5.1. Trade Openness and Inequality: Results from the Basic Model Table 4 below illustrates the relative relevance of the variables. Overall, the results show that the relative shares of home country trade, home country trade to world average trade, world trade composition, exports and imports to GDP increase income inequality in SSA. As a result, there are barriers to social inclusion, which fuel poverty as people seek better opportunities. In addition, the low diversification of traded products and the lack of true value chains in the different commodity chains is not beneficial to the poor in SSA, as it hinders
  • 8. Does Trade Openness Increase Income Inequality in Africa? An Analysis.... *Corresponding Author: ZOGO EKASSI Richard1 www.aijbm.com 8 | Page the efficient allocation of capital, which inhibits overall growth by tightening credit constraints that largely disadvantage households, to the benefit of income inequality. However, trade flows accentuate the inequity of income and wage distribution. Although these results run counter to traditional HOS theory, they confirm the theoretical model of Feenstra and Hanson (1996). Indeed, when developing countries trade with developed countries, income inequality increases. Although trade openness is unequal in terms of income distribution, in developed countries it is the main source of income for the poor. Trade liberalization has aggravated income inequality in Sub-Saharan Africa by reducing the share of value added in manufacturing, coupled with relative macroeconomic stability, higher inflation, and a less competitive real exchange rate that exacerbates income disparity. The increase in inequality is also attributable to the decline in the share of value added of labor- intensive manufacturing in total output, which has been induced by trade liberalization and the corresponding decline in the average tariff rate. While trade openness in Africa has helped improve production efficiency, it has not allowed firms to achieve economies of scale (lower unit production costs as the market size increases). This lack of price decline is compounded by the lack of diversity of supply, which is a source of price instability, particularly in agricultural markets. The embryonic development of global value chains does not allow for the integration of some African countries into globalization, thus reducing national income per capita. Yet GVCs offer the opportunity to integrate into global markets at lower cost, since firms will only produce a portion of the final product. As a result, the gains from participating in GVCs and globalization, in general, are not equally distributed across and within countries, leading to rising inequality. The adverse effects of trade openness are very often localized and long-lasting because of interregional and intersectoral rigidities in labor mobility. These aspects exacerbate inequalities due to the predominance of large firms, wage premiums that reflect rents that firms share with labor, and the intensification of competition in the final goods market that the elimination of trade barriers bring about. Thus, trade openness affects industrial wage premiums through labor productivity. Indeed, if industrial firms facing the largest tariff cuts following liberalization of their sector manage to improve their relative productivity, they will be able to transfer part of these productivity gains in the form of wage increases. Nevertheless, there is a significant risk that rising income inequality will lead to conflict and civil war. Table 4: Effects of trade openness on income inequality in Sub-Saharan Africa Estimation technique : Doubles Least Squares Dependante variable: Income inequality (1) (2) (3) (4) (5) (6) GDP/Capita 0.0344** 0.0434** 0.0459*** 0.0348* 0.0396*** 0.0419*** (0.0283) (0.0283) (0.0334) (0.0282) (0.0284) (0.0281) Human capital 0.0446*** 0.0368*** 0.0529*** 0.0499*** 0.0404*** 0.0376*** (0.0058) (0.0063) (0.0066) (0.0061) (0.0063) (0.0060) Domestic investment 0.0486*** 0.0369** 0.0648*** 0.0465*** 0.0445*** 0.0335** (0.0148) (0.0152) (0.0164) (0.0148) (0.0150) (0.0152) Trade Share (TS) 0.0144*** (0.0448) Composition Trade Share (CTS) 0.00175*** (0.0066) World Trade Share (WTS) 0.0508* (0.0292) Exportations/GDP 0.0139* (0.0827) Importations/GDP 0.0294*** (0.0757) Constante -0.706* -1.140*** -1.206*** -0.698* -0.850** -1.292*** (0.372) (0.394) (0.429) (0.371) (0.382) (0.399) Observations 817 817 693 817 817 817 817 Countries 38 38 38 38 38 38 38 R2 0.098 0.110 0.130 0.107 0.107 0.101 0.115 Notes: ( ) standard deviations robust to heteroscedasticity *, **, and *** indicate significance at the 10%, 5%, and 1% confidence level respectively. Source: author. Real GDP per capita increases income inequality in Sub-Saharan Africa. The plausible explanations are that the low level of income that characterizes African wage earners and non-wage earners does not allow them
  • 9. Does Trade Openness Increase Income Inequality in Africa? An Analysis.... *Corresponding Author: ZOGO EKASSI Richard1 www.aijbm.com 9 | Page to meet their basic needs or to afford decent housing because of the high cost of living. In addition, the inefficient redistribution of the benefits of growth, particularly natural resources, does not benefit all segments of the population. As a result, marginalized populations find themselves in a precarious situation, unable to find housing even at lower costs. This finding corroborates that of Fosu (2018) who points out that socioeconomic disparities increase income inequality in Africa. Human capital contributes to accentuating income inequalities because of the knowledge acquired by populations, and therefore membership in international organizations by almost all African countries restricts activities that affect income disparities. Indeed, human capital induces a propensity for educated people to want to migrate even though they do not have the means. As a result, these people end up in uncomfortable housing at the risk of their well-being. Education and learning are of relative quality and inequality and exclusion exist at all levels. Even with the substantial increase in the number of children accessing basic education, a large number are still out of school due to the distribution of essential infrastructure such as schools. These findings are consistent with those of Acosta et al (2008). Private investment has a positive and statistically significant effect on income inequality in Sub-Saharan Africa. Moreover, human capital is a multidimensional and multifunctional factor in income inequality. As a component inserted in specific socio-historical systems, it constitutes a process of formation of economic agents, but not of socialization, which crowds out the diffuse process of transmission and creation of value, favoring the perpetual stockpiling of skills, the absence of innovation within production units, which reduces their supply to international trade. This result could be explained by the fact that private investment is not a prerequisite and indispensable condition for the processes of reducing disparities, as well as for the effective application of strategies to eradicate the daily obstacles of households. As the engine that drives the economic machine, it does not allow entrepreneurs to gather the resources needed to produce goods and services that are conducive to job creation, the adoption of innovations, and especially international trade. These results corroborate those of Alejandro et Chavèz (2016). 5.2. Robustness analysis In order to ensure the robustness of our results, we estimate the effects of trade openness on income inequality in Sub-Saharan Africa using the Pool Mean Group econometric technique. Overall, the results are consistent with those obtained in the baseline model and the empirical literature. The relative shares of home country trade, home country trade to average world trade, world trade composition, exports and imports to GDP increase income inequality in Sub-Saharan Africa as shown in Table 5 below. Without claiming to be exhaustive, three explanations can be put forward. First, the highly dualistic structure of the economy, where jobs in government, multinationals, and the resource sector are reserved for elites, while the majority of workers have to make do with much lower incomes from the formal economy or the subsistence sector (Buffi and Atolia, 2012). Second, the high concentration of physical capital, human capital, and land, especially in the East and Southern African economies and in specific groups or regions. Finally, the limited distributive role of the state, often manifested through the "natural resource curse," urban bias in public policy, and ethnic and gender inequalities. These explanations are compounded by rising domestic and international investment in extractive industries and rising terms of trade in resource-rich countries, which polarize income disparities. Recent literature also highlights the suboptimal structural transition of the economy from cash crop agriculture characterized by low levels of inequality to sectors with high levels of inequality, such as livestock production, trade, transport, and formal and informal services, which are responsible for inequality. There is also an uneven distribution of socioeconomic and physical facilities (roads, electricity, schools, hospitals, water, and sanitation) between rural and urban areas and across regions, leading to income disparities. These results are consistent with those ofHirte et al., (2020), Bergh et Nilsson (2010). Table 5: Effects of trade openness on income inequality in Sub-Saharan Africa Estimation technique : Pool Mean Group Dependante variable: Income inequality (1) (2) (3) (4) (5) (6) GDP/Capita 0.0276** 0.0378** * 0.0409 0.0258* 0.0334* 0.0369* (0.0202) (0.0214) (0.0268) (0.0196) (0.0217) (0.0208) Human capital 0.0456** * 0.0376** * 0.0544*** 0.0515*** 0.0411** * 0.0382*** (0.0050) (0.0070) (0.0053) (0.0053) (0.0077) (0.0052) Investissement domestique 0.0446** * 0.0312** 0.0571*** 0.0433*** 0.0397** * 0.0275**
  • 10. Does Trade Openness Increase Income Inequality in Africa? An Analysis.... *Corresponding Author: ZOGO EKASSI Richard1 www.aijbm.com 10 | Page (0.0125) (0.0143) (0.0158) (0.0122) (0.0138) (0.0130) Trade Share (TS) 0.0158* (0.0086) Composition Trade Share (CTS) 0.0174*** (0.0044) World Trade Share (WTS) 0.0456*** (0.0050) Exportations/PIB 0.0165 (0.0181) Importations/PIB 0.0315*** (0.0108) Constante -0.683** - 1.170*** -1.117*** -0.730*** - 0.872*** -1.290*** (0.270) (0.313) (0.315) (0.268) (0.274) (0.318) Observations 817 817 693 817 817 817 Countries 38 38 38 38 38 38 R2 0.76 0.84 0.64 0.67 0.83 0.57 Notes: ( ) standard deviations robust to heteroscedasticity *, **, and *** indicate significance at the 10%, 5%, and 1% confidence level respectively. Source: author. IV. Conclusion The objective of this paper was to assess the role of trade openness on income inequality using a sample of 38 Sub-Saharan African countries over the period 1980-2018. Starting from traditional and modern theories of international trade and inequality, we considered the five measures of trade openness proposed by Squalli and Wilson (2011). To the best of our knowledge, very few works have taken such an encompassing empirical approach. From the estimates made on a dynamic panel data model by Double Least Squares, the results indicate that the relative share of domestic country trade, the relative share of trade in the composition of world trade, the share of exports to GDP, the share of imports to GDP, and the relative share of domestic country trade to average world trade increase income inequality in Sub-Saharan Africa. From these results, some non-exhaustive policy suggestions can be made to mitigate income inequality in SSA. First, the implementation of appropriate strategies to attract investment in processing sectors, particularly in industry, in order to reduce raw product exports and consolidate the industrial fabric of African economies. Second, to reduce imports, particularly of food products, by implementing reforms to increase the productivity of agricultural sectors and organize regional markets. Third, consolidate and finalize the implementation of structural reforms to improve the competitiveness of traditional export sectors and diversify the supply of goods and services. References [1]. Adam S. (1776), Research on the nature and causes of the wealth of nations. Book IV: Systems of political economy. [2]. Anderson E. (2020), The impact of trade liberalization on poverty and inequality: evidence from CGE models, Journal of Policy Modeling (2020), doi: https://doi.org/10.1016/j.jpolmod.2020.05.006 [3]. Alderson A-S, Nielsen F (2003), Globalization and the Great U-turn: Income Inequality Trends in 16 OECD Countries. American Journal of Sociology, 107: 1244-1299. [4]. Anderson E. (2005). Openness and Inequality in Developing Countries: A review of theory and recent evidence. World Development, 33(7),1045-1063. [5]. Anyanwu J-C., Andrew E-O., Erhijakpor, Emeka O. (2016) Empirical Analysis of the Key Drivers of Income Inequality in West Africa. African Development Review, 28(1), 18-38. [6]. Arabiyat T. S., Metri F. M., Samawi G. A. (2019), Trade Openness, Inclusive Growth, And Inequality: Evidence from Jordan. Journal of Developing Areas. [7]. Aradhyula S., Rahman T., Seenivasan K. (2007), Impact of international trade on income and income inequality”, paper presented at American Agricultural Economics Association Annual Meeting, Portland. [8]. Asteriou D., Dimelis S., Moudatsou A. (2014), Globalization and income inequality: A panel data econometric approach for the EU27 countries. Economic Modelling, 36, 592-599. [9]. Baldwin R., Krugman P. (1989), Persistent trade effects of large exchange rate shocks. Quarterly Journal of Economics, 104 (4), 635-654.
  • 11. Does Trade Openness Increase Income Inequality in Africa? An Analysis.... *Corresponding Author: ZOGO EKASSI Richard1 www.aijbm.com 11 | Page [10]. Barro R. J. (2000), Inequality and growth in a panel of countries. Journal of Economic Growth, 5(1), 5- 32. [11]. Bensidoun I. Jean S., Sztulman A. (2011), International trade and income distribution: reconsidering the evidence’, Review of World Economics, 147(4), 593-619. [12]. Bergh A., Nilsson T. (2010), Do liberalization and globalization increase income inequality? European Journal of Political Economy, 26(4),488-505. [13]. Bigsten A. (2018), Determinants of the Evolution of Inequality in Africa. Journal of African Economies, 27(1),127-148. [14]. Borras Jr. S. M. (2007), Free market, export-led development strategy and its impact on rural livelihoods, poverty and inequality: The Philippine experience seen from a Southeast Asian perspective. Review of International Political Economy, 14(1), 143-175. [15]. Brunori P., Palmisano F., Peragine V. (2015), Inequality of opportunity in Sub-Saharan Africa. Policy Research Working Paper No. 7782, World Bank, Washington, DC. [16]. Buffie E., Atolia M. (2012), Trade, growth and poverty in Zambia: insights from a dynamic GE model. Journal of Policy Modeling, 34, 211-229. [17]. Chakrabarti A. (2000). Does trade cause inequality? Journal of Economic Development, 25(2), 1-21. [18]. Calderon C., Chong A. (2001), External sector and income inequality in interdependent economies using a dynamic panel data approach. Economics Letters, 71, 225-231. [19]. Campante F., Do Q-A. (2007), Inequality, Redistribution, and Population. Faculty Research Working Papers Series, RWP07-046, John F. Kennedy School of Government, Harvard University, October. [20]. Chang E. C. C., Wu W-C. (2016), Preferential trade agreements, income inequality, and authoritarian survival. Political Research Quarterly, 69 (2), 281-294. [21]. Chen Y. C., Turnovsky S. J. (2010), Growth & inequality in a small open economy. Journal of Macroeconomics, 32, 497-514. [22]. Choong Ch., Baharumshah A., Yusop Z. et Habibullah M. (2010), Private Capital Flows, Stock Market and Economic Growth in Developed and Developing Countries: A Comparative Analysis. Japan and the World Economy, 22, 107-117. [23]. Daymon C. (2012), Ouverture commerciale, inégalités de revenu et répartition salariale dans les pays du Sud et de l’Est de la méditerranée. Région et Développement, 35, 84-98. [24]. Dollar D., Kraay A. (2002), Growth is good for the poor. Journal of Economic Growth, 7(3), 195-225. [25]. Dollar D., Kraay A. (2004), Trade, growth, and poverty. The Economic Journal, 114, 22-49. [26]. Dreher A., Gaston N. (2008), Has globalization increased inequality. Review of International Economics, 16 (3), 516-536. [27]. Dutt A. K., Mukhopadhyay K. (2005), Globalisation and the inequality among nations: A VAR approach. Economics Letters, 88(3), 295-299. [28]. Easterly W. (2007), Globalization, prosperity, and poverty’ in Globalization and poverty, eds A Harrison, University of Chicago Press for National Bureau of Economic Research., Chicago, pp. 109– 142. [29]. Enrique G., Gulde A.-M., Rodolfo M. (2014), Développement financier en Afrique subsaharienne : les enjeux pour une croissance soutenue. Revue d’Economie Financière, 116(4), 19-42. [30]. Feenstra, R. C., Hanson G. H. (1996), Foreign Investment, Outsourcing and Relative Wages. Pages 89– 127 of: Feenstra, Robert C., Grossman, Gene M., & Irwin, Douglas A. (eds), The Political Economy of Trade Policy: Papers in Honor of Jagdish Bhagwati. Cambridge: MIT Press. [31]. Fluckiger Y., Ramirez J., Deutsch J., Silber J. (2002). Inequality of income and openness to foreign trade. Schweizerische Zeitschrift fur Soziologie, 28, 241-265. [32]. Fosu A. (2018) Economic Structure, Growth, and Evolution of Inequality and Poverty in Africa: An Overview. Journal of African Economies, 27(1), 1-9. [33]. Galiani S., Sanguinetti P. (2003), The impact of trade liberalization on wage inequality: Evidence from Argentina, Journal of Development Economics, 72(2), 497-513. [34]. Goldberg P. K., Pavcnik N. (2007), Distributional effects of globalization in developing countries. Journal of Economic Literature, 45(1), 39-82. [35]. Gourdon, J., Maystre, N., De Melo, J. (2008), Openness, inequality and poverty: Endowments matter. Journal of International Trade & Economic Development, 17(3), 343-378. [36]. Grossman G. M., Rossi-Hansberg E. (2008), Trading tasks: A simple theory of Offshoring. American Economic Review, 98(5), 1978-1997. [37]. Green F., Dickerson A., Arbache J. (2001), A picture of wage inequality and the allocation of labor through a period of trade liberalization: The case of Brazil. World Development, 29(11), 1923-1939. [38]. Harrison A., McLaren J., McMillan M. (2010), Recent findings on trade and inequality. NBER Working Paper Series No.16425. Cambridge, MA: National Bureau of Economic Research.
  • 12. Does Trade Openness Increase Income Inequality in Africa? An Analysis.... *Corresponding Author: ZOGO EKASSI Richard1 www.aijbm.com 12 | Page [39]. Hartmann D., Mayra B., Lodolo B., Pinheiro E. L. (2017), International trade, development traps, and the core-periphery structure of income inequality. EconomiA, 21, 255-278. [40]. Heerink N., Mulatu A., Bulte E. (2001), Income inequality and the environment: aggregation bias in environmental Kuznets curves. Ecological Economics, 38(3), 359-367. [41]. Hirte G., Lessmann C., Seide A. (2020), International trade, geographic heterogeneity and interregional inequality. European Economic Review, 127, 103427. https://doi.org/10.1016/j.euroecorev.2020.103427 [42]. Jaumotte F., Lall S., Papageorgiou C. (2013) Rising Income Inequality: Technology, or Trade and Financial Globalization? IMF Economic Review, 61(2), 271-309. [43]. Kentor J. (2001), The long-term effects of globalization on income inequality, population growth, and economic development. Social Problems, 48, 435-455. [44]. Kletzer K., Bardhan P. (1987), Credit markets and patterns of international trade. Journal of Development Economics, 27(7), 57-70. [45]. Krugman P. R. (1979), Increasing Returns, Monopolistic Competition, and International Trade. Journal of International Economics, 9(4), 469-479. [46]. Krugman P. R. (2008), Trade and Wages, Reconsidered. Brookings Papers on Economic Activity, 2008(1), 103-154. [47]. Laigle L. (2005), Inégalités et développement urbain, Programme Politiques territoriales de développement durable, PUCA – METATTM. [48]. Lee H-Y., Kim J., Cin B-C. (2013) Empirical Analysis on the Determinants of Income Inequality in Korea. International Journal of Advanced Science and Technology, 53, 95-109. [49]. Lee J., Wei D. (2015), Technological change, skill demand, and wage inequality: Evidence from Indonesia. World Development, 67, 238-250. [50]. Levine R. (2005), Finance and Growth: Theory and Evidence, in Aghion P. et Durlauf S. (éd.), Handbook of Economic Growth, edition 1, vol. 1, chap. 12, pp. 865-934. [51]. Lim G. C., McNelis P. D. (2016), Income growth and inequality: The threshold effects of trade and financial openness. Economic Modelling, http://dx.doi.org/10.1016/j.econmod.2016.05.010 [52]. Lin F., Fu D. (2016), Trade, Institution Quality and Income Inequality. World Development, 77, 129- 142, [53]. Mahesh M. (2016), The effects of trade openness on income inequality - evidence from BRIC countries, Economics Bulletin, 36(3), 1751-1761 [54]. Mahmood S., Noor Z-M. (2014), Human capital and income inequality in developing countries: new evidence using the Gini coefficient. Journal of Entrepreneurship and Business, 2(1), 40-48. [55]. Meschi E., Vivarelli M. (2009). Trade and income inequality in developing countries. Journal of World Development, 37(2), 287-302 [56]. Midlarsky M., Roberts K. (1985), Class, State, and Revolution in Central America: Nicaragua and El Salvador Compared. Journal of Conflict Resolution, 29, 163-193. [57]. Monnin P. (2014), Inflation and Income Inequality in Developed Economies. CEP Working Paper 2014/1, [58]. May. [59]. North D. C. (1981), Structure and Change in Economic History. New York: W.W. Norton. (1990) Institutions, Institutional Change, and Economic Performance. Cambridge: Cambridge University Press. [60]. Nwakuya M., Ijomah M. (2017), Fixed effect ver-sus random effects modeling in a panel data analysis; A consideration of economic and political indicators in six African countries. International Journal of Statistics and Applications, 7(6), 275-279. [61]. Ongo-Nkoa B. E., Song J. S. (2019), Urbanisation et Inégalités en Afrique : une étude à partir des indices désagrégés. Revue d’Économie Régionale & Urbaine, 3, 447 à 484. [62]. Penn World Data, http://pwt.econ.upenn.edu/. [63]. Rama M. (2002). Globalization, inequality and labor market policies. Revue d’Economie du Développement, 1-2, 43-84. [64]. Rattso J., Stokk H. E. (2013), Trade, skill biased technical change and wage inequality in South Africa. Review of International Economics, 21(3), 419-431. [65]. Ravallion M. (2001), Growth inequality and poverty: looking beyond averages. World Development, 29(11), 1803-1815. [66]. Reuveny R., Li Q. (2003), Economic openness, democracy, and income inequality: An empirical analysis. Comparative Political Studies, 36(5),575-601. [67]. Ricardo D. (1817), On the principles of political economy and taxation. 3rd edition 1821, Batoche Books, Kitchner, Ontario, Ontario, 2001. [68]. Savvides A. (1998), Trade policy and income inequality. Economics Letters, 61(3),365-372.
  • 13. Does Trade Openness Increase Income Inequality in Africa? An Analysis.... *Corresponding Author: ZOGO EKASSI Richard1 www.aijbm.com 13 | Page [69]. Shafiullah M. (2011), Foreign Aid and its Impact on Income Inequality. International Review of Business Research Papers, 7, 91-105. [70]. Shimeles A., Nabassaga T. (2018), Why Is Inequality High in Africa? Journal of African Economies, 27(1), 108-126. [71]. Spilimbergo A., Londono J. L., Szekely M. (1999), Income distribution, factor endowments, and trade openness. Journal of Development Economics, 59(1), 77-101. [72]. Squalli J., Wilson K. (2011), A New Measure of Trade Openness. World Economy, 34, 1745-1770. [73]. Stolper W. F., Samuelson P. A. (1941), Protective and real wages. The review of Economies Studies, 9(1), 58-73. [74]. Wagle U. R. (2007). Are economic liberalization and equity compatible? Evidence from South Asia. World Development, 35(11), 1836-1857. [75]. Winters L. A. (2002), Trade Liberalisation and Poverty: What are the Links? The World Economy, 25(9), 1339-1367. [76]. Wood A. (1997), Openness and Wage Inequality in Developing Countries: The Latin American Challenge to East Asian Conventional Wisdom. The World Bank Economic Review, 11(1), 33-57. [77]. Xu B. (2003), Trade liberalization, wage inequality, and endogenously determined nontraded goods. Journal of International Economics, 60(2), 417-431. [78]. Zhang X., Zhang K.H. (2003), How does globalization affect regional inequality within a developing country? Evidence from China. Journal of Development Studies, 39, 47-67.