
![1/22/2016 Tutorial in Python
http://localhost:8888/notebooks/Dropbox/PYTHON%20BOOK%20WILEY/FINAL/Tutorial%20in%20Python.ipynb# 2/50
In [1]:
In [2]:
In [3]:
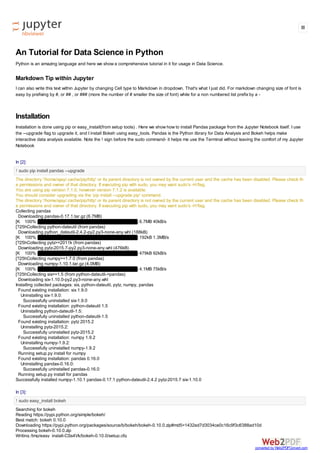
Loading a Python Package
You can load a Python Package using the following ways
import PACKAGE
import PACKAGE as PK
from PACKAGE import FUN
The directory '/home/ajay/.cache/pip/http' or its parent directo
ry is not owned by the current user and the cache has been disab
led. Please check the permissions and owner of that directory. I
f executing pip with sudo, you may want sudo's -H flag.
You are using pip version 7.1.0, however version 8.0.2 is availa
ble.
You should consider upgrading via the 'pip install --upgrade pi
p' command.
The directory '/home/ajay/.cache/pip/http' or its parent directo
ry is not owned by the current user and the cache has been disab
led. Please check the permissions and owner of that directory. I
f executing pip with sudo, you may want sudo's -H flag.
Requirement already up-to-date: pandas in /usr/local/lib/python
2.7/dist-packages
Requirement already up-to-date: python-dateutil in /usr/local/li
b/python2.7/dist-packages (from pandas)
Requirement already up-to-date: pytz>=2011k in /usr/local/lib/py
thon2.7/dist-packages (from pandas)
Requirement already up-to-date: numpy>=1.7.0 in /usr/local/lib/p
ython2.7/dist-packages (from pandas)
Requirement already up-to-date: six>=1.5 in /usr/local/lib/pytho
n2.7/dist-packages (from python-dateutil->pandas)
Searching for bokeh
Best match: bokeh 0.10.0
Processing bokeh-0.10.0-py2.7.egg
bokeh 0.10.0 is already the active version in easy-install.pth
Installing bokeh-server script to /usr/local/bin
Installing websocket_worker.py script to /usr/local/bin
Using /usr/local/lib/python2.7/dist-packages/bokeh-0.10.0-py
2.7.egg
Processing dependencies for bokeh
Finished processing dependencies for bokeh
! sudo pip install pandas --upgrade
! sudo easy_install bokeh
#! conda install seaborn](data:image/gif;base64,R0lGODlhAQABAIAAAAAAAP///yH5BAEAAAAALAAAAAABAAEAAAIBRAA7)
Recommandé
Recommandé
Contenu connexe
Tendances
Tendances (19)
Similaire à A Data Science Tutorial in Python
Similaire à A Data Science Tutorial in Python (20)
Plus de Ajay Ohri
Plus de Ajay Ohri (20)
Dernier
Dernier (20)
A Data Science Tutorial in Python
- 1. 1/22/2016 Tutorial in Python http://localhost:8888/notebooks/Dropbox/PYTHON%20BOOK%20WILEY/FINAL/Tutorial%20in%20Python.ipynb# 1/50 A Complete Tutorial for Data Science in Python Python is an amazing language. It was created by Guido van Rossum. You can read Guido's history of Python at the Python History Blog at http://pythonhistory.blogspot.in/2009/01/introductionand overview.html (http://pythonhistory.blogspot.in/2009/01/introductionandoverview.html) Here we show a comprehensive tutorial in it for usage in Data Science. Data science lies at the intersection of programming, statistics and business analysis. It is the use of programming tools with statistical techniques to analyze data in a systematic and scientific way. Accordingly this tutorial will try to focus atleast on the statistical and programming parts of data science. Data Scientists would also be interested in the PyData community at http://pydata.org/ (http://pydata.org/) Note I am writing this article within the Jupyter notebook, a Python interface derived from iPython. Markdown Tip within Jupyter I can also write this text within Jupyter by changing Cell type to Markdown in dropdown. For markdown changing size of font is easy by prefixing by #, or ## , or ### (more the number of # smaller the size of font as it changes the type from header 1, 2 , 3) . In Markdown for a non numbered list prefix the words by a Markdown within Jupyter is just a # in front of words and changing the cell type to Markdown This is a list made by adding a hypen in front ot words Installation of Python Packages Installation of Python is done using pip or easy_install(from setup tools) . Here we show how to install Pandas package from the Jupyter Notebook itself. I use the upgrade flag to upgrade it, and I install Bokeh using easy_tools. Pandas is the Python library for Data Analysis and Bokeh helps make interactive data analysis available. Note the ! sign before the sudo command it helps me use the Terminal without leaving the comfort of my Jupyter Notebook. I can also install Python packages using conda which is my preffered method for data scienc since I can create custom environments for projects. The complete Python Package Index is at PyPi https://pypi.python.org/pypi (https://pypi.python.org/pypi) PyPi has 71833 packages as of December 30,2015.
- 2. 1/22/2016 Tutorial in Python http://localhost:8888/notebooks/Dropbox/PYTHON%20BOOK%20WILEY/FINAL/Tutorial%20in%20Python.ipynb# 2/50 In [1]: In [2]: In [3]: Loading a Python Package You can load a Python Package using the following ways import PACKAGE import PACKAGE as PK from PACKAGE import FUN The directory '/home/ajay/.cache/pip/http' or its parent directo ry is not owned by the current user and the cache has been disab led. Please check the permissions and owner of that directory. I f executing pip with sudo, you may want sudo's -H flag. You are using pip version 7.1.0, however version 8.0.2 is availa ble. You should consider upgrading via the 'pip install --upgrade pi p' command. The directory '/home/ajay/.cache/pip/http' or its parent directo ry is not owned by the current user and the cache has been disab led. Please check the permissions and owner of that directory. I f executing pip with sudo, you may want sudo's -H flag. Requirement already up-to-date: pandas in /usr/local/lib/python 2.7/dist-packages Requirement already up-to-date: python-dateutil in /usr/local/li b/python2.7/dist-packages (from pandas) Requirement already up-to-date: pytz>=2011k in /usr/local/lib/py thon2.7/dist-packages (from pandas) Requirement already up-to-date: numpy>=1.7.0 in /usr/local/lib/p ython2.7/dist-packages (from pandas) Requirement already up-to-date: six>=1.5 in /usr/local/lib/pytho n2.7/dist-packages (from python-dateutil->pandas) Searching for bokeh Best match: bokeh 0.10.0 Processing bokeh-0.10.0-py2.7.egg bokeh 0.10.0 is already the active version in easy-install.pth Installing bokeh-server script to /usr/local/bin Installing websocket_worker.py script to /usr/local/bin Using /usr/local/lib/python2.7/dist-packages/bokeh-0.10.0-py 2.7.egg Processing dependencies for bokeh Finished processing dependencies for bokeh ! sudo pip install pandas --upgrade ! sudo easy_install bokeh #! conda install seaborn
- 3. 1/22/2016 Tutorial in Python http://localhost:8888/notebooks/Dropbox/PYTHON%20BOOK%20WILEY/FINAL/Tutorial%20in%20Python.ipynb# 3/50 You can then invoke the function using PACKAGE.FUN , PK.FUN and FUN respectively In [4]: In [5]: The Python Package Index (PyPI) https://pypi.python.org/pypi (https://pypi.python.org/pypi) hosts thousands of thirdparty modules for Python . You can browse Python packages by topic at https://pypi.python.org/pypi?%3Aaction=browse (https://pypi.python.org/pypi?%3Aaction=browse) Import Data Let's import some datasets. In [6]: In [7]: In [8]: Out[4]: datetime.datetime(2016, 1, 22, 13, 4, 3, 39744) Out[7]: '/home/ajay/Dropbox/PYTHON BOOK WILEY/FINAL' from datetime import datetime Starttime =datetime.now() Starttime import pandas as pd # In case the file is stored locally we can use the os python library import os as os os.getcwd() #current working directory os.chdir('/home/ajay/Desktop/test')
- 4. 1/22/2016 Tutorial in Python http://localhost:8888/notebooks/Dropbox/PYTHON%20BOOK%20WILEY/FINAL/Tutorial%20in%20Python.ipynb# 4/50 In [9]: In [10]: In [11]: We will use diamond Dataset bundled with R language from https://vincentarelbundock.github.io/Rdatasets/datasets.html (https://vincentarelbundock.github.io/Rdatasets/datasets.html) In [12]: In [13]: So we got a rough estimate for the time it took for code execution through the datetime.timedelta object above. Also read_csv is just one of the many convenient ways we can read data through the pandas library in Python. However Python lacks R's lubridate (for easier date time manipulation) as well as data.table package in R which makes import and manipulation faster. In [14]: Out[9]: ['adult.data.txt'] Out[11]: 32561 Out[13]: datetime.timedelta(0, 5, 689405) Out[14]: pandas.core.frame.DataFrame a=os.getcwd() os.listdir(a) adult=pd.read_csv("adult.data.txt",header=None) len(adult) diamonds =pd.read_csv("https://vincentarelbundock.github.io/Rdatasets/csv/ggplot2/d datetime.now()- Starttime type(diamonds) #this works just like class(object) in R
- 5. 1/22/2016 Tutorial in Python http://localhost:8888/notebooks/Dropbox/PYTHON%20BOOK%20WILEY/FINAL/Tutorial%20in%20Python.ipynb# 5/50 In [15]: to find out more about the objects you can use locals() and globals() Data Inspection We get the column names, the column types as well as the information of the data through columns, dtypes, and info commands below. In R we would get this by str command (for structure). In Python str turns the object to string.(Just one of the ways people can get confused moving between data science languages) In R we use names function for variable names and length for length of object. While Python uses columns and len respectively. In [16]: Out[15]: ['T', '_AXIS_ALIASES', '_AXIS_IALIASES', '_AXIS_LEN', '_AXIS_NAMES', '_AXIS_NUMBERS', '_AXIS_ORDERS', '_AXIS_REVERSED', '_AXIS_SLICEMAP', '__abs__', '__add__', '__and__', '__array__', '__array_wrap__', '__bool__', '__bytes__', '__class__', '__contains__', Out[16]: Index(['Unnamed: 0', 'carat', 'cut', 'color', 'clarity', 'dept h', 'table', 'price', 'x', 'y', 'z'], dtype='object') #to find out what all functions we can do we can just use the dir command dir(diamonds) diamonds.columns # In Python as well as R , a single Line Comment starts with # # name of variables is given by columns. In R we would use the command names(object # Note also R uses the FUNCTION(OBJECTNAME) syntax while Python uses OBJECTNAME.FUN
- 6. 1/22/2016 Tutorial in Python http://localhost:8888/notebooks/Dropbox/PYTHON%20BOOK%20WILEY/FINAL/Tutorial%20in%20Python.ipynb# 6/50 In [17]: In [18]: In [19]: In [20]: Out[17]: Unnamed: 0 int64 carat float64 cut object color object clarity object depth float64 table float64 price int64 x float64 y float64 z float64 dtype: object Out[18]: 53940 Out[19]: 5.394 Out[20]: 5 diamonds.dtypes len(diamonds) #gives the number of rows 0.0001*len(diamonds) round(0.0001*len(diamonds))
- 7. 1/22/2016 Tutorial in Python http://localhost:8888/notebooks/Dropbox/PYTHON%20BOOK%20WILEY/FINAL/Tutorial%20in%20Python.ipynb# 7/50 In [21]: <class 'pandas.core.frame.DataFrame'> Int64Index: 53940 entries, 0 to 53939 Data columns (total 11 columns): Unnamed: 0 53940 non-null int64 carat 53940 non-null float64 cut 53940 non-null object color 53940 non-null object clarity 53940 non-null object depth 53940 non-null float64 table 53940 non-null float64 price 53940 non-null int64 x 53940 non-null float64 y 53940 non-null float64 z 53940 non-null float64 dtypes: float64(6), int64(2), object(3) memory usage: 4.3+ MB '''Lets get some information on the object. This was a multiple line comment using three single quote marks ''' diamonds.info()
- 8. 1/22/2016 Tutorial in Python http://localhost:8888/notebooks/Dropbox/PYTHON%20BOOK%20WILEY/FINAL/Tutorial%20in%20Python.ipynb# 8/50 In [22]: Data Munging To refer to particular row in Python I can use index or .ix In R I refer to the object in i th row and jth column by OBJECTNAME[i,j] In R I refer to the column name by OBJECTNAME$ColumnName while in Python I would use OBJECTNAME["ColumnName"] Note in Python Index starts with 0 while in R it starts with 1. Out[22]: Unnamed: 0 carat cut color clarity depth table price x y z 0 1 0.23 Ideal E SI2 61.5 55 326 3.95 3.98 2.43 1 2 0.21 Premium E SI1 59.8 61 326 3.89 3.84 2.31 2 3 0.23 Good E VS1 56.9 65 327 4.05 4.07 2.31 3 4 0.29 Premium I VS2 62.4 58 334 4.20 4.23 2.63 4 5 0.31 Good J SI2 63.3 58 335 4.34 4.35 2.75 5 6 0.24 Very Good J VVS2 62.8 57 336 3.94 3.96 2.48 6 7 0.24 Very Good I VVS1 62.3 57 336 3.95 3.98 2.47 7 8 0.26 Very Good H SI1 61.9 55 337 4.07 4.11 2.53 8 9 0.22 Fair E VS2 65.1 61 337 3.87 3.78 2.49 9 10 0.23 Very Good H VS1 59.4 61 338 4.00 4.05 2.39 diamonds.head(10) #we check the first 10 rows in the dataset
- 9. 1/22/2016 Tutorial in Python http://localhost:8888/notebooks/Dropbox/PYTHON%20BOOK%20WILEY/FINAL/Tutorial%20in%20Python.ipynb# 9/50 In [23]: Out[23]: carat cut color clarity depth table price x y z 0 0.23 Ideal E SI2 61.5 55 326 3.95 3.98 2.43 1 0.21 Premium E SI1 59.8 61 326 3.89 3.84 2.31 2 0.23 Good E VS1 56.9 65 327 4.05 4.07 2.31 3 0.29 Premium I VS2 62.4 58 334 4.20 4.23 2.63 4 0.31 Good J SI2 63.3 58 335 4.34 4.35 2.75 diamonds2=diamonds.drop('Unnamed: 0', 1) #Dropping a particular variable diamonds2.head()
- 10. 1/22/2016 Tutorial in Python http://localhost:8888/notebooks/Dropbox/PYTHON%20BOOK%20WILEY/FINAL/Tutorial%20in%20Python.ipynb# 10/50 In [24]: In [25]: Out[24]: Unnamed: 0 carat cut color clarity depth table price x y z 20 21 0.30 Good I SI2 63.3 56 351 4.26 4.30 2.71 21 22 0.23 Very Good E VS2 63.8 55 352 3.85 3.92 2.48 22 23 0.23 Very Good H VS1 61.0 57 353 3.94 3.96 2.41 23 24 0.31 Very Good J SI1 59.4 62 353 4.39 4.43 2.62 24 25 0.31 Very Good J SI1 58.1 62 353 4.44 4.47 2.59 25 26 0.23 Very Good G VVS2 60.4 58 354 3.97 4.01 2.41 26 27 0.24 Premium I VS1 62.5 57 355 3.97 3.94 2.47 27 28 0.30 Very Good J VS2 62.2 57 357 4.28 4.30 2.67 28 29 0.23 Very Good D VS2 60.5 61 357 3.96 3.97 2.40 29 30 0.23 Very Good F VS1 60.9 57 357 3.96 3.99 2.42 30 31 0.23 Very Good F VS1 60.0 57 402 4.00 4.03 2.41 Out[25]: 20 Good 21 Very Good 22 Very Good 23 Very Good 24 Very Good 25 Very Good Name: cut, dtype: object diamonds.ix[20:30] #refers to the 21st to 31st row #To refer to a particular column I use it's name # I can also chain the commands diamonds.ix[20:25].cut
- 11. 1/22/2016 Tutorial in Python http://localhost:8888/notebooks/Dropbox/PYTHON%20BOOK%20WILEY/FINAL/Tutorial%20in%20Python.ipynb# 11/50 In [26]: In [27]: Out[26]: 20 I 21 E 22 H 23 J 24 J 25 G Name: color, dtype: object Out[27]: color cut price 0 E Ideal 326 1 E Premium 326 2 E Good 327 3 I Premium 334 4 J Good 335 diamonds.ix[20:25]["color"] diamonds[['color','cut','price']].head() #Note the double square brackets [[]]
- 12. 1/22/2016 Tutorial in Python http://localhost:8888/notebooks/Dropbox/PYTHON%20BOOK%20WILEY/FINAL/Tutorial%20in%20Python.ipynb# 12/50 In [28]: Out[28]: color cut price 10 J Good 339 11 J Ideal 340 12 F Premium 342 13 J Ideal 344 14 E Premium 345 15 E Premium 345 16 I Ideal 348 17 J Good 351 18 J Good 351 19 J Very Good 351 20 I Good 351 diamonds.ix[10:20,['color','cut','price']] #Note how I placed the row index numbers and column names within the double SQUARE # This is more elaborate than R isnt it.
- 13. 1/22/2016 Tutorial in Python http://localhost:8888/notebooks/Dropbox/PYTHON%20BOOK%20WILEY/FINAL/Tutorial%20in%20Python.ipynb# 13/50 In [29]: Out[29]: Unnamed: 0 carat cut color clarity depth table price x y 23644 23645 3.65 Fair H I1 67.1 53 11668 9.53 9.48 24131 24132 3.24 Premium H I1 62.1 58 12300 9.44 9.40 24297 24298 3.22 Ideal I I1 62.6 55 12545 9.49 9.42 24328 24329 3.50 Ideal H I1 62.8 57 12587 9.65 9.59 25998 25999 4.01 Premium I I1 61.0 61 15223 10.14 10.10 25999 26000 4.01 Premium J I1 62.5 62 15223 10.02 9.94 26431 26432 3.40 Fair D I1 66.8 52 15964 9.42 9.34 26444 26445 4.00 Very Good I I1 63.3 58 15984 10.01 9.94 26534 26535 3.67 Premium I I1 62.4 56 16193 9.86 9.81 27130 27131 4.13 Fair H I1 64.8 61 17329 10.00 9.85 27415 27416 5.01 Fair J I1 65.5 59 18018 10.74 10.54 27630 27631 4.50 Fair J I1 65.8 58 18531 10.23 10.16 27679 27680 3.51 Premium J VS2 62.5 59 18701 9.66 9.63 #Lets try conditional selection diamonds[diamonds['carat']>3.2]
- 14. 1/22/2016 Tutorial in Python http://localhost:8888/notebooks/Dropbox/PYTHON%20BOOK%20WILEY/FINAL/Tutorial%20in%20Python.ipynb# 14/50 In [30]: In [31]: Random Sample Since Python does not have any package like dplyr, it needs numpy for more elaborate operations. Here we take a random sample of a Pandas data frame. In [32]: In [33]: Out[30]: Unnamed: 0 carat cut color clarity depth table price x y 21758 21759 3.11 Fair J I1 65.9 57 9823 9.15 9.02 25999 26000 4.01 Premium J I1 62.5 62 15223 10.02 9.94 26467 26468 3.01 Ideal J SI2 61.7 58 16037 9.25 9.20 26744 26745 3.01 Ideal J I1 65.4 60 16538 8.99 8.93 27415 27416 5.01 Fair J I1 65.5 59 18018 10.74 10.54 27630 27631 4.50 Fair J I1 65.8 58 18531 10.23 10.16 27679 27680 3.51 Premium J VS2 62.5 59 18701 9.66 9.63 27684 27685 3.01 Premium J SI2 60.7 59 18710 9.35 9.22 27685 27686 3.01 Premium J SI2 59.7 58 18710 9.41 9.32 Out[31]: (13791, 11) [34159 23971 31335 1895 28279] ##Lets try multiple conditions. We use the query command. diamonds.query('carat >3 and color =="J"') diamonds3=diamonds.query('price >28000 or cut =="Premium"') diamonds3.shape import numpy as np rows = np.random.choice(diamonds.index.values, round(0.0001*len(diamonds))) print(rows)
- 15. 1/22/2016 Tutorial in Python http://localhost:8888/notebooks/Dropbox/PYTHON%20BOOK%20WILEY/FINAL/Tutorial%20in%20Python.ipynb# 15/50 In [34]: In [35]: Summaries We now do summaries for numerical and categorical data. In [36]: Out[34]: Unnamed: 0 carat cut color clarity depth table price x y z 34159 34160 0.33 Ideal G VS1 62.1 55.0 854 4.46 4.43 2.76 23971 23972 1.51 Very Good H VS2 62.4 55.6 12108 7.28 7.33 4.56 31335 31336 0.41 Ideal G SI1 61.9 54.0 759 4.77 4.82 2.97 1895 1896 0.73 Ideal E VS2 62.7 56.0 3077 5.75 5.80 3.62 28279 28280 0.31 Premium J SI1 60.9 60.0 363 4.36 4.38 2.66 Out[36]: Unnamed: 0 carat depth table price x count 53940.000000 53940.000000 53940.000000 53940.000000 53940.000000 53940.000000 mean 26970.500000 0.797940 61.749405 57.457184 3932.799722 5.731157 std 15571.281097 0.474011 1.432621 2.234491 3989.439738 1.121761 min 1.000000 0.200000 43.000000 43.000000 326.000000 0.000000 25% 13485.750000 0.400000 61.000000 56.000000 950.000000 4.710000 50% 26970.500000 0.700000 61.800000 57.000000 2401.000000 5.700000 75% 40455.250000 1.040000 62.500000 59.000000 5324.250000 6.540000 max 53940.000000 5.010000 79.000000 95.000000 18823.000000 10.740000 diamonds.ix[rows] ##Missing Values diamonds= diamonds.dropna(how='any') diamonds.describe()
- 16. 1/22/2016 Tutorial in Python http://localhost:8888/notebooks/Dropbox/PYTHON%20BOOK%20WILEY/FINAL/Tutorial%20in%20Python.ipynb# 16/50 In [37]: In [38]: Out[37]: count 53940.000000 mean 3932.799722 std 3989.439738 min 326.000000 25% 950.000000 50% 2401.000000 75% 5324.250000 max 18823.000000 Name: price, dtype: float64 Out[38]: Unnamed: 0 carat depth table price x y Unnamed: 0 1.000000 0.377983 0.034800 0.100830 0.306873 0.405440 0.395843 carat 0.377983 1.000000 0.028224 0.181618 0.921591 0.975094 0.951722 depth 0.034800 0.028224 1.000000 0.295779 0.010647 0.025289 0.029341 table 0.100830 0.181618 0.295779 1.000000 0.127134 0.195344 0.183760 price 0.306873 0.921591 0.010647 0.127134 1.000000 0.884435 0.865421 x 0.405440 0.975094 0.025289 0.195344 0.884435 1.000000 0.974701 y 0.395843 0.951722 0.029341 0.183760 0.865421 0.974701 1.000000 z 0.399208 0.953387 0.094924 0.150929 0.861249 0.970772 0.952006 diamonds.price.describe() diamonds.corr() #Numerical Corelations
- 17. 1/22/2016 Tutorial in Python http://localhost:8888/notebooks/Dropbox/PYTHON%20BOOK%20WILEY/FINAL/Tutorial%20in%20Python.ipynb# 17/50 In [39]: In [40]: In [41]: In [42]: Out[39]: Unnamed: 0 carat depth table price x y z Unnamed: 0 True False False False False False False False carat False True False False True True True True depth False False True False False False False False table False False False True False False False False price False True False False True True True True x False True False False True True True True y False True False False True True True True z False True False False True True True True Out[40]: array(['SI2', 'SI1', 'VS1', 'VS2', 'VVS2', 'VVS1', 'I1', 'IF'], dtype=object) Out[41]: array(['Ideal', 'Premium', 'Good', 'Very Good', 'Fair'], dtype=o bject) Out[42]: Ideal 21551 Premium 13791 Very Good 12082 Good 4906 Fair 1610 Name: cut, dtype: int64 diamonds.corr()>0.5 # I use unique to get unique values. That is useful for categorical and character d diamonds['clarity'].unique() diamonds['cut'].unique() #to get the distribution across values of cateforical values I can use the value_co pd.value_counts(diamonds.cut)
- 18. 1/22/2016 Tutorial in Python http://localhost:8888/notebooks/Dropbox/PYTHON%20BOOK%20WILEY/FINAL/Tutorial%20in%20Python.ipynb# 18/50 In [43]: In [44]: In [45]: Out[43]: G 11292 E 9797 F 9542 H 8304 D 6775 I 5422 J 2808 Name: color, dtype: int64 Out[44]: color D E F G H I J cut Fair 163 224 312 314 303 175 119 Good 662 933 909 871 702 522 307 Ideal 2834 3903 3826 4884 3115 2093 896 Premium 1603 2337 2331 2924 2360 1428 808 Very Good 1513 2400 2164 2299 1824 1204 678 Out[45]: color D E F G H I J All cut Fair 163 224 312 314 303 175 119 1610 Good 662 933 909 871 702 522 307 4906 Ideal 2834 3903 3826 4884 3115 2093 896 21551 Premium 1603 2337 2331 2924 2360 1428 808 13791 Very Good 1513 2400 2164 2299 1824 1204 678 12082 All 6775 9797 9542 11292 8304 5422 2808 53940 pd.value_counts(diamonds.color) #the crosstab helps to make a crosstabulation. pd.crosstab(diamonds.cut,diamonds.color) #Adding margins =TRUE helps with the row and column totals in a cross tabulation pd.crosstab(diamonds.cut,diamonds.color,margins='TRUE')
- 19. 1/22/2016 Tutorial in Python http://localhost:8888/notebooks/Dropbox/PYTHON%20BOOK%20WILEY/FINAL/Tutorial%20in%20Python.ipynb# 19/50 In [46]: In [47]: In [48]: In [49]: Out[46]: color D E F G H I J All cut Fair 163 224 312 314 303 175 119 1610 Good 662 933 909 871 702 522 307 4906 Ideal 2834 3903 3826 4884 3115 2093 896 21551 Premium 1603 2337 2331 2924 2360 1428 808 13791 Very Good 1513 2400 2164 2299 1824 1204 678 12082 All 6775 9797 9542 11292 8304 5422 2808 53940 Out[48]: pandas.core.groupby.DataFrameGroupBy Out[49]: cut Fair 3282.0 Good 3050.5 Ideal 1810.0 Premium 3185.0 Very Good 2648.0 Name: price, dtype: float64 pd.crosstab(diamonds.cut,diamonds.color,margins='TRUE') #To do a groupby analysis we can use groupby command. This two step method is more cutgroup=pd.groupby(diamonds,diamonds.cut) type(cutgroup) cutgroup.price.median()
- 20. 1/22/2016 Tutorial in Python http://localhost:8888/notebooks/Dropbox/PYTHON%20BOOK%20WILEY/FINAL/Tutorial%20in%20Python.ipynb# 20/50 In [50]: In [51]: In [52]: Out[50]: cut price 0 Fair 3282.0 1 Good 3050.5 2 Ideal 1810.0 3 Premium 3185.0 4 Very Good 2648.0 Out[51]: 0 1 2 3 4 cut Fair Good Ideal Premium Very Good price 3282 3050.5 1810 3185 2648 Out[52]: <pandas.core.groupby.DataFrameGroupBy object at 0xaad3a36c> cutgroup.price.median().reset_index() d=cutgroup.price.median().reset_index() #transpose turns row values to columns d.transpose() # We can group by multiple columns diamonds.groupby(['cut', "color"])
- 21. 1/22/2016 Tutorial in Python http://localhost:8888/notebooks/Dropbox/PYTHON%20BOOK%20WILEY/FINAL/Tutorial%20in%20Python.ipynb# 21/50 In [53]: Out[53]: cut color price 0 Fair D 3730.0 1 Fair E 2956.0 2 Fair F 3035.0 3 Fair G 3057.0 4 Fair H 3816.0 5 Fair I 3246.0 6 Fair J 3302.0 7 Good D 2728.5 8 Good E 2420.0 9 Good F 2647.0 10 Good G 3340.0 11 Good H 3468.5 12 Good I 3639.5 13 Good J 3733.0 14 Ideal D 1576.0 15 Ideal E 1437.0 16 Ideal F 1775.0 17 Ideal G 1857.5 18 Ideal H 2278.0 19 Ideal I 2659.0 20 Ideal J 4096.0 21 Premium D 2009.0 22 Premium E 1928.0 23 Premium F 2841.0 24 Premium G 2745.0 25 Premium H 4511.0 26 Premium I 4640.0 27 Premium J 5063.0 28 Very Good D 2310.0 diamonds.groupby(['cut', "color"]).price.median().reset_index()
- 22. 1/22/2016 Tutorial in Python http://localhost:8888/notebooks/Dropbox/PYTHON%20BOOK%20WILEY/FINAL/Tutorial%20in%20Python.ipynb# 22/50 In [54]: In [55]: In [56]: Using SQL 29 Very Good E 1989.5 30 Very Good F 2471.0 31 Very Good G 2437.0 32 Very Good H 3734.0 33 Very Good I 3888.0 34 Very Good J 4113.0 Out[54]: color D E F G H I J cut Fair 3730.0 2956.0 3035 3057.0 3816.0 3246.0 3302 Good 2728.5 2420.0 2647 3340.0 3468.5 3639.5 3733 Ideal 1576.0 1437.0 1775 1857.5 2278.0 2659.0 4096 Premium 2009.0 1928.0 2841 2745.0 4511.0 4640.0 5063 Very Good 2310.0 1989.5 2471 2437.0 3734.0 3888.0 4113 Out[56]: color D E F G H I J cut Fair False False False False False False False Good False False False False False False False Ideal False False False False False False True Premium False False False False True True True Very Good False False False False False False True e=diamonds.groupby(['cut', "color"]).price.median().reset_index() e.pivot(index='cut', columns='color', values='price') #The pivot command further helps to look at the data into a pivot table format. f=e.pivot(index='cut', columns='color', values='price') f>4000
- 23. 1/22/2016 Tutorial in Python http://localhost:8888/notebooks/Dropbox/PYTHON%20BOOK%20WILEY/FINAL/Tutorial%20in%20Python.ipynb# 23/50 Python does have the pandasql package thanks to the lovely team at YHat ( who also made the Rodeo IDE) . It is simsilar to the sqldf package in R that is alloows the user to write sql queries to the data frame object In [57]: In [58]: In [59]: Out[58]: carat cut color clarity depth table price x y z 0 0.23 Ideal E SI2 61.5 55 326 3.95 3.98 2.43 1 0.21 Premium E SI1 59.8 61 326 3.89 3.84 2.31 2 0.23 Good E VS1 56.9 65 327 4.05 4.07 2.31 3 0.29 Premium I VS2 62.4 58 334 4.20 4.23 2.63 4 0.31 Good J SI2 63.3 58 335 4.34 4.35 2.75 5 0.24 Very Good J VVS2 62.8 57 336 3.94 3.96 2.48 6 0.24 Very Good I VVS1 62.3 57 336 3.95 3.98 2.47 7 0.26 Very Good H SI1 61.9 55 337 4.07 4.11 2.53 8 0.22 Fair E VS2 65.1 61 337 3.87 3.78 2.49 9 0.23 Very Good H VS1 59.4 61 338 4.00 4.05 2.39 Out[59]: carat cut color clarity depth table price x y z 0 4.01 Premium I I1 61.0 61 15223 10.14 10.10 6.17 1 4.01 Premium J I1 62.5 62 15223 10.02 9.94 6.24 2 4.13 Fair H I1 64.8 61 17329 10.00 9.85 6.43 3 5.01 Fair J I1 65.5 59 18018 10.74 10.54 6.98 4 4.50 Fair J I1 65.8 58 18531 10.23 10.16 6.72 from pandasql import sqldf pysqldf = lambda q: sqldf(q, globals()) pysqldf("SELECT * FROM diamonds2 LIMIT 10 ; ") #you can get an error if you have a column name within your Panda Data frame that i #Therefore we used the diamonds dataset but after dropping the first column #(i.e diamonds2=diamonds.drop('Unnamed: 0', 1) #Dropping a particular variable) pysqldf("SELECT * FROM diamonds2 WHERE carat >4 ;")
- 24. 1/22/2016 Tutorial in Python http://localhost:8888/notebooks/Dropbox/PYTHON%20BOOK%20WILEY/FINAL/Tutorial%20in%20Python.ipynb# 24/50 In [60]: In [61]: Out[60]: carat cut color clarity depth table price x y z 0 4.01 Premium J I1 62.5 62 15223 10.02 9.94 6.24 1 5.01 Fair J I1 65.5 59 18018 10.74 10.54 6.98 2 4.50 Fair J I1 65.8 58 18531 10.23 10.16 6.72 Out[61]: mean_price color 0 3169.954096 D 1 3076.752475 E 2 3724.886397 F 3 3999.135671 G 4 4486.669196 H 5 5091.874954 I 6 5323.818020 J pysqldf("SELECT * FROM diamonds2 WHERE color =='J' and carat>4 ;") pysqldf("SELECT AVG(price) AS mean_price,color FROM diamonds2 GROUP by color;"
- 25. 1/22/2016 Tutorial in Python http://localhost:8888/notebooks/Dropbox/PYTHON%20BOOK%20WILEY/FINAL/Tutorial%20in%20Python.ipynb# 25/50 In [62]: Out[62]: AVG(price) AVG(carat) cut clarity 0 3703.533333 1.361000 Fair I1 1 1912.333333 0.474444 Fair IF 2 4208.279412 0.964632 Fair SI1 3 5173.916309 1.203841 Fair SI2 4 4165.141176 0.879824 Fair VS1 5 4174.724138 0.885249 Fair VS2 6 3871.352941 0.664706 Fair VVS1 7 3349.768116 0.691594 Fair VVS2 8 3596.635417 1.203021 Good I1 9 4098.323944 0.616338 Good IF 10 3689.533333 0.830397 Good SI1 11 4580.260870 1.035227 Good SI2 12 3801.445988 0.757685 Good VS1 13 4262.236196 0.850787 Good VS2 14 2254.774194 0.502312 Good VVS1 15 3079.108392 0.614930 Good VVS2 16 4335.726027 1.222671 Ideal I1 17 2272.913366 0.455041 Ideal IF 18 3752.118169 0.801808 Ideal SI1 19 4755.952656 1.007925 Ideal SI2 20 3489.744497 0.674714 Ideal VS1 21 3284.550385 0.670566 Ideal VS2 22 2468.129458 0.495960 Ideal VVS1 23 3250.290100 0.586213 Ideal VVS2 24 3947.331707 1.287024 Premium I1 25 3856.143478 0.603478 Premium IF 26 4455.269371 0.908601 Premium SI1 27 5545.936928 1.144161 Premium SI2 pysqldf("SELECT AVG(price),AVG(carat),cut,clarity FROM diamonds2 GROUP by cut,clari
- 26. 1/22/2016 Tutorial in Python http://localhost:8888/notebooks/Dropbox/PYTHON%20BOOK%20WILEY/FINAL/Tutorial%20in%20Python.ipynb# 26/50 Data Visualization We are going to follow three main packages for Data Visualization in Python. They are matplotlib (standard basic data visualization package) seaborn ( advanced package for statistical graphs) ggplot ( a port by Yhat of the ggplot2 package in R created by Hadley Wickham) In [63]: In [64]: 28 4485.462041 0.793308 Premium VS1 29 4550.331248 0.833774 Premium VS2 30 2831.206169 0.534821 Premium VVS1 31 3795.122989 0.654724 Premium VVS2 32 4078.226190 1.281905 Very Good I1 33 4396.216418 0.618769 Very Good IF 34 3932.391049 0.845978 Very Good SI1 35 4988.688095 1.064338 Very Good SI2 36 3805.353239 0.733307 Very Good VS1 37 4215.759552 0.811181 Very Good VS2 38 2459.441065 0.494588 Very Good VVS1 39 3037.765182 0.566389 Very Good VVS2 /home/ajay/anaconda3/lib/python3.4/site-packages/matplotlib/__in it__.py:872: UserWarning: axes.color_cycle is deprecated and rep laced with axes.prop_cycle; please use the latter. warnings.warn(self.msg_depr % (key, alt_key)) import matplotlib.pyplot as plt %matplotlib inline pd.options.display.mpl_style = 'default' plt.style.use('ggplot') import seaborn as sns
- 27. 1/22/2016 Tutorial in Python http://localhost:8888/notebooks/Dropbox/PYTHON%20BOOK%20WILEY/FINAL/Tutorial%20in%20Python.ipynb# 27/50 In [65]: /home/ajay/anaconda3/lib/python3.4/site-packages/matplotlib/__in it__.py:892: UserWarning: axes.color_cycle is deprecated and rep laced with axes.prop_cycle; please use the latter. warnings.warn(self.msg_depr % (key, alt_key)) Out[65]: <seaborn.axisgrid.JointGrid at 0xa68163ac> sns.jointplot('price','carat',kind='hex',data=diamonds2)
- 28. 1/22/2016 Tutorial in Python http://localhost:8888/notebooks/Dropbox/PYTHON%20BOOK%20WILEY/FINAL/Tutorial%20in%20Python.ipynb# 28/50 In [66]: Out[66]: (array([ 25335., 9328., 7393., 3878., 2364., 1745., 1306., 1002., 863., 726.]), array([ 326. , 2175.7, 4025.4, 5875.1, 7724.8, 957 4.5, 11424.2, 13273.9, 15123.6, 16973.3, 18823. ]), <a list of 10 Patch objects>) plt.hist(diamonds.price)
- 29. 1/22/2016 Tutorial in Python http://localhost:8888/notebooks/Dropbox/PYTHON%20BOOK%20WILEY/FINAL/Tutorial%20in%20Python.ipynb# 29/50 In [74]: In [67]: Out[67]: <matplotlib.axes._subplots.AxesSubplot at 0xa3d3ecac> sns.distplot(diamonds.price, bins=20, kde=True, rug=False); plt.figure(); diamonds['price'].plot(kind='hist', stacked=True, bins=20)
- 30. 1/22/2016 Tutorial in Python http://localhost:8888/notebooks/Dropbox/PYTHON%20BOOK%20WILEY/FINAL/Tutorial%20in%20Python.ipynb# 30/50 In [68]: Out[68]: {'boxes': [<matplotlib.lines.Line2D at 0xa38c344c>], 'caps': [<matplotlib.lines.Line2D at 0xa38c08ac>, <matplotlib.lines.Line2D at 0xa38be38c>], 'fliers': [<matplotlib.lines.Line2D at 0xa38bb9ac>], 'means': [], 'medians': [<matplotlib.lines.Line2D at 0xa38bee8c>], 'whiskers': [<matplotlib.lines.Line2D at 0xa38c22cc>, <matplotlib.lines.Line2D at 0xa38c2d8c>]} plt.boxplot(diamonds.price)
- 31. 1/22/2016 Tutorial in Python http://localhost:8888/notebooks/Dropbox/PYTHON%20BOOK%20WILEY/FINAL/Tutorial%20in%20Python.ipynb# 31/50 In [69]: In [70]: Out[69]: <matplotlib.axes._subplots.AxesSubplot at 0xa3b2502c> Out[70]: <matplotlib.axes._subplots.AxesSubplot at 0xa38e8e2c> diamonds['price'].plot() plt.figure(); diamonds['price'].plot(kind='box')
- 32. 1/22/2016 Tutorial in Python http://localhost:8888/notebooks/Dropbox/PYTHON%20BOOK%20WILEY/FINAL/Tutorial%20in%20Python.ipynb# 32/50 In [72]: In [ ]: /home/ajay/anaconda3/lib/python3.4/site-packages/matplotlib/__in it__.py:892: UserWarning: axes.color_cycle is deprecated and rep laced with axes.prop_cycle; please use the latter. warnings.warn(self.msg_depr % (key, alt_key)) ax = sns.boxplot(x="color", y="price", data=diamonds) diamonds.plot(kind='hexbin', x='price', y='carat', gridsize=8)
- 33. 1/22/2016 Tutorial in Python http://localhost:8888/notebooks/Dropbox/PYTHON%20BOOK%20WILEY/FINAL/Tutorial%20in%20Python.ipynb# 33/50 In [76]: Out[76]: <matplotlib.axes._subplots.AxesSubplot at 0x96d078cc> sns.kdeplot(diamonds['price'],shade= True)
- 34. 1/22/2016 Tutorial in Python http://localhost:8888/notebooks/Dropbox/PYTHON%20BOOK%20WILEY/FINAL/Tutorial%20in%20Python.ipynb# 34/50 In [75]: In [77]: /home/ajay/anaconda3/lib/python3.4/site-packages/matplotlib/__in it__.py:892: UserWarning: axes.color_cycle is deprecated and rep laced with axes.prop_cycle; please use the latter. warnings.warn(self.msg_depr % (key, alt_key)) Out[75]: <seaborn.axisgrid.JointGrid at 0x9717fd8c> sns.jointplot('price','carat',data=diamonds2) from ggplot import *
- 35. 1/22/2016 Tutorial in Python http://localhost:8888/notebooks/Dropbox/PYTHON%20BOOK%20WILEY/FINAL/Tutorial%20in%20Python.ipynb# 35/50 In [78]: /home/ajay/anaconda3/lib/python3.4/site-packages/matplotlib/__in it__.py:872: UserWarning: axes.color_cycle is deprecated and rep laced with axes.prop_cycle; please use the latter. warnings.warn(self.msg_depr % (key, alt_key)) Out[78]: <ggplot: (-917530690)> p = ggplot(aes(x='price', y='carat',color="clarity"), data=diamonds) p + geom_point()
- 36. 1/22/2016 Tutorial in Python http://localhost:8888/notebooks/Dropbox/PYTHON%20BOOK%20WILEY/FINAL/Tutorial%20in%20Python.ipynb# 36/50 In [79]: Modeling Lets do some basic Regression Modeling In [80]: In [81]: In [82]: /home/ajay/anaconda3/lib/python3.4/site-packages/matplotlib/__in it__.py:872: UserWarning: axes.color_cycle is deprecated and rep laced with axes.prop_cycle; please use the latter. warnings.warn(self.msg_depr % (key, alt_key)) Out[79]: <ggplot: (-917530742)> p = ggplot(aes(x='price', y='carat',color="cut"), data=diamonds) p + geom_point() import statsmodels.formula.api as sm boston=pd.read_csv("http://vincentarelbundock.github.io/Rdatasets/csv/MASS/Boston.c
- 37. 1/22/2016 Tutorial in Python http://localhost:8888/notebooks/Dropbox/PYTHON%20BOOK%20WILEY/FINAL/Tutorial%20in%20Python.ipynb# 37/50 In [83]: In [84]: Out[83]: crim zn indus chas nox rm age dis rad tax ptratio black lstat 0 0.00632 18 2.31 0 0.538 6.575 65.2 4.0900 1 296 15.3 396.90 4.98 1 0.02731 0 7.07 0 0.469 6.421 78.9 4.9671 2 242 17.8 396.90 9.14 2 0.02729 0 7.07 0 0.469 7.185 61.1 4.9671 2 242 17.8 392.83 4.03 3 0.03237 0 2.18 0 0.458 6.998 45.8 6.0622 3 222 18.7 394.63 2.94 4 0.06905 0 2.18 0 0.458 7.147 54.2 6.0622 3 222 18.7 396.90 5.33 Out[84]: crim zn indus chas nox rm age crim 1.000000 0.200469 0.406583 0.055892 0.420972 0.219247 0.352734 zn 0.200469 1.000000 0.533828 0.042697 0.516604 0.311991 0.569537 indus 0.406583 0.533828 1.000000 0.062938 0.763651 0.391676 0.644779 chas 0.055892 0.042697 0.062938 1.000000 0.091203 0.091251 0.086518 nox 0.420972 0.516604 0.763651 0.091203 1.000000 0.302188 0.731470 rm 0.219247 0.311991 0.391676 0.091251 0.302188 1.000000 0.240265 age 0.352734 0.569537 0.644779 0.086518 0.731470 0.240265 1.000000 dis 0.379670 0.664408 0.708027 0.099176 0.769230 0.205246 0.747881 rad 0.625505 0.311948 0.595129 0.007368 0.611441 0.209847 0.456022 tax 0.582764 0.314563 0.720760 0.035587 0.668023 0.292048 0.506456 ptratio 0.289946 0.391679 0.383248 0.121515 0.188933 0.355501 0.261515 black 0.385064 0.175520 0.356977 0.048788 0.380051 0.128069 0.273534 lstat 0.455621 0.412995 0.603800 0.053929 0.590879 0.613808 0.602339 medv 0.388305 0.360445 0.483725 0.175260 0.427321 0.695360 0.376955 boston =boston.drop('Unnamed: 0', 1) boston.head() boston.corr()
- 38. 1/22/2016 Tutorial in Python http://localhost:8888/notebooks/Dropbox/PYTHON%20BOOK%20WILEY/FINAL/Tutorial%20in%20Python.ipynb# 38/50 In [85]: In [86]: Out[85]: crim zn indus chas nox rm age dis rad tax ptratio crim True False False False False False False False False False False zn False True False False False False False False False False False indus False False True False True False False False False False False chas False False False True False False False False False False False nox False False True False True False False False False False False rm False False False False False True False False False False False age False False False False False False True False False False False dis False False False False False False False True False False False rad False False False False False False False False True True False tax False False False False False False False False True True False ptratio False False False False False False False False False False True black False False False False False False False False False False False lstat False False False False False False False False False False False medv False False False False False False False False False False False Out[86]: crim -0.388305 zn 0.360445 indus -0.483725 chas 0.175260 nox -0.427321 rm 0.695360 age -0.376955 dis 0.249929 rad -0.381626 tax -0.468536 ptratio -0.507787 black 0.333461 lstat -0.737663 medv 1.000000 Name: medv, dtype: float64 boston.corr()>0.75 boston.corr().medv
- 39. 1/22/2016 Tutorial in Python http://localhost:8888/notebooks/Dropbox/PYTHON%20BOOK%20WILEY/FINAL/Tutorial%20in%20Python.ipynb# 39/50 In [87]: Out[87]: OLS Regression Results Dep. Variable: medv Rsquared: 0.631 Model: OLS Adj. Rsquared: 0.626 Method: Least Squares Fstatistic: 142.0 Date: Fri, 22 Jan 2016 Prob (Fstatistic): 1.49e104 Time: 13:22:42 LogLikelihood: 1588.2 No. Observations: 506 AIC: 3190. Df Residuals: 499 BIC: 3220. Df Model: 6 Covariance Type: nonrobust coef std err t P>|t| [95.0% Conf. Int.] Intercept 0.3594 4.863 0.074 0.941 9.915 9.196 crim 0.0991 0.034 2.890 0.004 0.167 0.032 zn 0.0064 0.014 0.470 0.638 0.033 0.020 nox 10.8653 2.865 3.793 0.000 16.494 5.237 ptratio 1.0519 0.135 7.796 0.000 1.317 0.787 black 0.0137 0.003 4.453 0.000 0.008 0.020 rm 6.9796 0.396 17.612 0.000 6.201 7.758 Omnibus: 298.859 DurbinWatson: 0.808 Prob(Omnibus): 0.000 JarqueBera (JB): 3305.426 Skew: 2.385 Prob(JB): 0.00 Kurtosis: 14.577 Cond. No. 7.66e+03 import statsmodels.formula.api as sm result = sm.ols(formula="medv ~ crim + zn + nox + ptratio + black + rm ", data result.summary()
- 40. 1/22/2016 Tutorial in Python http://localhost:8888/notebooks/Dropbox/PYTHON%20BOOK%20WILEY/FINAL/Tutorial%20in%20Python.ipynb# 40/50 In [88]: Out[88]: Intercept -0.359432 crim -0.099122 zn -0.006364 nox -10.865295 ptratio -1.051937 black 0.013737 rm 6.979587 dtype: float64 result.params
- 41. 1/22/2016 Tutorial in Python http://localhost:8888/notebooks/Dropbox/PYTHON%20BOOK%20WILEY/FINAL/Tutorial%20in%20Python.ipynb# 41/50 In [89]: Out[89]: ['HC0_se', 'HC1_se', 'HC2_se', 'HC3_se', '_HCCM', '__class__', '__delattr__', '__dict__', '__dir__', '__doc__', '__eq__', '__format__', '__ge__', '__getattribute__', '__gt__', '__hash__', '__init__', '__le__', '__lt__', '__module__', '__ne__', '__new__', '__reduce__', '__reduce_ex__', '__repr__', '__setattr__', '__sizeof__', '__str__', '__subclasshook__', '__weakref__', '_cache', '_data_attr', '_get_robustcov_results', '_is_nested', '_wexog_singular_values', 'aic', 'bic', 'bse', 'centered_tss', 'compare_f_test', 'compare_lm_test', 'compare_lr_test', 'condition_number', 'conf_int', 'conf_int_el', 'cov_HC0', 'cov_HC1', 'cov_HC2', 'cov_HC3', 'cov_kwds', 'cov_params', dir(result)
- 42. 1/22/2016 Tutorial in Python http://localhost:8888/notebooks/Dropbox/PYTHON%20BOOK%20WILEY/FINAL/Tutorial%20in%20Python.ipynb# 42/50 In [90]: In [91]: 'cov_type', 'df_model', 'df_resid', 'diagn', 'eigenvals', 'el_test', 'ess', 'f_pvalue', 'f_test', 'fittedvalues', 'fvalue', 'get_influence', 'get_robustcov_results', 'initialize', 'k_constant', 'llf', 'load', 'model', 'mse_model', 'mse_resid', 'mse_total', 'nobs', 'normalized_cov_params', 'outlier_test', 'params', 'predict', 'pvalues', 'remove_data', 'resid', 'resid_pearson', 'rsquared', 'rsquared_adj', 'save', 'scale', 'ssr', 'summary', 'summary2', 't_test', 'tvalues', 'uncentered_tss', 'use_t', 'wald_test', 'wresid'] Out[90]: <bound method OLSResults.outlier_test of <statsmodels.regressio n.linear_model.OLSResults object at 0x961745cc>> result.outlier_test
- 43. 1/22/2016 Tutorial in Python http://localhost:8888/notebooks/Dropbox/PYTHON%20BOOK%20WILEY/FINAL/Tutorial%20in%20Python.ipynb# 43/50 In [92]: In [93]: In [94]: Decision Trees Out[92]: ['__call__', '__class__', '__delattr__', '__dir__', '__doc__', '__eq__', '__format__', '__func__', '__ge__', '__get__', '__getattribute__', '__gt__', '__hash__', '__init__', '__le__', '__lt__', '__ne__', '__new__', '__reduce__', '__reduce_ex__', '__repr__', '__self__', '__setattr__', '__sizeof__', '__str__', '__subclasshook__'] student_resid unadj_p bonf(p) 365 5.130997 4.137329e-07 2.093488e-04 367 4.458162 1.022270e-05 5.172687e-03 368 7.350666 8.147884e-13 4.122829e-10 369 4.972797 9.097632e-07 4.603402e-04 370 4.510890 8.060499e-06 4.078612e-03 371 5.691137 2.156804e-08 1.091343e-05 372 6.272833 7.704855e-10 3.898656e-07 a=result.outlier_test dir(a) def outlierTest(x): outl=x.outlier_test() print (outl.loc[outl['bonf(p)'] != 1]) outlierTest(result)
- 44. 1/22/2016 Tutorial in Python http://localhost:8888/notebooks/Dropbox/PYTHON%20BOOK%20WILEY/FINAL/Tutorial%20in%20Python.ipynb# 44/50 pydot is Graphviz’s dot language Python interface.This module provides with a full interface to create handle modify and process graphs in Graphviz’s dot language. In [95]: In [96]: In [97]: In [98]: The directory '/home/ajay/.cache/pip/http' or its parent directo ry is not owned by the current user and the cache has been disab led. Please check the permissions and owner of that directory. I f executing pip with sudo, you may want sudo's -H flag. You are using pip version 7.1.0, however version 8.0.2 is availa ble. You should consider upgrading via the 'pip install --upgrade pi p' command. The directory '/home/ajay/.cache/pip/http' or its parent directo ry is not owned by the current user and the cache has been disab led. Please check the permissions and owner of that directory. I f executing pip with sudo, you may want sudo's -H flag. Requirement already satisfied (use --upgrade to upgrade): pydot in /usr/local/lib/python2.7/dist-packages Requirement already satisfied (use --upgrade to upgrade): pypars ing in /usr/lib/python2.7/dist-packages (from pydot) Requirement already satisfied (use --upgrade to upgrade): setupt ools in /usr/local/lib/python2.7/dist-packages/setuptools-1 8.6.1-py2.7.egg (from pydot) from sklearn import tree from sklearn.externals.six import StringIO ! sudo pip install pydot #pydot import pydot weather=pd.read_csv('https://raw.githubusercontent.com/decisionstats/pythonfordatas weather=weather.drop('Unnamed: 0', 1)
- 45. 1/22/2016 Tutorial in Python http://localhost:8888/notebooks/Dropbox/PYTHON%20BOOK%20WILEY/FINAL/Tutorial%20in%20Python.ipynb# 45/50 In [110]: For DecisionTrees to work we need to convert the categorical variables to integer variables. To do this we'll create an encoding function as below. <class 'pandas.core.frame.DataFrame'> Int64Index: 366 entries, 0 to 365 Data columns (total 24 columns): Date 366 non-null object Location 366 non-null object MinTemp 366 non-null float64 MaxTemp 366 non-null float64 Rainfall 366 non-null float64 Evaporation 366 non-null float64 Sunshine 363 non-null float64 WindGustDir 363 non-null object WindGustSpeed 364 non-null float64 WindDir9am 335 non-null object WindDir3pm 365 non-null object WindSpeed9am 359 non-null float64 WindSpeed3pm 366 non-null int64 Humidity9am 366 non-null int64 Humidity3pm 366 non-null int64 Pressure9am 366 non-null float64 Pressure3pm 366 non-null float64 Cloud9am 366 non-null int64 Cloud3pm 366 non-null int64 Temp9am 366 non-null float64 Temp3pm 366 non-null float64 RainToday 366 non-null object RISK_MM 366 non-null float64 RainTomorrow 366 non-null object dtypes: float64(12), int64(5), object(7) memory usage: 61.5+ KB weather.info()
- 46. 1/22/2016 Tutorial in Python http://localhost:8888/notebooks/Dropbox/PYTHON%20BOOK%20WILEY/FINAL/Tutorial%20in%20Python.ipynb# 46/50 In [100]: In [101]: In [102]: In [103]: In [104]: ['MaxTemp', 'Rainfall', 'Evaporation', 'WindGustDir', 'WindDir9a m', 'WindDir3pm', 'WindSpeed3pm', 'Humidity9am', 'Humidity3pm', 'Pressure9am', 'Pressure3pm', 'Cloud9am', 'Cloud3pm', 'Temp9am', 'Temp3pm', 'RainToday'] def encode_target(df, target_columns): """Add column to df with integers for the target. Args ---- df -- pandas DataFrame. target_column -- column to map to int, producing new Target column. Returns ------- df_mod -- modified DataFrame. targets -- list of target names. """ df_mod = df.copy() for target_column in target_columns: targets = df_mod[target_column].unique() map_to_int = {name: n for n, name in enumerate(targets)} df_mod[target_column] = df_mod[target_column].replace(map_to_int) return df_mod weather_new=encode_target(weather,["RainToday","Location","WindGustDir","WindDir9am features= list(weather_new.columns[3:]) features.remove("RISK_MM") target=features.pop() y = weather_new[target] X = weather_new[features] good_columns = X._get_numeric_data().dropna(axis=1) features= list(good_columns.columns) print (features)
- 47. 1/22/2016 Tutorial in Python http://localhost:8888/notebooks/Dropbox/PYTHON%20BOOK%20WILEY/FINAL/Tutorial%20in%20Python.ipynb# 47/50 In [105]: In [106]: In [111]: Out[111]: DecisionTreeClassifier(class_weight=None, criterion='gini', ma x_depth=None, max_features=None, max_leaf_nodes=None, min_sample s_leaf=1, min_samples_split=20, min_weight_fraction_leaf=0.0, random_state=99, splitter='best') dt = tree.DecisionTreeClassifier(min_samples_split=20, random_state=99) dt=dt.fit(good_columns, y) tree.export_graphviz(dt,out_file="tree.dot") dt
- 48. 1/22/2016 Tutorial in Python http://localhost:8888/notebooks/Dropbox/PYTHON%20BOOK%20WILEY/FINAL/Tutorial%20in%20Python.ipynb# 48/50 In [112]: Out[112]: ['__abstractmethods__', '__class__', '__delattr__', '__dict__', '__dir__', '__doc__', '__eq__', '__format__', '__ge__', '__getattribute__', '__gt__', '__hash__', '__init__', '__le__', '__lt__', '__module__', '__ne__', '__new__', '__reduce__', '__reduce_ex__', '__repr__', '__setattr__', '__sizeof__', '__str__', '__subclasshook__', '__weakref__', '_abc_cache', '_abc_negative_cache', '_abc_negative_cache_version', '_abc_registry', '_get_param_names', 'class_weight', 'classes_', 'criterion', 'feature_importances_', 'fit', 'fit_transform', 'get_params', 'max_depth', 'max_features', 'max_features_', 'max_leaf_nodes', 'min_samples_leaf', 'min_samples_split', 'min_weight_fraction_leaf', 'n_classes_', 'n_features_', 'n_outputs_', 'predict', 'predict_log_proba', 'predict_proba', dir(dt)
- 49. 1/22/2016 Tutorial in Python http://localhost:8888/notebooks/Dropbox/PYTHON%20BOOK%20WILEY/FINAL/Tutorial%20in%20Python.ipynb# 49/50 In [116]: In [107]: In [121]: In [108]: In [109]: In [117]: In [120]: In [ ]: 'random_state', 'score', 'set_params', 'splitter', 'transform', 'tree_'] Out[116]: <bound method DecisionTreeClassifier.score of DecisionTreeClassi fier(class_weight=None, criterion='gini', max_depth=None, max_features=None, max_leaf_nodes=None, min_sample s_leaf=1, min_samples_split=20, min_weight_fraction_leaf=0.0, random_state=99, splitter='best')> Out[108]: '/home/ajay/Desktop/test' Out[109]: ['tree.dot', 'adult.data.txt'] dt.score import os as os #import pydot os.getcwd() os.listdir(os.getcwd()) #from IPython.display import Image #dot_data = StringIO() #graph = pydot.graph_from_dot_data(tree.dot.getvalue()) #You can use Pydot from Python 2, or use Graphviz for reading the dot file
- 50. 1/22/2016 Tutorial in Python http://localhost:8888/notebooks/Dropbox/PYTHON%20BOOK%20WILEY/FINAL/Tutorial%20in%20Python.ipynb# 50/50