Break Even Charts - a simple explanation
•
1 j'aime•1,250 vues

The document discusses break-even point (BEP) charts and concepts. It explains that a BEP chart has three lines: fixed costs, total costs, and sales. The point where the total costs and sales lines intersect is the break-even point, where total revenue equals total costs and there are no profits or losses. Lowering fixed costs or increasing sales can lower the break-even point, which is better for businesses as it requires less output to start generating profits.

Recommandé
Contenu connexe
Similaire à Break Even Charts - a simple explanation
Similaire à Break Even Charts - a simple explanation (16)
Plus de Mohd Farid Awang
Plus de Mohd Farid Awang (19)
Dernier
Dernier (20)
Break Even Charts - a simple explanation
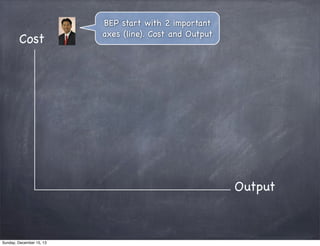
- 1. Cost BEP start with 2 important axes (line). Cost and Output Output Watch the movie on BEP Charts at : http://www.youtube.com/watch?v=B_Nepzytv8c Sunday, December 15, 13
- 2. Cost Next, is the COST line. The most important line is the Total Fixed Cost (FC) line. You need to calculate and identify your FC. Pls be precise as u can. Fixed Cost Output Sunday, December 15, 13
- 3. Cost FC line is a straight line. Why? because how much the output u made, the FC will not change = increase@decrease. Fixed Cost Output Sunday, December 15, 13
- 4. Cost Sample = Output 1000units : FC RM100 Output 500units : FC RM100 Output 2000units : FC RM100 Fixed Cost Output Sunday, December 15, 13
- 5. Cost Next is, Total Cost line. (FC + Variable Cost). The TC line will move upward because it is a cumulative cost for every unit of output. Fixed Cost Output Sunday, December 15, 13
- 6. Cost Next is, Total Cost line. (FC + Variable Cost). The TC line will move upward because it is a cumulative cost for every unit of output. ost lC ota T Fixed Cost Output Sunday, December 15, 13
- 7. Cost As mention before, FC is static, so why Total Cost is keeps increasing? The answer is : The Variable Cost (VC) of each outputs is not static ost lC ota T Fixed Cost Output Sunday, December 15, 13
- 8. Cost Sample = Output 100units : VC RM100 Output 50units : VC RM25 Output 200units : VC RM200 ost lC ota T Fixed Cost Output Sunday, December 15, 13
- 9. Cost Now, lets see where is FC and VC located. ost lC ota T Fixed Cost Output Sunday, December 15, 13
- 10. Cost Now, lets see where is FC and VC located. ost lC ota T Variable Cost Fixed Cost Output Sunday, December 15, 13
- 11. Cost Now, lets see where is FC and VC located. ost lC ota T Variable Cost Fixed Cost Fixed Cost Output Sunday, December 15, 13
- 12. Cost Next, Lets draw Sales line. It is cumulative amount, therefore the line will always be uptrend. Start with zero (0) value. The degree of sales line will depend on sales ost lC ota T Fixed Cost Output Sunday, December 15, 13
- 13. Cost Next, Lets draw Sales line. It is cumulative amount, therefore the line will always be uptrend. Start with zero (0) value. The degree of sales line will depend on sales s le a ost S lC ota T Fixed Cost Output Sunday, December 15, 13
- 14. Cost We can see three the basic Now we have all (3) saleslocate the BEP point. Line to condition Then, where is BEP? es al S ost lC ota T Fixed Cost Output Sunday, December 15, 13
- 15. Cost We can see three the basic Now we have all (3) saleslocate the BEP point. Line to condition Then, where is BEP? Sales at BEP es al S ost lC ota T The POINT where Sales Line met/cross with Total Cost Line MEANS that TOTAL SALES is Equal to TOTAL COST = NO PROFIT is generated Fixed Cost Output Sunday, December 15, 13
- 16. Cost We can see three (3) sales condition Sales at BEP Sales ABOVE Total Cost Sales at PROFIT es al S ost lC ota T Sales at LOSS Sales BELOW Total Cost The POINT where Sales Line met/cross with Total Cost Line MEANS that TOTAL SALES is Equal to TOTAL COST = NO PROFIT is generated Fixed Cost Output Sunday, December 15, 13
- 17. Sales ABOVE Total Cost Cost Sales at PROFIT Sales at BEP es al S ost lC ota T Sales at LOSS Sales BELOW Total Cost The POINT where Sales Line met/cross with Total Cost Line MEANS that TOTAL SALES is Equal to TOTAL COST = NO PROFIT is generated Fixed Cost Output Based on the above BEP charts, now u can easily see and verify either your SALEs is good or bad. I believe all businessman want to make profit not vice versa. The minimum sales off coz will be at BEP point. Sunday, December 15, 13
- 18. Now, we can say that the lower BEP is the better for the company. Sales at BEP es al S ost lC ota T Fixed Cost Sunday, December 15, 13
- 19. How to lower our BEP? firstly, we can reduce our FC which will reduce the Total Cost. Sales at BEP es al S ost lC ota T Fixed Cost Sunday, December 15, 13
- 20. Or we can increase the sales. Off coz its need correct strategies and approaches es al S ost lC ota T Sales at BEP Fixed Cost Sunday, December 15, 13
- 21. Cost Thats all from me. Tq for watching. Pls email to aku5299@gmail.com for any info Sales at BEP Sales ABOVE Total Cost Sales at PROFIT es al S ost lC ota T Sales at LOSS Sales BELOW Total Cost The POINT where Sales Line met/cross with Total Cost Line MEANS that TOTAL SALES is Equal to TOTAL COST = NO PROFIT is generated Fixed Cost Output Watch the movie on BEP Charts at : http://www.youtube.com/watch?v=B_Nepzytv8c Sunday, December 15, 13