URALCHEM, OJSC, one of the largest producers of nitrogen fertilizers in Russia, announced its unaudited IFRS financial results for the first six months of 2014.
VIP Call Girl in Mumbai Central 💧 9920725232 ( Call Me ) Get A New Crush Ever...
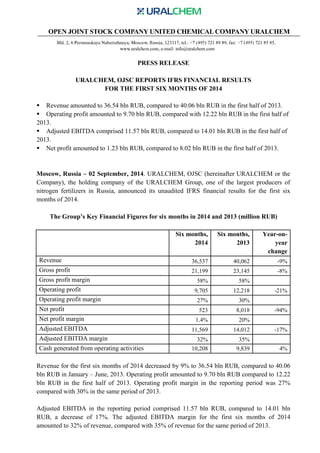
URALCHEM, OJSC REPORTS IFRS FINANCIAL RESULTS FOR THE FIRST SIX MONTHS OF 2014
1. PRESS RELEASE
URALCHEM, OJSC REPORTS IFRS FINANCIAL RESULTS
FOR THE FIRST SIX MONTHS OF 2014
Revenue amounted to 36.54 bln RUB, compared to 40.06 bln RUB in the first half of 2013.
Operating profit amounted to 9.70 bln RUB, compared with 12.22 bln RUB in the first half of
2013.
Adjusted EBITDA comprised 11.57 bln RUB, compared to 14.01 bln RUB in the first half of
2013.
Net profit amounted to 1.23 bln RUB, compared to 8.02 bln RUB in the first half of 2013.
Moscow, Russia – 02 September, 2014. URALCHEM, OJSC (hereinafter URALCHEM or the
Company), the holding company of the URALCHEM Group, one of the largest producers of
nitrogen fertilizers in Russia, announced its unaudited IFRS financial results for the first six
months of 2014.
The Group’s Key Financial Figures for six months in 2014 and 2013 (million RUB)
Six months,
2014
Six months,
2013
Year-on-year
change
Revenue 36,537 40,062 -9%
Gross profit 21,199 23,145 -8%
Gross profit margin 58% 58%
Operating profit 9,705 12,218 -21%
Operating profit margin 27% 30%
Net profit 523 8,018 -94%
Net profit margin 1.4% 20%
Adjusted EBITDA 11,569 14,012 -17%
Adjusted EBITDA margin 32% 35%
Cash generated from operating activities 10,208 9,839 4%
Revenue for the first six months of 2014 decreased by 9% to 36.54 bln RUB, compared to 40.06
bln RUB in January – June, 2013. Operating profit amounted to 9.70 bln RUB compared to 12.22
bln RUB in the first half of 2013. Operating profit margin in the reporting period was 27%
compared with 30% in the same period of 2013.
Adjusted EBITDA in the reporting period comprised 11.57 bln RUB, compared to 14.01 bln
RUB, a decrease of 17%. The adjusted EBITDA margin for the first six months of 2014
amounted to 32% of revenue, compared with 35% of revenue for the same period of 2013.
2. The decrease in net profit and operating profit is connected with the Company’s expenses on its
debt service and the sharp rise in the foreign exchange rate in the first quarter of 2014. It is also
due to the forced shut down of the Voskresensk Mineral Fertilizers enterprise. In early 2014 the
plant had to go into forced downtime caused by the absence of the main raw material for the
production of phosphate fertilizers, apatite concentrate.
Despite the difficult situation for the producers of mineral fertilizers market in 2014,
URALCHEM is showing the sustainability of its business model and feels comfortable in the
unfavourable conditions. The company continues to upgrade production facilities, and to develop
its distribution network, as well as to increase its logistics capacity.
Markets
In January, activity on the ammonia markets remained low. Quotes on the basis of FOB Yuzhny
Port remained in the area of $410 to $430/tonne. In February, prices for ammonia in the ports of
the CIS began to rise; this continued until mid-April, when quotes exceeded $500/tonne.
However, in May there began a decline related to the decrease in demand from the United States
as well as to the shut down of production of caprolactam and acrylonitrile in Asia. The average
price for ammonia in the first half of 2014 amounted to $462/tonne, which is 13.2% lower than in
the first six months of 2013.
In January urea prices reached a peak growth of $350 - $360 per tonne FOB Baltic due to the
high activity in the USA, Europe and Brazil markets. In late January - early February, prices
started to decline due to the devaluation of the national currency of Turkey and Brazil, making it
difficult to import. The decline continued in March, when expectations of imports in South Asia
were not fulfilled. In the first half of April, prices continued to decline due to the lack of spot
demand. Mid-April marked stabilization of the prices was associated with the beginning of the
end users’ product procurement and product purchases by traders for delivery execution. From the
beginning to the middle of May prices went down due to lack of current demand. The second half
of May marked recovery in prices associated with large procurement orders in Brazil and China
for the delivery of the product to the United States. In June, prices stabilized and even showed a
slight increase due to the limited supply from Egypt, Ukraine and Libya. The average price for six
months of this year amounted to $311/tonne FOB Baltic, compared with $361/tonne in the same
period last year.
During January and February, there was steady growth of quotations for ammonium nitrate due
to the lack of product available for export, caused by the supplies to the domestic market of the
CIS countries: FOB Baltic quotes grew from $300/tonne up to $320/tonne. But from the
beginning of March, quotations began to decline amid weakening demand in the domestic
markets of the CIS countries and growing volumes of available products. In May, the market
reached the “bottom”: prices dropped to 245 to 250 $/tonne, FOB Baltic / Black Sea. Since early
June, prices stabilized and even grew slightly stronger thanks to the return to the market of
3. Brazilian buyers, as well as to the suspension of production at the plants of the Ostchem holding
(Ukraine).
In the segment of phosphate fertilizers (MAP / DAP) average quotations (FOB Black Sea) for
the first quarter of 2014 amounted to $469/tonne, which is 6% lower than a year earlier. Since
mid-March, the activity of the demand in this segment declined markedly; importers, relying on
high inventories postponed new purchases in anticipation of more lucrative offers. In the first
months of the second quarter, prices continued to decline, but in June there began a steep rise -
distributors in the United States, Russia and China sent large volumes to the domestic markets,
providing a higher yield. By the end of the first half of 2014, quotes almost reached the peak
values of $500/tonne registered in March.
Production and sales
Thanks to the modernization of production facilities and effective marketing policy in the first
half of 2014, the Company was able to increase production and sales of key products, ammonium
nitrate and its derivatives. The main reason for the decline in the performance of some other
segments is the shut down of the Voskresensk Mineral Fertilizers enterprise.
Sales figures of the Group for the six months in 2014 and 2013 (thousand tonnes):
Name of product Six months, 2014 Six months, 2013 Year-on-year change
Ammonium nitrate and its
derivatives
Urea 609 607 0%
Ammonia 362 358 1%
NPK fertilizers 248 320 -23%
Phosphate fertilizers 51 262 -80%
Other chemicals 77 196 -60%
Total 2,854 3,075 -7%
Financial Situation
1,507 1,332 13%
Cash generated from operating activities in the first half of 2014 amounted to 10.21 bln RUB,
compared to 9.84 bln RUB in the same period last year. As at 30 June 2014, the Company’s net
debt amounted to 151.28 bln RUB.
***
For more information, please visit the Company web site www.uralchem.com or use the following
contact information:
4. Public Relations Department
URALCHEM, OJSC
tel: +7 (495) 721 89 89
pr@uralchem.com
URALCHEM, OJSC is the holding company of the URALCHEM Group including four
plants manufacturing fertilizers in Russia. The Group is one of the largest producers of
nitrogen and phosphate fertilizers in Russia and the CIS with production capacities of over
2.5 million tonnes of ammonium nitrate, 2.8 million tonnes of ammonia, 0.8 million tonnes
of phosphate and compound fertilizers and 1.2 million tonnes of urea and per year. The
URALCHEM Group ranks second in the world and first in Russia for the production of
ammonium nitrate. It is second in Russia for the production of nitrate fertilizers. Key
production assets of URALCHEM include Azot Branch of URALCHEM, OJSC in
Berezniki, Perm Region; OJSC Minudobrenia, Perm; MFP Kirovo-Chepetsk Chemical
Works, OJSC Branch in Kirovo-Chepetsk, Kirov region; Voskresensk Mineral Fertilisers,
OJSC in Voskresensk, Moscow region.
Some of the information in this press release may contain projections or other forward-looking
statements regarding future events or the future financial performance of URALCHEM. We wish
to caution you that these statements are only predictions. We do not intend to update these
statements and our actual results may differ materially from those contained in our projections or
forward-looking statements, including, among others, the achievement of anticipated levels of
profitability, growth, cost and synergy of our recent acquisitions, the impact of competitive
pricing, the ability to obtain necessary regulatory approvals and licenses, the impact of
developments in the Russian economic, political and legal environment, financial risk
management and the impact of general business and global economic conditions.
Annex to the press release about the financial results for the first half of 2014
EBITDA is a profit / loss from financial and economic activities during the reporting period, before deduction of
income tax on profits, income and interest costs, depreciation and amortization. "Adjusted EBITDA" is EBITDA for
the reporting period before goodwill, profit / loss from associates, profit / loss on foreign exchange differences arising
on financial performance and profit / loss on operations with derivative financial instruments. Adjusted EBITDA is
operating profit before depreciation and amortization and financial results of operations with derivative financial
instruments. In accordance with International Financial Reporting Standards ("IFRS"), depreciation and amortization
are included in cost structure, and in the selling, general and administrative expenses. IFRS does not require the
disclosure and does not describe the calculation of EBITDA and adjusted EBITDA, among other financial indicators,
so they can not substitute for net profit for the period when evaluating the results of operations or the measure of cash
provided by operating activities when evaluating liquidity. Approach to the calculation of EBITDA and adjusted
EBITDA, as described earlier, may not coincide with the approaches used by other companies, therefore,
comparability may be limited. We believe that EBITDA and adjusted EBITDA provide useful information to
investors because they are indicators of the stability and efficiency of our business and our ability to fund
discretionary spending such as capital expenditures, the acquisition of subsidiaries and other investments, as well as
indicators of our ability to incur and service debt. IFRS classifies depreciation and amortization to operating costs,
while in fact they are distributed to the current period non-cash expenses for the acquisition or creation of fixed
assets, incurred in previous periods, and are not affiliated with the movement of funds.
5. Calculation of EBITDA for the first six month of year 2014 and year 2013 (thousand RUB)
Six months,
2014
Six months,
2013
Net profit 522,812 8,017,826
Add:
Income tax 1,488,314 1,531,809
Interest and other financial income (25,083) (465,110)
Interest and other financial costs 3,922,072 1,290,413
Amortisation 1,864,295 1,794,365
Share of (gain)/loss of associates (231,147) 788
Foreign exchange loss from financing activities 4,011,770 1,841,788
Loss on impairment of fixed assets 15,983 -
Adjusted EBITDA 11,569,016 14,011,879