3. Purpose
• One of the goals of VIVO is to show which
organizations faculty, staff, and students
belong to.
• UF's academic structure is highly complex
and does not correspond to its financial
structure.
• UF does not have a facility to create
organizational charts. Most organization
charts are created by hand.
4. Original Uses
• Demonstrate how to work with VIVO's linked
data
• Create org charts automatically for each
institution
• Create poster sized drawings for marketing
purposes
6. Art vs Science
• More than 60% of my time on the project
has been spent drawing graphs.
• Over 100 graphs have been created.
• Drawing graphs with 500+ nodes and
including labels is extremely difficult.
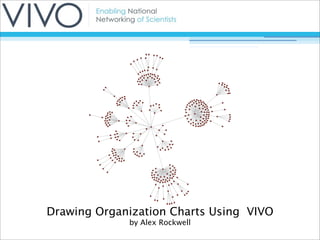
7. First Graph
• Extends several feet in both directions
• This first result was so bad I nearly scrapped
the whole project...
12. Immediate Impact
• The original picture generated substantial
interest in the program.
• Showed that writing interesting 3rd party
applications on the VIVO platform is
possible.
• Many problems including missing,
misplaced, and duplicated data have been
uncovered by the crawler.
13. Finding all UF organizations
• Over 100 external organizations were added
to VIVO during CV entry of the showcase
departments.
• SPARQL cannot do recursive queries, so we
did not have a tool to automatically find all
sub-organizations of UF.
• Extended the ontology locally with a
rootOrganization data property to mark
organizations as children of UF.
14. Finding Data Problems
• Looking at graphs generated by the program
has uncovered many problems in our data,
including missing, misplaced, and
duplicated records.
• We can understand the organizational
structure much faster by looking at the
graph rather than manually following the
links from one organization to another.
15. Extending to People
• Plan to show the relationship between
people and their affiliations with
departments, centers and institutes.
• Need to import data to show the heads of
departments.
• Finding the right representation will be
challenging because UF's VVIO will include
close to 30,000 people by the end of the
grant.
16. Interactive Graph Demo
• Demo available at http://qa.vivo.ufl.edu/
infovis/demo.html
• Created with JavaScript InfoVis Toolkit
(http://thejit.org)
17. Contact Information
• Alex Rockwell (alexhr@ufl.edu)
• Source code available at
github.com/arockwell/vivo_org_chart