1. Naimi and Golias 1
1
2
An innovative approach to solve the network design problem concerning intelligent3
vulnerabilities4
5
6
7
8
9
10
11
12
13
14
15
16
17
18
19
20
21
22
23
24
25
26
27
28
29
30
Word Count:31
Number of Tables: 132
Number of Figures: 733
Total Count: = 5,750+ (7 x 250) = 750034
Date Submitted:35
36
37
38
Submitted for Peer Review and for Compendium of Papers CD-ROM at the Annual Meeting of39
the Transportation Research Board (TRB) in January 2016, and for Publication in the Journal of40
TRB41
42
2. Naimi and Golias 2
1. ABSTRACT1
In today’s congested transportation networks, disturbances like crashes may cause unexpected2
and significant delays. All transportation networks are vulnerable to disruptions, to some extent,3
with temporary or permanent effects. Vulnerability is more important in urban transportation4
networks, due to heavy use and road segments that are close to each other. Small disturbances on5
an urban transportation network segment can have a huge impact on its accessibility. Intelligent6
adversaries may take advantage of these vulnerable parts of the network in order to disrupt the7
transportation operations, and increase the overall transportation cost for the users.8
Often, the decision of improving the networks in transportation planning and management tasks9
are made without adequately taking into account the possible vulnerabilities. By considering the10
factor of vulnerability in their decision, planners could prevent severe unforeseen disruptions in11
the future. Robustness is defined as the extent to which, a network under disturbances is able to12
maintain its function for which it was initially designed. This study proposes an innovative13
model for designing robust networks against intelligent attackers. In the model, three decision14
makers are considered: the network manager/designer, the adversary (intelligent attacker) and the15
users of the network.16
3. Naimi and Golias 3
2. INTRODUCTION AND LITERATURE REVIEW1
Design of robust networks are the attention of many researchers. However, until now there is not2
a universally accepted definition for the vulnerability of networks (Snelder, n.d.). Robustness is3
the opposite of vulnerability. Therefore, a network that is vulnerable is not robust and vice versa.4
The main contribution of this paper is a new methodology for designing robust networks5
strategically, by considering an intelligent adversary entity, who attempts to exploit the6
vulnerabilities of the network to the maximum of his or her capabilities. The most appropriate7
way to model the vulnerabilities as a result of intelligent disruptions, could be to model them as a8
player in a game that tries to achieve his or her objective(s). Some of the studies focused on9
operational network design. However, the strategic network design against vulnerabilities needs10
to be further studied. In addition, despite the works that have been done to design robust11
networks against stochastic vulnerability, this approach could provide new ways to analyze the12
vulnerabilities in networks in a higher level of detail.13
Since three decision makers are considered in this study, the possible associated models and14
objectives are reviewed. First, a brief introduction to the game theory is provided followed by a15
review of the network design problem (NDP). From a design point of view, the designer may16
have multiple objectives when improving the performance of a network such as total system17
cost, robustness against reliability and vulnerability, reduction of pollution emission, and18
multiyear investments. On the other hand, from a user perspective, they look for their optimal19
route choice, mode, and destination. From an adversary view point, the objective is to degrade20
the performance of network to the maximum of his capabilities. Hence, a design for a robust21
network must consider the alleviation of potential disruptions.22
Finding the optimal road design has been the subject of transportation studies for a long23
while, and is known to be one of the most complicated problems in transportation. A large24
number of formulations and solution algorithms have been presented over the last 50 years to25
solve complex mathematical programs (Chiou, 2005a; Leblanc, 1973; Murray et al., 1998;26
Suwansirikul et al., 1987).27
Network design problems are usually modeled as multi-level models. Multilevel28
programming, which has received significant attention during the last few decades, is a branch of29
mathematical programming that can be viewed as either a generalization of minimization-30
maximization problems or as a particular class of Stackelberg games with continuous variables.31
The network design problem with continuous decision variables, representing link capacities, can32
be cast into such a framework. Marcotte (Marcotte, 1986) gives a formal description of the33
problem and then develops various suboptimal procedures to solve it. Gradient based methods34
were used (Chiou, 2005b) to solve a continuous network design problem in a transportation35
network where Wardrop’s first principle was used for traffic assignment. Bi-level optimization36
problems have shown that they are non-convex and difficult to solve using exact optimization37
algorithms (Konur, Golias, & Darks, c2013) (Golias et al., 2013; Konur & Golias, 2013).38
Further research has been done to find more efficient heuristic algorithms, which may give39
near optimal solutions or local optimum solutions (Allsop, 1974; Steenbrink, 1974). Methods40
like equilibrium decomposed optimization EDO (Suwansirikul et al., 1987), which are41
computationally efficient but result in suboptimal solutions and not suitable for large real42
networks problems. Gershwin et. al. (Gershwin et al., 1979) formulated the continuous network43
design problem (CNDP) as a constrained optimization problem in which the constrained set was44
expressed in terms of the path flows and performed their method on small networks. Marquis45
(Marcotte and Marquis, 1992; Marcotte and Zhu, 1996; Marcotte, 1983) presented heuristics for46
4. Naimi and Golias 4
CNDP on the basis of system optimal approach and obtained good numerical results. However,1
these heuristics have not been extensively tested on large-scale networks generally.2
3
2.1. Vulnerability indicators4
The availability and quality of alternative routes is a very important indicator of vulnerability.5
The availability of spare capacity (capacity minus the flow) also could be an important indicator6
of vulnerability. Other examples could be v/c ratio, number of OD-pairs that use a link, number7
of vehicles affected by spillback (the spare capacity can be used to bypass an incident), extra8
vehicle kilometers travelled as a result of link closure, travel time losses as a result of crashes.9
Snelder et al. (Snelder, n.d.) presented a topological vulnerability indicator. In her model, if10
(a) is the link where the disruption occurs, and (a)’ is (a) link from the collection A of links that11
form an alternative for link (a), the vulnerability index is comprised from the ratio of capacity12
(a), over the summation of capacities of (a)’, multiplied by a function of shortest path between a13
and (a)’, and importance of the distance. The links that cross a line perpendicular to (a), are14
considered to be an alternative for link (a), if they meet the following requirements: The absolute15
angle between the original link and the alternative link must be smaller than 60 degrees.16
Robust network design is focused on the reduction of the impact of disruptions in terms of17
reliability, vulnerability and potentially resilience if the analysis over time is to be considered.18
Disruptions can be in the trip rates of demand matrix, travel times, capacity, availability, traffic19
signals, and even change in direction of a link. A network is more robust, if it can withstand20
unexpected disruptions.21
Dziubinski and Goyal (Dziubiński and Goyal, 2013) studied various games between a22
designer and an adversary. The designer tries to form a network consisting of n links, which are23
costly to construct, and also protect a set of them. The adversary, on the other hand, tries to24
damage the network to the maximum of its capabilities. Perfect and imperfect information in25
different scenarios is assumed to be available to the designer. The difference is considered as the26
knowledge of the designer of the possible moves of adversary, which depends on their payoffs.27
Their main finding was with limited available resources, the best defense would be in sparse28
networks, rather than centralized.29
Murray-Tuite and Mahmassani (Murray-Tuite and Mahmassani, 2004) studied four types of30
games between a transportation operation manager of a network, and an adversary entity who31
tries to damage the network, using bi-level formulation. In their method, for each link a, the32
summation of vulnerability indices of all O/Ds with respect to link a, is considered as the33
vulnerability index of link a. This value is based on the utility of alternative routes, considering34
the current flow, and ratio of flow over demand. The utility in their paper is based on the ratio of35
free flow travel time over marginal travel time, and the relative capacity. Its value ranges from 036
to 1, where 1 indicates that the link is extremely important to the connectivity of that O/D.37
Martin and Thesis (Martin and Thesis, 2007) studied various types of network design against38
attacks, and developed a tri-level defender attacker defender model to design a robust network,39
which in the inner model, the defender tries to minimize the users’ costs. The proposed40
framework assumes that the defender at the outer level uses limited defensive resources to41
protect a system from attacks. At the middle level, the attacker uses their limited resources to42
attack the unprotected components while at the inner level the defender operates the system to43
minimize operating costs from damage (resulting from the attacker).44
45
3. METHODOLOGY AND MODEL FORMULATION46
5. Naimi and Golias 5
As mentioned before, consideration of the vulnerabilities of networks against intelligent1
disruptions is crucial to alleviate the consequences of such events. The vulnerability can be2
evaluated by measuring the increase in the total system travel time1
. This way, the damage due to3
the disturbance are viewed over the whole system.4
To formulate the models, the sets, parameters, and variables are defined in Table 1. The5
notations are similar to model and graph representations in (Urban transportation networks, n.d.),6
and are adopted for the proposed models.7
8
Table 1: Notations9
Sets and Indices:10
Set of links
Set of Nodes
Set of origin nodes;
Set of destination nodes;
The complete set of available paths connecting (O/D) pairs in
the network
Demand between each Origin-Destination (O/D) pair
shortest path for O/D pair
Number of O/D pairs in the network
Parameters:11
Constant, varying by facility type (BPR function)
Constant, varying by facility type (BPR function)
Free flow path travel time for link (hr)
The capacity of each lane (veh/hr/ln)
MP A multiplier constant number to give high cost for vehicles for using the target link
Total budget/resources available to the designer
Total budget/resources available to the adversary
The capacity for link
The number of lanes in link
length for link
Variables:12
( ) improvement cost function for link
Flow dependent link travel time on link (hr)
Flow on path k, connecting each origin-destination (O-D) pair
if route between OD pair contains link , and equal to 0 otherwise
Total link flow (vph) on link
Integer decision variable; total number of lanes to be added/expanded to link
Binary decision variable; 1 if link is disabled, and 0 if it is not
13
14
The model can be better understood using game theory concepts. Game theory provides15
mathematical tools for analyzing situations in which parties, called players, make independent16
1
Total System Travel Time
6. Naimi and Golias 6
decisions. A game is defined as a finite game when each player has a finite number of options,1
the number of players is finite, and the game cannot go on indefinitely. It can be defined as the2
study of mathematical models of conflict and cooperation between intelligent rational decision3
makers. A solution to a game is the optimal decisions of the players, who may have similar,4
conflicting or mixed interest and the outcomes that may results from these decisions.5
The problem and the solutions could be viewed from the aspect of three main players6
involved: the designer of the network, the users of it, and adversary entity. Frameworks can be7
defined based on one or more of these players. The usage of any of these frameworks differs by8
the involved players, order of moves and etc.9
10
4. MODEL FORMULATION11
Concentrating on reducing the effects of potential disruptions to the network, may distract the12
investments from definite reduction of the total system cost under normal conditions, and to13
invest on infrastructures that might never be beneficial (if no disruptions occur in future). Hence,14
an intellectual approach would be considering both aspects of reducing the system wide cost, and15
the potential vulnerabilities simultaneously. The aim of the designer/defender is to invest on16
projects such that the social welfare and robustness of the network are maximized17
simultaneously. The methodology presents a bi-objective formulation for the road network18
planner to model the cooperation of the goals.19
The first move is completed by the designer of the network who has the advantage of putting20
his decision in place, and observing the reaction of the other players. The designer decision is21
defined by vector . The value of shows the amount of expanding the capacity of link . In22
this research, is the number of lanes to be added to link . In the proposed model, it is23
assumed that the adversary entity finds the maximum possible damage to the network. His24
decision in the model is defined as vector . The value of shows the state to which link25
is damged and not available to the users; otherwise, the link is not affected. The damage is26
evaluated as the increase in the total system travel time. After the decisions of the designer and27
the adversary were made, the users of the network complete the next move. The reaction of the28
users is modeled using user equilibrium principles. The bi-level formulation models the29
relationship between the network manipulated by designer and adversary at the upper level, and30
the users at the lower level problem.31
At designer level, the objective is to minimize the vulnerability of the network, by investing32
the available budget/resources in the expansion of the current capacity of links, by adding new33
lanes. Therefore, the designer makes his decision by adding new lanes to the network,34
considering his budget as a constraint. Then, the model examines the maximum damage that an35
adversary can inflict on the network, by incapacitating the links. Again, the model considers the36
limitation on adversary’s available resources/budget. The value of the payoff can be considered37
as the TSTT. Therefore, the adversary can look for the damage which results in the maximum38
possible travel time of users of the system.39
The general formulation for this model is presented in equations (1) through (5).40
( ( ) ) (
1)
( ( ( )) ( )) (
7. Naimi and Golias 7
2)
s.t. ( ( ) ) (
3)
( ) (
4)
s.t. ( ) (
5)
1
In which ( ) is the solution to the problem in equations (3) and (5); likewise ( ) and2
( ) are the solutions to the problems and in equations (4) and (5) respectively.3
Statements (1) and (2) form a bi-objective problem, which tries to reduce the total system cost of4
the network at normal condition (before attack) and at degraded condition (after attack). The5
model formulation is written in equations (6) through (24).6
L1
∑ ( ) (6)
∑ ́ ́ ( ́ ) (7)
∑ ( ) (8)
( ) , (9)
(10)
∑ ∫ ( ) (11)
s.t. ( ) [ (( )
) ] (12)
∑ (13)
∑ ∑ (14)
(15)
(16)
L3
∑ ́ ́ ( ́ ) (17)
́ ́ ∑ ∫ ́ ( ) (18)
́ ( ́ ) [ (
́
( )
) ] ( ) (19)
∑ ́ ́ (20)
́ ∑ ∑ ́ ́ (21)
́ (22)
́ (23)
8. Naimi and Golias 8
∑ (24)
́ ( ́ ) [ (
́
( )
) ] ( ) (25)
∑ ́ ́ (26)
́ ∑ ∑ ́ ́ (27)
1
The defender/designer of the network not only minimizes the overall cost to users, similar to2
the conventional urban network design problems, but also they attempt to reduce the potential3
effect of any intelligent adversary movements. The decision of the designer, implicitly affects the4
behavior of the users, and the potential moves of the adversary entity. Therefore, the hierarchy of5
decision flow, starts from the designer at level L1. There are two players in the next sequence of6
the hierarchy structure of decision makers, L2, a user player for the normal condition of the7
network, and an adversary. The network modified by the adversary, provides data for the last8
player in the hierarchy sequence of decisions, L3. Hence, the network defender has two9
objectives, the minimization of a performance measure like total system travel cost, and also at10
the same time the minimization of vulnerabilities. This behavior was represented in the user level11
which is based on Wardrop’s first principle, saying that no user can experience a lower travel12
time by unilaterally changing his/her routes. Thus, the road users desire to separately select their13
routes such that their individual travel costs are minimized while the planners look for the best14
link improvements within the network but have no control over the users’ route choices. Similar15
rules apply to adversary-user interactions.16
In equations (6) through (24), two separate user equilibrium problems are defined. The first17
one is in the second level of optimization, which provides information regarding the flow in an18
undamaged network. The second one is at the third level, which feeds the adversary problem19
with information about the degraded network. The variables for the second user equilibrium20
problem is differentiated using the apostrophe after the variables’ letters. The nonlinear21
programming model for the first user equilibrium problem is provided in equations (11) through22
(16). Equation (11) denotes the objective function of the UE problem. Constraint (13) describes23
the demand conservation condition. That is to say, all trips should be assigned to the network.24
The flow on all routes between each OD pair, has to be equal to the OD trip rate. Constraint (14)25
outlines the relation between flows on links and route(s), for each OD. The binary value of26
is 1, when link is on the path , and it is zero otherwise. Constraint (15) and (16) satisfies the27
non-negativity of path flow and travel demand correspondingly, so the solutions are physically28
meaningful. Similarly, the second user equilibrium are presented in equations (18) through (23).29
Constraint (8) represents the total available budget for network capacity improvements.30
Similarly, Constraint (24) shows the limitation on the number of elements that adversary entity31
can damage.32
34
5. SOLUTION ALGORITHM35
Three optimization tasks should be addressed for the three players in the model. The designer36
of the network should search over the best possible solutions for the design of the network while37
the adversary should move after the designer and search to find the most crucial links of the38
network to be degraded or completely disabled. And the last move is done by the users of the39
network who individually search for the best route for themselves in terms of the least travel40
time.41
9. Naimi and Golias 9
The overall flowchart of the solution algorithms for the three decision makers is presented in1
Figure 1. It should be noted that to keep the diagram simple, the convergence criteria for user2
level problems is not demonstrated in this figure.3
Figure 1 Flowchart of the Solution Approach4
5
The algorithms that have been used for each level are discussed in the following sections.6
7
5.1. Algorithm for Users8
Since the user level problem is a nonlinear derivable convex problem, it can be solved using9
efficient heuristic algorithms like the Frank Wolfe algorithm (FW), algorithm B, gradient descent10
and other gradient based algorithms. The Frank Wolfe algorithm is also known as reduced11
gradient and convex combination algorithm. The model formulation is provided in equations12
(11) through (16).. The Frank Wolfe heuristic search algorithm is used for convergence of the13
objective function to its optimal value using the associated direction vector’s move size. The14
objective function is the sum of the integrals of the link performance functions. The steps of the15
Frank Wolfe algorithm are as follows:16
17
Step 0: Initialization18
Perform all-or-nothing assignment based on ta = ta( ) . A new flow vector {xa} will be19
generated. Set counter .20
21
Step 1: Update22
Start
End
Converged?
User Level
User Equilibrium
Traffic Assignment
Investment Function
Convergence Criteria
OD Matrix
Network Data
Designer Level
Minimize TSTT
Minimize Vulnerabilities
Adversary Level
Maximize Damage
( )
Yes
𝑥( ( ))
𝑥( ( ))
𝑧(𝑥 𝑦)
Yes
Converged?
No
Alternative User Level w/o
Disruptions
User Equilibrium
Traffic Assignment
Link Capacity
Flows
Cost of Construction
𝑧(𝑥 𝑦) ,
𝑥( )
𝑥́( )
𝑥́( )
10. Naimi and Golias 10
Set ta = ta(xa)1
2
Step 2: Finding Direction3
Perform all-or-nothing assignment based on {ta}. A new auxiliary flow vector {x’a} will be4
generated.5
6
Step 3: Line search7
Find αn ( ) that solves equation (28):8
9
( ) ∑ ∫ ( )
( ) (28)
10
The line search problem is solved using bisection algorithm (Bolzano search). The converge11
criteria for the bisection method is defined as the distance between the lower bound and upper12
bound of the current section in bisection iterations.13
14
Step 4: Move15
Move to the new solution using equation (29).16
( ) (29)
17
Step 5: Convergence test18
If the convergence criterion is met, stop and accept the current solution { }, as the set of19
equilibrium link flows. If the convergence criterion is not met, set and go to step 1.20
The convergence is tested using equation (30):21
√∑ ( )
∑
(30)
22
The Frank Wolfe algorithm is relatively simple to implement and has a fast convergence in23
the first iterations. Since the update step is “one-at-a-time” generically, it is not parallelizable for24
better computational performance.25
26
5.2. Algorithm for Designer/Defender and Adversary27
In this research, decisions of the designer and adversary are considered to be discrete. In28
addition, since their objectives are nonlinear and non-convex, they fall into the category of NP29
hard problems. Therefore, efficient exact and heuristic solutions do not exist, and approximate30
algorithms like meta-heuristic algorithms would be the best approach for medium and large scale31
sizes of these types of problems. Meta-heuristics are a subfield of stochastic optimization that32
combine basic heuristic methods in higher level frameworks, and their goal is to search33
effectively and efficiently. They are especially suited for problems with imperfect or incomplete34
information or limited computation capacity. One of the population based meta-heuristics is the35
category of evolutionary computations’ (EC) algorithms; and one of the best known and efficient36
categories of EC’s algorithms is the genetic algorithm (GA). A genetic algorithm is a search37
heuristic that mimics the procedure of natural selection. The GA works by evolving a population38
of candidate solutions, also known as individuals or phenotypes, toward better solutions. Each39
candidate solution has a set of properties which is its chromosome or also known as genotype. Its40
11. Naimi and Golias 11
process routinely produces a new population by mutating and altering the current population.1
Each population, called a generation, contains the candidate solutions.2
The problem size can vary based on the number of the links in the network, number of the3
lanes, number of nodes, and improvement approaches. A genetic algorithm is specially suited to4
deal with multi-objective problems. The chromosomal representation for the designer and5
adversary is described in the next section. The problem of the upper level can be defined as a6
multi-objective problem. In a multi-objective problem, more than one objective is optimized at7
the same time. A good solution approach would be combining the objectives of the designer and8
adversary into a monotonic objective function which has the set of variables of both which can9
be solved using a GA.10
The designer’s objective function result will be a trial additional number of lanes vector ( ).11
The designer’s decision variables are limited by the budget and resources constraints. The12
decisions of the designer and adversary modifies the network, and passes it to the next player in13
the defined sequence of decision flow. The pseudo code of the algorithm is presented briefly as14
follows:15
16
Step 0: Initialization. Create initial random population of organisms (potential solution)17
18
Step 1: Evaluate. Evaluate fitness of each organism/chromosome19
For the adversary, the fitness value is based on running traffic assignment on the degraded20
network, defined by the individual adversary solutions.21
For the designer, the fitness value is based on the new design of network defined by the22
individual designer solutions, which might be degraded by the adversary as a median player.23
Step 2: Convergence criterion. If the fitness for all evaluated organisms is considered as a24
good solution, then the procedure is finished. Otherwise go to step 3.25
26
Step 3: Exploit. Eliminate the weak organisms and produce new organisms based on27
individuals in the population with better fitness.28
29
Step 4: Explore. Stochastically mutate organisms’ genes. Then repeat the process starting at30
step 1.31
32
33
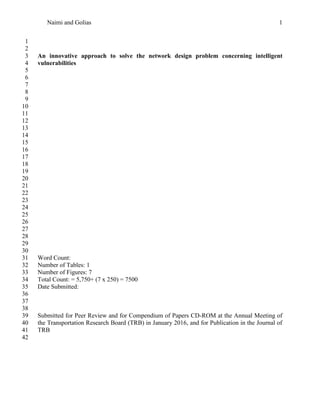
5.3. Decoding and Chromosomal Representation34
Decoding is about representing the genotypes in a real phenotype feasible space. Each35
individual variable when encoded into genotype, is converted to the real representation value of36
the objective function. So the output of the decoding function, makes the suitable variables for37
inserting to the objective function(s). A computationally efficient representation for38
chromosomes, is a one dimensional series of binary variables. A simple example of decoding a39
binary representation of the chromosomes for the designer and adversary, using 3 bits of data, for40
3 links is presented in Figure 2.41
12. Naimi and Golias 12
1
In the defined encoding/decoding procedure, the actual genome in a genetic algorithm2
process is first converted into a real representation value ranging from 0 to 1.0. This3
representation value can be used as a general form that can be scaled to any desired boundary4
defined by the specific problem. Depending on the boundaries defined by the specific problem,5
the real representation value can scale the output of a genetic algorithm to the size of decision6
variables of the problem. The decision maker should be aware of the boundaries of the decision7
variables of their problem. So they can be confident that the genetic algorithm progress would8
not miss any solutions because of not being able to touch all the feasible space of the problem. In9
the above example, each variable is encoded into 3 bits of data. So, the scale of genotype of each10
variable is ranging from 0 to 1. The boundaries of the phenotype variables in the actual problem11
0 1 0 0 0 1 1 1 1 0 1 1
y0 y1 y2 y3
Genotype Scale = 3 bits = [0, 7] decimals ↓
2/7 = 0.2857 1/7 = 0.1429 7/7 = 1.0000 3/7 = 0.4286
y0 y1 y2 y3
LB = 0, UB = 3 Boundary Range = 3 – 0 = 3 ↓
0.2857 × 3 = 0.85 0.1429 × 3 = 0.43 1.0 × 3 = 3.00 0.4286 × 300 = 1.29
y0 y1 y2 y3
a) Designer
0 1 0 0 0
z0 z1 z2 z3 z4
1 0 0 1 0
z0 z1 z2 z3 z4
b) adversary entity
Figure 2 Decoding procedure and genotype chromosome representation
13. Naimi and Golias 13
are defined by the feasible space of the problem. In this case, each non-negative variable has a1
maximum value of 3 as their upper-level value. This value in the next step, is used to scale the2
genotype value range to the actual feasible space range. If the required decoded variable is3
discrete, the decoded value can be rounded to the closest integer value. The constraint of the4
adversary entity, which is the number of links that can be affected by its problem, can5
implemented in the decoding/encoding procedure.6
In this approach, the alleles with binary value one in the corresponding chromosomes,7
represent the attacked links. The upper bound of the adversary budget constraint, is defined by8
the summation or equivalently the total number of 1s in the corresponding chromosomes. To9
have the problem feasible, in the solution algorithms the mutation operators should be avoided.10
The moves in the genotype space can be performed by cross-over operators.11
To test the algorithm, and perform sensitivity analysis on the properties of the genetic12
algorithm, bi-level network design problems were defined for two small test networks. The13
network configurations is described in the next sections. The objective functions in network14
design problems are usually minimization. Therefore a ranked based roulette is a good approach15
for the selection. The population size for the both problems is 100 individuals.16
17
6. NUMERICAL EXPERIMENTS18
Numerical experiments were conducted in order to evaluate the performance of the method19
and observe the results. The designer and adversary level algorithm were coded and solved using20
MATLAB, and the user level algorithm was implemented in C++. The method was processed on21
a computer with an Intel i7-960 processor and 24GB of RAM.22
Numerical experiments are conducted for the Sioux Falls in order to evaluate the proposed23
methodology. The network consists of 76 links, and 24 nodes which are also defined as the24
demand origin/destinations. It is assumed that all the links in the initial network have three lanes.25
The links attributes and OD trips were adopted from (Suwansirikul et al., 1987). Similar to test26
network 1, two scenarios were performed on this network using different budgets available to the27
adversary.28
Figure 3 demonstrates the 14 candidate links that are selected for improvements (Link29
numbers 13, 23, 30, 51, 27, 32, 34, 40, 49, 52, 53, 58, 39 and 74).30
14. Naimi and Golias 14
1
2
6.1. Adversary budget = 13
For the first experiment, the attacker upper bound was limited to 1 link. The three level4
algorithm was used to solve this problem. The designer level problem is a bi-objective problem5
of minimizing the total system travel time, and the total system travel time of the damaged6
network, which is obtained by solving the attacker problem in the second level of the model.7
The designer decision is limited by the construction budget which is available to them. In this8
experiment, the budget is assumed to be 20 million dollars. Their decision of adding lanes to the9
current links is also constrained by an upper bound of a maximum of 3 lanes per link.10
For the designer and attacker problem, a population size of 100 individuals/chromosomes is11
considered. For both problems, in the optimization process, 100 of generations were populated12
by the individuals in each iteration. In this example, the optimal solution found was adding one13
lane to link 23, 34, 39, 40, 49, 53, 58, and adding two lanes to links 13, 27, 32, 51, 52, 74 and14
adding three lanes to link 30.15
The final decision of the designer is represented in Figure 5. The optimal decision of the16
adversary entity under the initial network is attacking link 43, while its target changes to link 2517
in the improved network conditions. The numbers on links shows the total number of lanes to be18
added to the links. The initial total system travel time under normal conditions is reduced from19
7.48×10⁶
minute to 5.98×10⁶
minutes in the improved network. Considering the degraded20
network after the attack, the total system travel time is 7.80×10⁶
. This value is comparable to the21
value for the initial network after attack which is 10.89×10⁶
. Figure 4 presents the changes in the22
total system travel time after the improvement. The additional system cost due to the attacks are23
Figure 3 Links Included in Expansion (links with green color) for the Sioux Falls
network
15. Naimi and Golias 15
represented by red stacks over the network under normal condition, which represented by blue1
bars. The addition of the new lanes to the network, could reduce the total system travel time by2
20.1 percent. However, the improvement by the proposed model is more significant by looking3
at vulnerability aspects. The new improved network could reduce the imposed additional system4
cost from 3.41×10⁶
minutes to 1.82×10⁶
, which is 46.4 percent.5
6
7
6.2. Adversary budget = 28
The second experiment considers that two links can be damaged by the adversary entity. The9
individual solutions by generations are provided in Figure 5. Similar to the previous case, the10
chromosomes move toward the best solutions during the process of evolutionary optimization.11
12
13
14
Figure 4 Improvement of the capacity expanded network compare to the initial conditions
16. Naimi and Golias 16
1
Figure 5 presents the individual solutions at the 100th
generations. The red dots, represent the2
Pareto frontier solutions. The solutions with bad fitness values are removed during the process of3
the genetic algorithm. In the last iteration, all the individuals are confined to the best solutions.4
The best decision for the designer is to choose a solution from the Pareto front of the last5
generation.6
Figure 6 presents the optimal solution of the adversary entity correspond to the best defender7
decision. The optimal solution found for the adversary was changed from link 43 and 60 in the8
initial network, to 23 and 27 in the improved network.9
Figure 5 Individuals solutions at by the two objectives of the designer at the 100st
generation
17. Naimi and Golias 17
initial network improved network
Figure 6 the optimal decisions of the attacker for the initial and improved networks
1
Compared to the results of the previous experiment, links 34, 40, 52, 53 and 58 are collecting2
more investment in this test. The total system travel time for the initial network, and the3
improved network are 7.48×10⁶
minutes and 5.97×10⁶
minutes respectively. The values for the4
degraded network are 13.53×10⁶
minutes before improvements, and 11.90×10⁶
minutes after the5
improvements. Giving a higher budget to the adversary entity, in terms of damaging the network6
elements, creates a larger total cost to the users.7
Since the damage to the links is modeled by increasing the travel time to a higher value, the8
travelers are not interested in using these links. However, there still exist low traffic volumes that9
use these links in the degraded network. This is due to the fact that the degree of damage to the10
network, in this test, is significant enough that a portion of users utilize these links despite the11
higher cost. In other words, the damages to the mentioned links, create high congestion on some12
of the alternative routes. The improved network, influences drivers to use links other than13
centralized links. Hence, the potential damages that the attacker can incur on the whole network14
would be minimized.15
16
7. CONCLUSION17
A quantitative method for ranking their projects for budget allocation is essential for18
transportation agencies. The objective of allocation of these resources can generally be the19
maximization of social welfare. An intelligent adversary may look for vulnerabilities in the20
network to degrade its performance. At the planner’s level, allocating resources without21
considering the potential of disruptions by the intelligent adversary, may not help reduce the22
vulnerabilities, or similarly increase the robustness of the network. To address this issue, models23
were presented for designing robust networks. The models were formed in multi-level24
optimization, considering flows of decisions are to be made in sequence. Therefore, a hierarchy25
structure of the movements are presented. The planner of the network is assumed to look for26
investing the assigned budget on the links/projects of the network, while the enemy was assumed27
to damages/disable links. The results of the optimization of these players are passed to the lower28
level. The lower level problem provides flow vectors based on user equilibrium principles. The29
18. Naimi and Golias 18
interaction between these levels forms multi-level problems. A solution algorithm is presented1
based on genetic algorithms for the network designer and attacker, and Frank Wolfe for the2
users. Several test networks were examined to evaluate the performance of the algorithms and3
models. The results showed that the proposed model can search over the possible results for the4
designer and choose the most robust solution compare to the other possible solutions. Results5
showed promising achievements in terms of increasing the robustness of the network against6
intelligent disruptions, and also improving other system wide performance measures as presented7
in the bi-objective robust network design problem model.8
9
8. REFERENCES10
Allsop, R.E., 1974. Some possibilities for using traffic control to influence trip distribution and11
route choice, in: Transportation and Traffic Theory, Proceedings.12
Chiou, S.-W., 2005a. Bilevel programming for the continuous transport network design problem.13
Transp. Res. Part B Methodol. 39, 361–383. doi:10.1016/j.trb.2004.05.00114
Chiou, S.-W., 2005b. Bilevel programming for the continuous transport network design problem.15
Transp. Res. Part B Methodol. 39, 361–383. doi:10.1016/j.trb.2004.05.00116
Dziubiński, M., Goyal, S., 2013. Network design and defence. Games Econ. Behav. 79, 30–43.17
doi:10.1016/j.geb.2012.12.00718
Gershwin, S.B., Tan, H.-N., others, 1979. Hybrid Optimization: control of traffic networks in19
equilibrium.20
Konur, D., Golias, M.M., Darks, B., 2013. A mathematical modeling approach to resource21
allocation for railroad-highway crossing safety upgrades. Accid. Anal. Prev. 51, 192–201.22
doi:10.1016/j.aap.2012.11.01123
Leblanc, L.J., 1973. Mathematical programming algorithms for large scale network equilibrium24
and network design problems.25
Marcotte, P., 1983. Network Optimization with Continuous Control 17, 181–197.26
Marcotte, P., 1986. Network design problem with congestion effects: A case of bilevel27
programming. Math. Program. 34, 142–162.28
Marcotte, P., Marquis, G., 1992. Efficient implementation of heuristics for the continuous29
network design problem. Ann. Oper. Res. 34, 163–176.30
Marcotte, P., Zhu, D.L., 1996. Exact and inexact penalty methods for the generalized bilevel31
programming problem. Math. Program. 74, 141–157. doi:10.1007/BF0259220932
Martin, P.A.S., Thesis, 2007. TRI-LEVEL OPTIMIZATION MODELS TO DEFEND33
CRITICAL INFRASTRUCTURE.34
19. Naimi and Golias 19
Murray, A.T., Davis, R., Stimson, R.J., Ferreira, L., 1998. Public Transportation Access. Transp.1
Res. Part D Transp. Environ. 3, 319–328. doi:10.1016/S1361-9209(98)00010-82
Murray-Tuite, P., Mahmassani, H., 2004. Methodology for Determining Vulnerable Links in a3
Transportation Network. Transp. Res. Rec. 1882, 88–96. doi:10.3141/1882-114
Snelder, M., n.d. Designing Robust Road Networks.5
Steenbrink, P.A., 1974. Optimization of transport networks. New York.6
Suwansirikul, C., Friesz, T.L., Tobin, R.L., 1987. Equilibrium Decomposed Optimization: A7
Heuristic for the Continuous Equilibrium Network Design Problem. Transp. Sci. 21, 254–8
263. doi:10.1287/trsc.21.4.2549
10