
Recommandé
Recommandé
Contenu connexe
Dernier
Dernier (20)
En vedette
En vedette (20)
Week 2 Part 3 Ppt Starchart
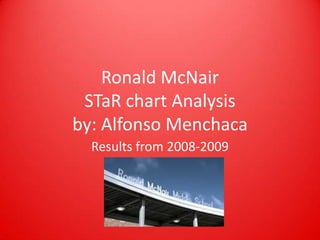
- 1. Ronald McNairSTaR chart Analysisby: Alfonso Menchaca Results from 2008-2009
- 2. Star Chart Agenda Purpose of STaR Chart 4 Areas of Chart Types of ratings McNair vs Statewide results for 2008-2009 Comparison Chart 2006-2009 Conclusion
- 3. Purpose of STaR Chart School Technology and Readiness Chart Shows where the level of technology is for the campus. Online resource to help guide curriculum decisions for technology. Click Link for Information for McNair http://starchart2.esc12.net/campusSearchlist.aspx?foryear=20082009&district=southwest&campus=ronald
- 4. 4 Areas of Chart Area 1: Teaching and Learning Area 2: Educator and Preparation and Development Area 3: Leadership, Administration and instructional Support Area 4: Infrastructure for Technology.
- 5. Types of Ratings Early Tech (Total 6-8 points) Developing Tech (Total 9-14 Points) Advanced Tech (Total 15-20 Points) Target Tech (Total 21-24 Points)
- 6. McNair vs Statewide2008-2009 McNair vs Statewide Teaching and Learning Developing Developing Educator and Preparation and Development Developing Developing Leadership, Administration and instructional Support Advanced Developing Infrastructure for Technology Target Advanced
- 8. Summary/Conclusion After comparing the data from the last 3 years the trend is that all levels are increasing every years except Teaching and Learning. Teaching and Learning is our weakness and needs to be improved. With the information gathered I can now guide my staff to really improve efforts in teaching the correct technology and to learn how to use the technology themselves to prepare our students. “Ready for the Challenge”