Nashik Call Girl Just Call 7091819311 Top Class Call Girl Service Available
Amit kapoor
1. Clusters in India
Institute for Competitiveness (IFC), India is an independent, international initiative centred in India, dedicated to enlarging and disseminating the body of
research and knowledge on competition and strategy, pioneered over the last 25 years by Professor M.E. Porter of the Institute for Strategy and
Competitiveness, Harvard Business School (ISC, HBS), USA. IFC, India works in affiliation with ISC, HBS, USA to offer academic & executive courses, conduct
indigenous research and provide advisory services to corporate and Government within the country. The institute studies competition and its implications for
company strategy; the competitiveness of nations, regions & cities; suggests and provides solutions for social problems. IFC, India brings out India City
Competitiveness Report, India State Competitiveness Report, India Economic Quarterly, Journal of Competitiveness and funds academic research in the area
of strategy & competitiveness. To know more about the institute write to us at info@competitiveness.in.
1
2. Macro Economic Trends in India – The Big Idea
Factor
Conditions
The The rural
Base of and the
Indian
the urban
Demand Middle
Conditions Pyramid India
Class
The Big Idea Opportunities in India India versus Bharat
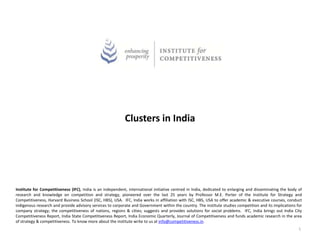
7. Indian Life Science Clusters
•NIPER
•PGI Chandigarh
•IMTECH • DBT, DST, CSIR, DP, ICMR, ICAR
•IISER • Translational Health Sciences Cluster
• Proposed Agri Biotech Park
•National Institute of Immunology
•ICGEB
• Institute of Genomics & Integrative Biology
• National Brain Research Centre
•JNU, Delhi University
•PERD, NIPER
•Savli Biotech Park
• Proposed Biotech Park in • CDRI, IITR, CIMAP, NBRI
Ahmedabad • Lucknow Biotech Park
• MS Univ Baroda
• Indian Inst of Chemical Biology
•TIFR • IIT Kharagpur
•IIT Bombay, Univ of Mumbai • Bose Institute
•National Chemical Laboratory • Dept. of Biotechnology, CU
• National Centre for Cell Sciences • IISER, DBT Institute, Haringhata
• Pune University, IISER
• International Biotech Park •Indian Institute of Chemical Technology
•Centre for Cellular & Molecular Biology
• Indian Institute of Science •Centre for DNA Fingerprinting & Diag
•National Centre for Biological Sciences •National Institute of Nutrition, ICRISAT
•Jawaharlal Nehru Centre for Advanced • University of Hyd, Osmania Univ
Scientific Research •IKP Knowledge Park, SP Biotech Park
• University of Agricultural Sciences
• Stem Cell Institute
•IBAB, ABLE • Anna University
•IIT Madras
• TICEL Biotech Park
• Women’s Biotech Park
9. Cluster Development in India: MSME’s CDP in India
The Ministry of Micro, Small and Medium Enterprises (MSME), Government of India has
adopted the cluster development approach as a key strategy for enhancing the productivity and
competitiveness as well as capacity building of Micro and Small Enterprises (MSEs) and their
collectives in the country.
Objectives of the Scheme:
To support the sustainability and growth of MSEs by addressing common issues such as
improvement of technology, skills and quality, market access, access to capital, etc.
To build capacity of MSEs for common supportive action through formation of self help groups,
consortia, upgradation of associations, etc.
To create/upgrade infrastructural facilities in the new/existing industrial areas/ clusters of MSEs.
To set up common facility centres (for testing, training centre, raw material depot, effluent
treatment, complementing production processes, etc).
10.
11.
12.
13.
14. 9 e
12 UK DL LICY GJ PO
T E ONOMIC T
HE C IMESON S UR
AT DAYMUMBAI 27 NOVEMBE 2010 *
R
DE BURDE
BT
HR
population to grow
BR INDIA
10NL SK CG KR OR
Statescan harnesstheir 6 MZ
ARHP
8 GOTR MG KA RJ
JH
PJ
TN
AP
WB
MH
UP Gross debt to GDPu
n
a
(
population to grow 4 JK AS MP Gross debt
l
(USdollars in billions
capita (USdollars) f
Gross debt per
MN
2 AN Gross debt per
PD working-age m
POLICIES THAT MAKE PRODUCTIVE USE OF AVAILABLE RESOURCES AR 0 person (USdollars)
2
POLICIES THAT MAKE PRODUCTIVE USE OF AVAILABLE RESOURCES ARE CRITICAL 0 500 1000 1500 2000 2500 Source: IMFFiscal Monitor,
ILO Economically-Active Po
P opulation size in lakhs u
PE OPLEPOWER PEOPLEPOWER
States contributing to India’s G growth
DP Comparison of state population growth and G growth DP
S b
O
States contributing to India’sDP growth higher than national average)
(G G DP growth
(G growth higher than national average)
DP GDP
Population
growth rate
14
UK HR DL CH ind d
S
C
tate
handigarh
(India avg 7.99) (India avg 1.55)
Population
13.12
12 GJ BR THE EXPLOS
GDP Delhi growth rate 11.86
5.05
3.11
10 AP S C
K G NL SERIOUS LO B
State (India avg 7.99) (India avg 1.55) 1.59
Uttarakhand 11.8 KR OR HP
Haryana 11.69 1.98 Population
TR KR AR MH GO u
P
Chandigarh 13.12 Gujarat
Bihar
5.05 10.8
10.83
1.64
1.86
growth rates
are HIGHER
8 MG R J MZ
l
g
w
Delhi 11.86 Chhattisgarh 3.11 than national TN WB JH G
Sikkim
9.78
9.6
1.76
1.58
average 6 P J
UP AN s
d
f
Uttarakhand 11.8 Nagaland 1.59 9.54 4.89 AS JK MN PD
Haryana 11.69 Himachal Pradesh 8.88
1.98 P 1.59
opulation 4 MP t
m
n
growth rates h
Gujarat 10.8 Andhra Pradesh1.64
Orissa
9.52
9.37
0.99
P
are HIGHER rates
1.07 opulation 2 gatenet government de
trillion —44% of world
Bihar 10.83 Meghalaya 1.86 8.05 1.39
growth —in 2015. Advanced e
Chhattisgarh 9.78 Tripura Pradesh 8.79
1.76 8.4 than national
0.99
are LOWER
0 P ad es
ras timatesther
Sikkim
Arunachal
9.6 Kerala 1.58 9.55
average average
1.27
0.77
than national
0 1 2 3 4
vanced economieswill
5
ther to 85% in 2015. In
ARINDAM
better. Thecorres pondi
R
Nagaland 9.54 14Population size vs G growth rate
4.89 DP er chunk of working-age people, whocan among s opulation growthwhich are als corres
P others, that is dragging force, (%) o pondingly far 26%srespectively. In 20
everal
contribute to theG and generate high- down the economic growth of relatively moreproductive.
DP gros domes product
tic
I
Himachal Pradesh 8.88 12 1.59
CH
UK
DL
NL S C KR
K G
HR GJ
BR
er output per capita. affluent s tates like Maharas
In fact, theInternational Labour Orga- : nataka and T
htra, Kar- G up 2: S
ro tates with healthy G and
DL: Delhi tated that India will such asBihar, Andhra Pradesh andtates Nadu growth:rates, suchP must fo-
AS Assam amil Nadu. Yet, afew amil population HaryanaUttar asChandi-
s
TN: T Gu- garh, Delhi, UP and Biharradesh
DP debt. By 2015, they are
account for jus 14% o
t d
10 nization (ILO) has s sharein worldG , thei
DP
radesh To put that moregrapho
ARHP OR AP
8 TR
MG KA RJ MH
CH: C handigarh NL: Nagaland BR Bihar
:
account for thehighes working agepop- jarat with large populations are exhibit- cuson s
t AP Andhra P
:
ectorswhere they are inherently
Andhra Pradesh 9.52 6 0.99 GO
MZ JH TN WB
ulation in thenext 10 years in areport re- inghigh G growth.
: In the ,
KR Keraladocument prepared Uttarakhand
UK: DP
R RJ: ajasthan resourcesoretraditional skillsP
competitive becaus of the pres
AR Arunachal and
: ence of
radesh nalThis has twoborrowe
rather than
majorw
PJ UP
Orissa 9.37 4 1.07
JK AS P opulation
MP leas recently.
ed natural
MN for the G T S
TR-20 ummit held earlier this :No burden on IndiahaveaGDPgrowth knowledge. Thesestatesof a large work-
: eoul, theILOsaysthat theHRSHaryanain economicGO: Goa to turn the availability shouldfindways
ripura growth HP Himachal P
: radesh they will beablethan fom
to us e
2 growth rates
wo, g
AN
month in S G - ixteen s tates purpos rather
es
Meghalaya 8.05 0 1.39 PD
20nationswill s their workingagepop- higher than the national MZ: Mizoram in their favour ammu & Kashmir or repayment. T the
MG: Meghalaya
ee GJ: Gujarat average. Of force JK: Jby offering suitable
0 500 1000 1500 2000 are LOWER
2500
PD: Puducherry
ulation between 15 and 64 yearsincreasC these, ten higher than thenational av- education policiesandopportunities. Set-
G:growth rate states show a J: P
e C hattisgarh Ppopulation ting the right MP: Madhya to en-
unjab Pradesh wheresucceeding gene
Tripura 8.4 0.99 Population size in lakhs
by 212 million in the period 2010-2020. priorities is critical lier generationswill be
than national KA: Karnataka S erage, whilesix other statesMN: popu- hancecompetitivenessfor thisbandof& Nicobar Islands
K: S
Over 64% of thisincreas will occur in In-
e ikkim have a Manipur AN: Andaman In- advanced economies A .
Arunachal Pradesh 8.79 Comparison of state population growth and G growth
1.27 DP
Kerala 9.55
14
UK HR
average
DL CH
diaalone!
WB: West Bengal
Thismonth’sIFCIndiaS D ve pm nt JH: lation growth ratelower than thenation- dian states.number of Maharashtra
Javerage.
harkhand OR OrissaGroup3: A MH: statessuch asKar-
: pendency ratio —read
group —and clearly, th
s
12 0.77BR tate e lo e al
10 AP
KR OR
SK
GJ
HP
C
TR KR AR MH GO
G
NL Baro e r takesas
m te harp look at what pop- Population growth, considered a bur- nataka, Wes Bengal, Rajas
t than, T
er chunk of working-age people,to economic growth, growthto have Nadu and Mizoram that is dragging with therisewhich
ulation really means to the economic den who can among s slightlyothers are performing GDP
seems everal below India’s average only
,
amil Thisisgraphically br
force, in GDP EM . a
Population size vs G growth rate
DP 8
TN MG MZ R J growth of India’sstatesand analys how
es littlecorrelation with GDP (corre- levelsfrom 2007 to 201
J 2015. In contrg
AY produc
EE A
T
14 CH
6 WB JH
PJ
AN
AS JK MN
UP
PD
contribute to theG and generate high- statessuch asthe economic growth of relatively 2010 to
s DP
tatescan us their demographics
e lation = 0.24). Large down Bihar, growth rate. Thes s
ituation e tatescan quickly cat- more
to improve their competitivenes , and
s for instance, haves howed s tained G
4 MP
er output per capita. affluent DP apult themselvesinto Group 2 with afo-
us
tates like productivity. htra, Kar- overro debt2: capita
growth over the decade along with s cus effort on Maharas Gthesetwo periodsg
up per S ta
12 UK DL HR GJ 2 hence, enhancetheir pros perity. a ed
In fact, theInternational Labourunjaband Manipur with slower T up 4: ANadu. foret, a few s
steadily ris population, whereassand Gamil roadmap Yenhancing com-
Orga- nataka tates petitivenessiscritical for poorly perform-
ing ro
Average
tates rose to $29,100 in 201
population 20 gr
BR 0
nization acceptedthat growthamongIn- population increase areuch atGDP inge . Amongthese, statesh and G n-ve per person. T
tated that India will sshowing Bihar,states o P po asUt- u- $48,000 us
NDIAisasthec ntre f the such Andhra rades pulatio garh, Delhi, f rs - H
10NL SK CG KR OR 01 2 3 4 5 Rising stars among states s asP
uch $41,000 in 2015. By
ARHP AP P opulation growth (%) It iswidely (ILO) has s
8 GOTR MG KA RJ MH Delhi
DL: AS Assam
:
WB CH: Chandigarh NL: Nagaland
TN: Tamil Nadu
BR Bihar
:
UP Uttar P
: radesh
AP Andhra P
: radesh
account for thewith sometgrowth, growth ratesthat arewthde na- large ithand Madhya rld’s eo $75,900,onhighest inr
dian s
ous s
tatesisskewed,
ro jarat the largeradesh thewoParehexhibit- becus the st
highesprosper- tional average.g lower thanwith tarW growingpopulationsmust withc nd-larg s 2015.
tates bearing the burden of working age pop- bate Pand
. populations rades con- s e ector
jus $1,200 in
t
TN