World Class Benchmarking: Air Asia Berhad (AIRA MK)
•
2 j'aime•1,062 vues

AirAsia earns revenues via seven business segments. Its main contributor is scheduled flights, comprising 55% of total sales. CEO Anthony Fernandez has served in his capacity since 2001, when he and several partners bought AirAsia from its former owners. AirAsia’s financial metrics have improved greatly in the last two years. Learn more at: http://becomeabetterinvestor.net/blog/flying-high-with-airasia/

Recommandé
Contenu connexe
Tendances
Tendances (20)
Similaire à World Class Benchmarking: Air Asia Berhad (AIRA MK)
Similaire à World Class Benchmarking: Air Asia Berhad (AIRA MK) (20)
Plus de Andrew Stotz, PhD, CFA
Plus de Andrew Stotz, PhD, CFA (20)
Dernier
Dernier (20)
World Class Benchmarking: Air Asia Berhad (AIRA MK)
- 1. Presented by: Dr. Andrew Stotz, CFA AirAsia Berhad
- 2. 216 October 2016 Background: AirAsia Berhad is a low-cost airline, providing long and short haul, point-to-point domestic and international routes. It primarily operates in the Asia Pacific region and currently serves about 200 destinations across Asia, Australia, New Zealand and the Middle East, among others. Sources: A. Stotz Investment Research, Bloomberg, company data, FactSet, Thomson Reuters Stock information: Name: AirAsia Bhd. Ticker: AIRA MK Price (MYR): 2.78 Mcap: US$1,841m 3MADTO: US$11m Beta: 1.8x Sector: Industrials Industry: Transportation Major shareholders: 19% Tune Air Sdn Bhd 5% Skagen AS 78% Free float AirAsia Berhad (AIRA MK) AIRA earns revenues via seven business segments. Its main contributor is Scheduled flights, comprising 55% of total sales. These are forward bookings of clients for future travel. Meanwhile, the charter flight segment, which are flights that are not part of AIRA’s regular schedule, contributes 14% of total sales Ancillary revenue segment with 16% contribution to total sales includes assigned seat, cancellation, documentation and other fees, and the onboard sale of meals and merchandise Other business segments are Aircraft operating lease income, Freight and cargo, fuel surcharge and management fees The group’s network has about 200 destinations spanning 24 countries. Its affiliate airlines include AirAsia India, AirAsia Japan, AirAsia X, Indonesia AirAsia and Philippines AirAsia AirAsia considers the sale of its leasing arm Asia Aviation Capital (AAC) with an equity value of around US$1bn inclusive of debt Revenue breakdown, by segment 2015 (Others 2%) Ancillary revenue 16%Scheduled and charter flights 69% Aircraft operating lease 9% Freight and cargo 4% - 50 100 150 - 1 2 3 4 Oct-13 Jul-14 Apr-15 Jan-16 Oct-16 AIRA MK (LHS) Price relative to local index (MYR) (%)
- 3. 316 October 2016 Sources: A. Stotz Investment Research, Bloomberg, company data, FactSet, Thomson Reuters Background: AirAsia Berhad is a low-cost airline, providing long and short haul, point-to-point domestic and international routes. It primarily operates in the Asia Pacific region and currently serves about 200 destinations across Asia, Australia, New Zealand and the Middle East, among others. AirAsia Berhad (AIRA MK)
- 4. 416 October 2016 - 50 100 150 - 1 2 3 4 Oct-13 Jul-14 Apr-15 Jan-16 Oct-16 AIRA MK (LHS) Price relative to local index (MYR) (%) Sources: A. Stotz Investment Research, Bloomberg, company data, FactSet, Thomson Reuters Stock information: Name: AirAsia Bhd. Ticker: AIRA MK Price (MYR): 2.78 Mcap: US$1,841m 3MADTO: US$11m Beta: 1.8x Sector: Industrials Industry: Transportation Major shareholders: 19% Tune Air Sdn Bhd 5% Skagen AS 78% Free float AirAsia Berhad (AIRA MK)
- 5. 516 October 2016 Background: AirAsia Berhad is a low-cost airline, providing long and short haul, point-to-point domestic and international routes. It primarily operates in the Asia Pacific region and currently serves about 200 destinations across Asia, Australia, New Zealand and the Middle East, among others. Sources: A. Stotz Investment Research, Bloomberg, company data, FactSet, Thomson Reuters Stock information: Name: AirAsia Bhd. Ticker: AIRA MK Price (MYR): 2.78 Mcap: US$1,841m 3MADTO: US$11m Beta: 1.8x Sector: Industrials Industry: Transportation Major shareholders: 19% Tune Air Sdn Bhd 5% Skagen AS 78% Free float AirAsia Berhad (AIRA MK) AIRA earns revenues via seven business segments. Its main contributor is Scheduled flights, comprising 55% of total sales. These are forward bookings of clients for future travel. Meanwhile, the charter flight segment, which are flights that are not part of AIRA’s regular schedule, contributes 14% of total sales Ancillary revenue segment with 16% contribution to total sales includes assigned seat, cancellation, documentation and other fees, and the onboard sale of meals and merchandise Other business segments are Aircraft operating lease income, Freight and cargo, fuel surcharge and management fees The group’s network has about 200 destinations spanning 24 countries. Its affiliate airlines include AirAsia India, AirAsia Japan, AirAsia X, Indonesia AirAsia and Philippines AirAsia AirAsia is considering the sale of its leasing arm Asia Aviation Capital (AAC) with an equity value of around US$1bn inclusive of debt Revenue breakdown, by segment 2015 (Others 2%) Ancillary revenue 16%Scheduled and charter flights 69% Aircraft operating lease 9% Freight and cargo 4% - 50 100 150 - 1 2 3 4 Oct-13 Jul-14 Apr-15 Jan-16 Oct-16 AIRA MK (LHS) Price relative to local index (MYR) (%)
- 6. 616 October 2016 Sources: A. Stotz Investment Research, Bloomberg, company data, FactSet, Thomson Reuters AIRA earns revenues via seven business segments Its main contributor is scheduled flights, comprising 55% of total sales. These are forward bookings of clients for future travel Meanwhile, the charter flight segment, which are flights that are not part of AIRA’s regular schedule, contributes 14% of total sales AirAsia Berhad (AIRA MK)
- 7. 716 October 2016 Sources: A. Stotz Investment Research, Bloomberg, company data, FactSet, Thomson Reuters Ancillary revenue segment with 16% contribution includes assigned seat, cancellation, documentation and other fees, and the onboard sale of meals and merchandise AirAsia Berhad (AIRA MK)
- 8. 816 October 2016 Sources: A. Stotz Investment Research, Bloomberg, company data, FactSet, Thomson Reuters Other business segments are Aircraft operating lease income, Freight and cargo, fuel surcharge and management fees AirAsia Berhad (AIRA MK)
- 9. 916 October 2016 Sources: A. Stotz Investment Research, Bloomberg, company data, FactSet, Thomson Reuters The group’s network has about 200 destinations spanning 24 countries Its affiliate airlines include AirAsia India, AirAsia Japan, AirAsia X, Indonesia AirAsia and Philippines AirAsia AirAsia Berhad (AIRA MK)
- 10. 1016 October 2016 Sources: A. Stotz Investment Research, Bloomberg, company data, FactSet, Thomson Reuters AirAsia is considering the sale of its leasing arm Asia Aviation Capital (AAC) with an equity value of around US$1bn inclusive of debt AirAsia Berhad (AIRA MK)
- 11. 1116 October 2016 Background: AirAsia Berhad is a low-cost airline, providing long and short haul, point-to-point domestic and international routes. It primarily operates in the Asia Pacific region and currently serves about 200 destinations across Asia, Australia, New Zealand and the Middle East, among others. Sources: A. Stotz Investment Research, Bloomberg, company data, FactSet, Thomson Reuters Stock information: Name: AirAsia Bhd. Ticker: AIRA MK Price (MYR): 2.78 Mcap: US$1,841m 3MADTO: US$11m Beta: 1.8x Sector: Industrials Industry: Transportation Major shareholders: 19% Tune Air Sdn Bhd 5% Skagen AS 78% Free float AirAsia Berhad (AIRA MK) AIRA earns revenues via seven business segments. Its main contributor is Scheduled flights, comprising 55% of total sales. These are forward bookings of clients for future travel. Meanwhile, the charter flight segment, which are flights that are not part of AIRA’s regular schedule, contributes 14% of total sales Ancillary revenue segment with 16% contribution to total sales includes assigned seat, cancellation, documentation and other fees, and the onboard sale of meals and merchandise Other business segments are Aircraft operating lease income, Freight and cargo, fuel surcharge and management fees The group’s network has about 200 destinations spanning 24 countries. Its affiliate airlines include AirAsia India, AirAsia Japan, AirAsia X, Indonesia AirAsia and Philippines AirAsia AirAsia considers the sale of its leasing arm Asia Aviation Capital (AAC) with an equity value of around US$1bn inclusive of debt Revenue breakdown, by segment 2015 (Others 2%) Ancillary revenue 16%Scheduled and charter flights 69% Aircraft operating lease 9% Freight and cargo 4% - 50 100 150 - 1 2 3 4 Oct-13 Jul-14 Apr-15 Jan-16 Oct-16 AIRA MK (LHS) Price relative to local index (MYR) (%)
- 12. 1216 October 2016 Sources: A. Stotz Investment Research, Bloomberg, company data, FactSet, Thomson Reuters Revenue breakdown, by segment 2015 (Others 2%) Ancillary revenue 16% Scheduled and charter flights 69% Aircraft operating lease 9% Freight and cargo 4%
- 14. 1416 October 2016 AIRA: Leadership Sources: A. Stotz Investment Research, company data, FactSet ChairmanCEO 2012 2013 2014 2015 Past 12 months Kamarudin Bin Meranun Nov 2013 – Present Anthony “Tony” Fernandes Dec 2001 – Present Abdel Aziz Jun 2008 – Nov 2013
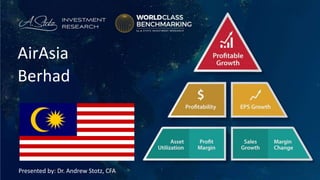
- 15. 1516 October 2016 '12 '13 '14 '15 PTM 4 7 9 4 1 '12 '13 '14 '15 PTM '12 '13 '14 '15 PTM 4 7 9 7 3 3 9 10 1 1 '12 '13 '14 '15 PTM '12 '13 '14 '15 PTM '12 '13 '14 '15 PTM '12 '13 '14 '15 PTM 10 10 10 10 10 1 3 8 2 1 4 6 5 2 1 1 10 10 1 1 Benchmarked against 1,400 large Industrials companies worldwide. Profitable Growth Asset utilization Profit margin Sales growth Margin change Profitability Growth CEO, 2002 – Present Tony Fernandes Source: A. Stotz Investment Research. Notes: 1 = top ranking and 10 = worst. Most recent year’s data is based on the past 12 months (PTM) of published data. Profitable Growth has improved to World Class from #9 in 2014! Ranks among the best 140 of 1,400 large Industrials companies AIRA: A. Stotz Profitable Growth
- 16. 1616 October 2016 '12 '13 '14 '15 PTM 4 7 9 4 1 '12 '13 '14 '15 PTM '12 '13 '14 '15 PTM 4 7 9 7 3 3 9 10 1 1 '12 '13 '14 '15 PTM '12 '13 '14 '15 PTM '12 '13 '14 '15 PTM '12 '13 '14 '15 PTM 10 10 10 10 10 1 3 8 2 1 4 6 5 2 1 1 10 10 1 1 Benchmarked against 1,400 large Industrials companies worldwide. Profitable Growth Asset utilization Profit margin Sales growth Margin change Profitability Growth Source: A. Stotz Investment Research. Notes: 1 = top ranking and 10 = worst. Most recent year’s data is based on the past 12 months (PTM) of published data. Profitable Growth has improved to World Class from #9 in 2014! Ranks among the best 140 of 1,400 large Industrials companies Profitability has improved to #3 from #7 and Growth is the best AIRA: A. Stotz Profitable Growth CEO, 2002 – Present Tony Fernandes
- 17. 1716 October 2016 '12 '13 '14 '15 PTM 4 7 9 4 1 '12 '13 '14 '15 PTM '12 '13 '14 '15 PTM 4 7 9 7 3 3 9 10 1 1 '12 '13 '14 '15 PTM '12 '13 '14 '15 PTM '12 '13 '14 '15 PTM '12 '13 '14 '15 PTM 10 10 10 10 10 1 3 8 2 1 4 6 5 2 1 1 10 10 1 1 Benchmarked against 1,400 large Industrials companies worldwide. Profitable Growth Asset utilization Profit margin Sales growth Margin change Profitability Growth Source: A. Stotz Investment Research. Notes: 1 = top ranking and 10 = worst. Most recent year’s data is based on the past 12 months (PTM) of published data. Profitable Growth has improved to World Class from #9 in 2014! Ranks among the best 140 of 1,400 large Industrials companies Profitability has improved to #3 from #7 and Growth is the best Profit margin is now #1 And so is the Sales growth AIRA: A. Stotz Profitable Growth CEO, 2002 – Present Tony Fernandes
- 18. 1816 October 2016 Do YOU want to see the Profitable Growth rank for a company in YOUR portfolio? Leave a comment below with company name and country of listing…and I’ll post it if I have it