SlideShare une entreprise Scribd logo
1  sur  12
1.    Test

      The scatter graph shows 15 pupils’ coursework and test marks.

                                        50

                                                                                            K
                                        40                                                      ×
                                                                                                         N ×

                                                                                                               R
                                        30                                                                         ×
                                Te st                             B×            E
                               m a rk                                               × H ×       M ×
                                                                       C              F    J
                                        20                                 ×           ×     ×
                                                                                               L×   P×
                                                         A             D ×             G ×
                                        10                   ×


                                         0
                                             0               10            20          30           40             50
                                                                  C o u rs e w o rk m a rk

      To find a pupil’s total mark, you add the coursework mark to the test mark.


      (a)    Which pupil had the highest total mark?


                                                                                                                   ...............................
                                                                                                                                                     1 mark


      (b)    Look at the statement below. Tick (                   ) True or False.

              The range of coursework marks was greater than the range of test marks.


                                                 False
                        True


             Explain your answer.


                                                                                                                                                     1 mark


Queensbury School                                                                                                                               1
(c)   Pupils with total marks in the shaded region on the graph win a prize.

                                 50


                                 40


                                 30
                         Te st
                        m a rk
                                 20


                                 10


                                  0
                                      0   10        20         30           40           50
                                               C o u rs e w o rk m a rk


       What is the smallest total mark
       needed to win a prize?                                             ...............................
                                                                                                            1 mark
2.    Test

      The scatter graph shows 15 pupils’ coursework and test marks.

                                          50

                                                                                           K
                                          40                                                   ×
                                                                                                        N ×

                                                                                                              R
                                          30                                                                      ×
                                  Te st                          B×            E
                                 m a rk                                            × H ×       M ×
                                                                      C              F    J
                                          20                              ×           ×     ×
                                                                                              L×   P×
                                                        A             D ×             G ×
                                          10                ×


                                           0
                                               0            10            20          30           40             50
                                                                 C o u rs e w o rk m a rk


      To find a pupil’s total mark, you add the coursework mark to the test mark.

      (a)    Which pupil had the highest total mark?


                                                                                                                  ...............................
                                                                                                                                                    1 mark


      (b)    Look at the statement below. Tick (                  ) True or False.

              The range of coursework marks was greater than the range of test marks.


                                                   No
                           Yes

             Explain your answer.


                                                                                                                                                    1 mark


Queensbury School                                                                                                                              3
(c)   Pupils with total marks in the shaded region on the graph win a prize.

                                     50


                                     40


                                     30
                          Te st
                         m a rk
                                     20


                                     10


                                      0
                                          0        10             20         30            40          50
                                                             C o u rs e w o rk m a rk


       What is the smallest total mark
       needed to win a prize?                                                           ...............................
                                                                                                                          1 mark

(d)   Another school has a different rule for pupils to win a prize.

      Rule:     The coursework mark must be 25 or more, and
                the test mark must be 25 or more, and
                the total mark must be 65 or more.

      On the graph below, shade the region of total marks for which pupils would win a prize.

                                          50


                                          40


                                          30
                             Te st
                            m a rk
                                          20


                                          10


                                           0
                                               0        10             20         30            40          50
                                                                C o u rs e w o rk m a rk
                                                                                                                          2 marks
3.    Scatter graphs

      The scatter graph shows information about trees called poplars.


                                 6


                                 5


                                 4
                H e ig h t o f
                 tre e (m )


                                 3


                                 2


                                 1


                                 0
                                     0      1             2                 3                4   5
                                                   D ia m e te r o f tr e e tr u n k ( c m )


      (a)   What does the scatter graph show about the relationship between the diameter of the
            tree trunk and the height of the tree?


                                                                                                         1 mark


      (b)   The height of a different tree is 3 m. The diameter of its trunk is 5 cm.
            Use the graph to explain why this tree is not likely to be a poplar.


Queensbury School                                                                                    5
1 mark


(c)   Another tree is a poplar. The diameter of its trunk is 3.2 cm.
      Estimate the height of this tree.


                                                                        ............................ m
                                                                                                         1 mark


(d)   Below are some statements about drawing lines of best fit on scatter graphs.

      For each statement, tick ( ) to show whether the statement is True or False.

      Lines of best fit must always...


            go through the origin.                                              True
            False


            have a positive gradient.                                           True
            False


            join the smallest and the largest values.                           True
            False


            pass through every point on the graph.                              True
            False
                                                                                                         2 marks
4.    Mice

      Three types of mice might come into our homes.

      Some mice are more likely to be found in homes far from woodland. Others are more likely to be
      found in homes close to woodland.

      The bar charts show the percentages of mice that are of each type.

                                                                                              Key

                                                                                              Y e llo w - n e c k e d m ic e

                                                                                              W o o d m ic e

                                                                                              H o u s e m ic e


                                           T y p e o f m o u s e fo u n d
                  100                                                                                   100


                   80                                                                                   80


                   60                                                                                   60


              %                                                                                              %


                   40                                                                                   40


                   20                                                                                   20


                    0                                                                                   0
                                 F a r fro m                               C lo s e to
                                w o o d la n d                            w o o d la n d
                          (m o re th a n 5 0 0 m )                   ( 5 0 0 m o r le s s )


Queensbury School                                                                                                              7
Use the bar charts to answer these questions.

(a)   About what percentage of mice in homes close to woodland are wood mice?


                                                                         .......................... %
                                                                                                        1 mark


(b)   About what percentage of mice in homes far from woodland are not wood mice?


                                                                         .......................... %
                                                                                                        1 mark


(c)   The black bars show the percentages for house mice. One of the black bars is taller than the
      other.

      Does that mean there must be more house mice in homes far from woodland than in homes
      close to woodland?

      Tick (    ) Yes or No.


               True              False


      Explain your answer.


                                                                                                        1 mark
5.    Glasses

      There are 60 pupils in a school.

      6 of these pupils wear glasses.

      (a)   The pie chart is not drawn accurately.

                                                             W ear
                                                               g la s s e s


                                                                  D o not
                                                             w e a r g la s s e s

            What should the angles be?


            Show your working.


                                                               ........................ ° and ........................°
                                                                                                                          2 marks

      (b)   Exactly half of the 60 pupils in the school are boys.

            From this information, what percentage of boys in this school wear glasses?

            Tick ( ) the correct box below.


            5%                                 6%                                   10%


            20%                            50%                not possible to tell
                                                                                                                          1 mark


Queensbury School                                                                                                    9
6.   Horses

     The scatter diagram shows the heights and masses of some horses.

     The scatter diagram also shows a line of best fit.


                 700


                 600
           M ass
            (k g )
                   500


                 400


                 300
                         140              150                      160                           170
                                                                           H e ig h t (c m )

     (a)   What does the scatter diagram show about the relationship between the height and mass of
           horses?


                                                                                                                   1 mark


     (b)   The height of a horse is 163cm.
           Use the line of best fit to estimate the mass of the horse.


                                                                                   .......................... kg
                                                                                                                   1 mark

     (c)   A different horse has a mass of 625kg.
           Use the line of best fit to estimate the height of the horse.


                                                                                   ......................... cm
                                                                                                                   1 mark
(d)   A teacher asks his class to investigate this statement:

                    "The length of the back leg of a horse is always less than the length of the
                    front leg of a horse."

            What might a scatter graph look like if the statement is correct?

            Use the axes below to show your answer.


                                         11 0


                                        100


                           L e n g th o f
                             b a c k le g 9 0
                                    (c m )


                                          80


                                          70


                                                70       80        90          100          110
                                                              L e n g th o f fr o n t le g (c m )
                                                                                                         1 mark


Queensbury School                                                                                   11
7.   Shoe laces
     Some shoes have holes for shoe laces.
     These holes are called ‘eyes’.

     Simon has 7 pairs of shoes.
     The scatter diagram shows information about each pair.


                                    150                                                                        ×

                                    130


            L e n g th o f
                                    11 0                                         ×
            s h o e la c e (c m )
                                     90
                                                                       ×
                                     70                       ×                  ×
                                                              ×
                                     50            ×
                                           0   2   4          6         8        10       12         14        16
                                                       N u m b e r o f e y e s in th e s h o e


     (a)   Simon buys a pair of shoes.

           There are 14 eyes in the shoe, and the length of the shoe lace is 130 cm.

           Draw a cross on the scatter diagram to show this information.
                                                                                                                                1 mark


     (b)         One of Simon’s pairs of shoes has the wrong length of shoe lace.

           Which of the crosses on the scatter diagram is most likely to represent
           this pair of shoes? Circle it.
                                                                                                                                1 mark


     (c)         A different shoe has 12 eyes.

           What length of shoe lace do you think it should have?


                                                                                                 ......................... cm
                                                                                                                                1 mark

Contenu connexe

Plus de Angela Phillips

Financial literacy within the year 10 STEAM project
Financial literacy within the year 10 STEAM projectFinancial literacy within the year 10 STEAM project
Financial literacy within the year 10 STEAM projectAngela Phillips
 
Year 10 enterprise week ralph pirozzo
Year 10 enterprise week  ralph pirozzoYear 10 enterprise week  ralph pirozzo
Year 10 enterprise week ralph pirozzoAngela Phillips
 
Financial literacy for essential mathematics students
Financial literacy for essential mathematics studentsFinancial literacy for essential mathematics students
Financial literacy for essential mathematics studentsAngela Phillips
 
German article regarding the Maths projects
German article regarding the Maths projectsGerman article regarding the Maths projects
German article regarding the Maths projectsAngela Phillips
 
Extended homework task percentages
Extended homework task percentagesExtended homework task percentages
Extended homework task percentagesAngela Phillips
 
Year+8+extension+measurement+homework+task+blooms by kate johns
Year+8+extension+measurement+homework+task+blooms by kate johnsYear+8+extension+measurement+homework+task+blooms by kate johns
Year+8+extension+measurement+homework+task+blooms by kate johnsAngela Phillips
 
Hitting a home run factorising
Hitting a home run factorisingHitting a home run factorising
Hitting a home run factorisingAngela Phillips
 
The wand chooses the wizard harry
The wand chooses the wizard harryThe wand chooses the wizard harry
The wand chooses the wizard harryAngela Phillips
 
Year 10 probability the hunger games 10 extension
Year 10 probability the hunger games 10 extensionYear 10 probability the hunger games 10 extension
Year 10 probability the hunger games 10 extensionAngela Phillips
 
Batman logo and word student sample
Batman logo and word student sampleBatman logo and word student sample
Batman logo and word student sampleAngela Phillips
 
Project missile trajectory
Project missile trajectoryProject missile trajectory
Project missile trajectoryAngela Phillips
 
Project heartbeat student work
Project heartbeat student workProject heartbeat student work
Project heartbeat student workAngela Phillips
 
S tick on the maths students
S tick on the maths studentsS tick on the maths students
S tick on the maths studentsAngela Phillips
 
Using units of measurements extended homework task
Using units of measurements extended homework taskUsing units of measurements extended homework task
Using units of measurements extended homework taskAngela Phillips
 
Project m nutritional information
Project m nutritional informationProject m nutritional information
Project m nutritional informationAngela Phillips
 

Plus de Angela Phillips (20)

Financial literacy within the year 10 STEAM project
Financial literacy within the year 10 STEAM projectFinancial literacy within the year 10 STEAM project
Financial literacy within the year 10 STEAM project
 
Year 10 enterprise week ralph pirozzo
Year 10 enterprise week  ralph pirozzoYear 10 enterprise week  ralph pirozzo
Year 10 enterprise week ralph pirozzo
 
Financial literacy for essential mathematics students
Financial literacy for essential mathematics studentsFinancial literacy for essential mathematics students
Financial literacy for essential mathematics students
 
German article regarding the Maths projects
German article regarding the Maths projectsGerman article regarding the Maths projects
German article regarding the Maths projects
 
Folio task trigonometry
Folio task   trigonometryFolio task   trigonometry
Folio task trigonometry
 
Extended homework task percentages
Extended homework task percentagesExtended homework task percentages
Extended homework task percentages
 
Year+8+extension+measurement+homework+task+blooms by kate johns
Year+8+extension+measurement+homework+task+blooms by kate johnsYear+8+extension+measurement+homework+task+blooms by kate johns
Year+8+extension+measurement+homework+task+blooms by kate johns
 
Home run exemplar
Home run exemplarHome run exemplar
Home run exemplar
 
Hitting a home run factorising
Hitting a home run factorisingHitting a home run factorising
Hitting a home run factorising
 
The wand chooses the wizard harry
The wand chooses the wizard harryThe wand chooses the wizard harry
The wand chooses the wizard harry
 
Year 10 probability the hunger games 10 extension
Year 10 probability the hunger games 10 extensionYear 10 probability the hunger games 10 extension
Year 10 probability the hunger games 10 extension
 
Batman logo and word student sample
Batman logo and word student sampleBatman logo and word student sample
Batman logo and word student sample
 
Project missile trajectory
Project missile trajectoryProject missile trajectory
Project missile trajectory
 
Graphing project
Graphing projectGraphing project
Graphing project
 
Project heartbeat student work
Project heartbeat student workProject heartbeat student work
Project heartbeat student work
 
S tick on the maths students
S tick on the maths studentsS tick on the maths students
S tick on the maths students
 
Stick on the maths
Stick on the mathsStick on the maths
Stick on the maths
 
Using units of measurements extended homework task
Using units of measurements extended homework taskUsing units of measurements extended homework task
Using units of measurements extended homework task
 
Project m nutritional information
Project m nutritional informationProject m nutritional information
Project m nutritional information
 
Quick plenaries
Quick plenariesQuick plenaries
Quick plenaries
 

Dernier

Activity 01 - Artificial Culture (1).pdf
Activity 01 - Artificial Culture (1).pdfActivity 01 - Artificial Culture (1).pdf
Activity 01 - Artificial Culture (1).pdfciinovamais
 
Sanyam Choudhary Chemistry practical.pdf
Sanyam Choudhary Chemistry practical.pdfSanyam Choudhary Chemistry practical.pdf
Sanyam Choudhary Chemistry practical.pdfsanyamsingh5019
 
18-04-UA_REPORT_MEDIALITERAСY_INDEX-DM_23-1-final-eng.pdf
18-04-UA_REPORT_MEDIALITERAСY_INDEX-DM_23-1-final-eng.pdf18-04-UA_REPORT_MEDIALITERAСY_INDEX-DM_23-1-final-eng.pdf
18-04-UA_REPORT_MEDIALITERAСY_INDEX-DM_23-1-final-eng.pdfssuser54595a
 
Nutritional Needs Presentation - HLTH 104
Nutritional Needs Presentation - HLTH 104Nutritional Needs Presentation - HLTH 104
Nutritional Needs Presentation - HLTH 104misteraugie
 
Z Score,T Score, Percential Rank and Box Plot Graph
Z Score,T Score, Percential Rank and Box Plot GraphZ Score,T Score, Percential Rank and Box Plot Graph
Z Score,T Score, Percential Rank and Box Plot GraphThiyagu K
 
“Oh GOSH! Reflecting on Hackteria's Collaborative Practices in a Global Do-It...
“Oh GOSH! Reflecting on Hackteria's Collaborative Practices in a Global Do-It...“Oh GOSH! Reflecting on Hackteria's Collaborative Practices in a Global Do-It...
“Oh GOSH! Reflecting on Hackteria's Collaborative Practices in a Global Do-It...Marc Dusseiller Dusjagr
 
1029-Danh muc Sach Giao Khoa khoi 6.pdf
1029-Danh muc Sach Giao Khoa khoi  6.pdf1029-Danh muc Sach Giao Khoa khoi  6.pdf
1029-Danh muc Sach Giao Khoa khoi 6.pdfQucHHunhnh
 
The Most Excellent Way | 1 Corinthians 13
The Most Excellent Way | 1 Corinthians 13The Most Excellent Way | 1 Corinthians 13
The Most Excellent Way | 1 Corinthians 13Steve Thomason
 
Mastering the Unannounced Regulatory Inspection
Mastering the Unannounced Regulatory InspectionMastering the Unannounced Regulatory Inspection
Mastering the Unannounced Regulatory InspectionSafetyChain Software
 
BASLIQ CURRENT LOOKBOOK LOOKBOOK(1) (1).pdf
BASLIQ CURRENT LOOKBOOK  LOOKBOOK(1) (1).pdfBASLIQ CURRENT LOOKBOOK  LOOKBOOK(1) (1).pdf
BASLIQ CURRENT LOOKBOOK LOOKBOOK(1) (1).pdfSoniaTolstoy
 
Separation of Lanthanides/ Lanthanides and Actinides
Separation of Lanthanides/ Lanthanides and ActinidesSeparation of Lanthanides/ Lanthanides and Actinides
Separation of Lanthanides/ Lanthanides and ActinidesFatimaKhan178732
 
Introduction to AI in Higher Education_draft.pptx
Introduction to AI in Higher Education_draft.pptxIntroduction to AI in Higher Education_draft.pptx
Introduction to AI in Higher Education_draft.pptxpboyjonauth
 
Accessible design: Minimum effort, maximum impact
Accessible design: Minimum effort, maximum impactAccessible design: Minimum effort, maximum impact
Accessible design: Minimum effort, maximum impactdawncurless
 
Paris 2024 Olympic Geographies - an activity
Paris 2024 Olympic Geographies - an activityParis 2024 Olympic Geographies - an activity
Paris 2024 Olympic Geographies - an activityGeoBlogs
 
Web & Social Media Analytics Previous Year Question Paper.pdf
Web & Social Media Analytics Previous Year Question Paper.pdfWeb & Social Media Analytics Previous Year Question Paper.pdf
Web & Social Media Analytics Previous Year Question Paper.pdfJayanti Pande
 
Student login on Anyboli platform.helpin
Student login on Anyboli platform.helpinStudent login on Anyboli platform.helpin
Student login on Anyboli platform.helpinRaunakKeshri1
 
CARE OF CHILD IN INCUBATOR..........pptx
CARE OF CHILD IN INCUBATOR..........pptxCARE OF CHILD IN INCUBATOR..........pptx
CARE OF CHILD IN INCUBATOR..........pptxGaneshChakor2
 

Dernier (20)

Activity 01 - Artificial Culture (1).pdf
Activity 01 - Artificial Culture (1).pdfActivity 01 - Artificial Culture (1).pdf
Activity 01 - Artificial Culture (1).pdf
 
INDIA QUIZ 2024 RLAC DELHI UNIVERSITY.pptx
INDIA QUIZ 2024 RLAC DELHI UNIVERSITY.pptxINDIA QUIZ 2024 RLAC DELHI UNIVERSITY.pptx
INDIA QUIZ 2024 RLAC DELHI UNIVERSITY.pptx
 
Sanyam Choudhary Chemistry practical.pdf
Sanyam Choudhary Chemistry practical.pdfSanyam Choudhary Chemistry practical.pdf
Sanyam Choudhary Chemistry practical.pdf
 
18-04-UA_REPORT_MEDIALITERAСY_INDEX-DM_23-1-final-eng.pdf
18-04-UA_REPORT_MEDIALITERAСY_INDEX-DM_23-1-final-eng.pdf18-04-UA_REPORT_MEDIALITERAСY_INDEX-DM_23-1-final-eng.pdf
18-04-UA_REPORT_MEDIALITERAСY_INDEX-DM_23-1-final-eng.pdf
 
Nutritional Needs Presentation - HLTH 104
Nutritional Needs Presentation - HLTH 104Nutritional Needs Presentation - HLTH 104
Nutritional Needs Presentation - HLTH 104
 
Z Score,T Score, Percential Rank and Box Plot Graph
Z Score,T Score, Percential Rank and Box Plot GraphZ Score,T Score, Percential Rank and Box Plot Graph
Z Score,T Score, Percential Rank and Box Plot Graph
 
“Oh GOSH! Reflecting on Hackteria's Collaborative Practices in a Global Do-It...
“Oh GOSH! Reflecting on Hackteria's Collaborative Practices in a Global Do-It...“Oh GOSH! Reflecting on Hackteria's Collaborative Practices in a Global Do-It...
“Oh GOSH! Reflecting on Hackteria's Collaborative Practices in a Global Do-It...
 
1029-Danh muc Sach Giao Khoa khoi 6.pdf
1029-Danh muc Sach Giao Khoa khoi  6.pdf1029-Danh muc Sach Giao Khoa khoi  6.pdf
1029-Danh muc Sach Giao Khoa khoi 6.pdf
 
The Most Excellent Way | 1 Corinthians 13
The Most Excellent Way | 1 Corinthians 13The Most Excellent Way | 1 Corinthians 13
The Most Excellent Way | 1 Corinthians 13
 
Mastering the Unannounced Regulatory Inspection
Mastering the Unannounced Regulatory InspectionMastering the Unannounced Regulatory Inspection
Mastering the Unannounced Regulatory Inspection
 
BASLIQ CURRENT LOOKBOOK LOOKBOOK(1) (1).pdf
BASLIQ CURRENT LOOKBOOK  LOOKBOOK(1) (1).pdfBASLIQ CURRENT LOOKBOOK  LOOKBOOK(1) (1).pdf
BASLIQ CURRENT LOOKBOOK LOOKBOOK(1) (1).pdf
 
Mattingly "AI & Prompt Design: Structured Data, Assistants, & RAG"
Mattingly "AI & Prompt Design: Structured Data, Assistants, & RAG"Mattingly "AI & Prompt Design: Structured Data, Assistants, & RAG"
Mattingly "AI & Prompt Design: Structured Data, Assistants, & RAG"
 
Separation of Lanthanides/ Lanthanides and Actinides
Separation of Lanthanides/ Lanthanides and ActinidesSeparation of Lanthanides/ Lanthanides and Actinides
Separation of Lanthanides/ Lanthanides and Actinides
 
Código Creativo y Arte de Software | Unidad 1
Código Creativo y Arte de Software | Unidad 1Código Creativo y Arte de Software | Unidad 1
Código Creativo y Arte de Software | Unidad 1
 
Introduction to AI in Higher Education_draft.pptx
Introduction to AI in Higher Education_draft.pptxIntroduction to AI in Higher Education_draft.pptx
Introduction to AI in Higher Education_draft.pptx
 
Accessible design: Minimum effort, maximum impact
Accessible design: Minimum effort, maximum impactAccessible design: Minimum effort, maximum impact
Accessible design: Minimum effort, maximum impact
 
Paris 2024 Olympic Geographies - an activity
Paris 2024 Olympic Geographies - an activityParis 2024 Olympic Geographies - an activity
Paris 2024 Olympic Geographies - an activity
 
Web & Social Media Analytics Previous Year Question Paper.pdf
Web & Social Media Analytics Previous Year Question Paper.pdfWeb & Social Media Analytics Previous Year Question Paper.pdf
Web & Social Media Analytics Previous Year Question Paper.pdf
 
Student login on Anyboli platform.helpin
Student login on Anyboli platform.helpinStudent login on Anyboli platform.helpin
Student login on Anyboli platform.helpin
 
CARE OF CHILD IN INCUBATOR..........pptx
CARE OF CHILD IN INCUBATOR..........pptxCARE OF CHILD IN INCUBATOR..........pptx
CARE OF CHILD IN INCUBATOR..........pptx
 

Level 6 handling data

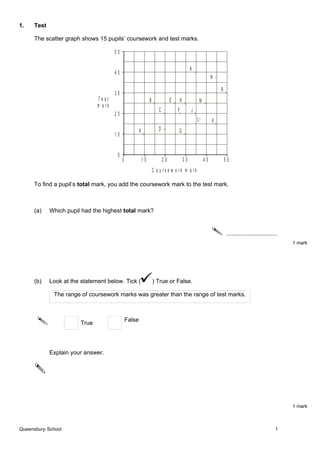
  • 1. 1. Test The scatter graph shows 15 pupils’ coursework and test marks. 50 K 40 × N × R 30 × Te st B× E m a rk × H × M × C F J 20 × × × L× P× A D × G × 10 × 0 0 10 20 30 40 50 C o u rs e w o rk m a rk To find a pupil’s total mark, you add the coursework mark to the test mark. (a) Which pupil had the highest total mark? ............................... 1 mark (b) Look at the statement below. Tick ( ) True or False. The range of coursework marks was greater than the range of test marks. False True Explain your answer. 1 mark Queensbury School 1
  • 2. (c) Pupils with total marks in the shaded region on the graph win a prize. 50 40 30 Te st m a rk 20 10 0 0 10 20 30 40 50 C o u rs e w o rk m a rk What is the smallest total mark needed to win a prize? ............................... 1 mark
  • 3. 2. Test The scatter graph shows 15 pupils’ coursework and test marks. 50 K 40 × N × R 30 × Te st B× E m a rk × H × M × C F J 20 × × × L× P× A D × G × 10 × 0 0 10 20 30 40 50 C o u rs e w o rk m a rk To find a pupil’s total mark, you add the coursework mark to the test mark. (a) Which pupil had the highest total mark? ............................... 1 mark (b) Look at the statement below. Tick ( ) True or False. The range of coursework marks was greater than the range of test marks. No Yes Explain your answer. 1 mark Queensbury School 3
  • 4. (c) Pupils with total marks in the shaded region on the graph win a prize. 50 40 30 Te st m a rk 20 10 0 0 10 20 30 40 50 C o u rs e w o rk m a rk What is the smallest total mark needed to win a prize? ............................... 1 mark (d) Another school has a different rule for pupils to win a prize. Rule: The coursework mark must be 25 or more, and the test mark must be 25 or more, and the total mark must be 65 or more. On the graph below, shade the region of total marks for which pupils would win a prize. 50 40 30 Te st m a rk 20 10 0 0 10 20 30 40 50 C o u rs e w o rk m a rk 2 marks
  • 5. 3. Scatter graphs The scatter graph shows information about trees called poplars. 6 5 4 H e ig h t o f tre e (m ) 3 2 1 0 0 1 2 3 4 5 D ia m e te r o f tr e e tr u n k ( c m ) (a) What does the scatter graph show about the relationship between the diameter of the tree trunk and the height of the tree? 1 mark (b) The height of a different tree is 3 m. The diameter of its trunk is 5 cm. Use the graph to explain why this tree is not likely to be a poplar. Queensbury School 5
  • 6. 1 mark (c) Another tree is a poplar. The diameter of its trunk is 3.2 cm. Estimate the height of this tree. ............................ m 1 mark (d) Below are some statements about drawing lines of best fit on scatter graphs. For each statement, tick ( ) to show whether the statement is True or False. Lines of best fit must always... go through the origin. True False have a positive gradient. True False join the smallest and the largest values. True False pass through every point on the graph. True False 2 marks
  • 7. 4. Mice Three types of mice might come into our homes. Some mice are more likely to be found in homes far from woodland. Others are more likely to be found in homes close to woodland. The bar charts show the percentages of mice that are of each type. Key Y e llo w - n e c k e d m ic e W o o d m ic e H o u s e m ic e T y p e o f m o u s e fo u n d 100 100 80 80 60 60 % % 40 40 20 20 0 0 F a r fro m C lo s e to w o o d la n d w o o d la n d (m o re th a n 5 0 0 m ) ( 5 0 0 m o r le s s ) Queensbury School 7
  • 8. Use the bar charts to answer these questions. (a) About what percentage of mice in homes close to woodland are wood mice? .......................... % 1 mark (b) About what percentage of mice in homes far from woodland are not wood mice? .......................... % 1 mark (c) The black bars show the percentages for house mice. One of the black bars is taller than the other. Does that mean there must be more house mice in homes far from woodland than in homes close to woodland? Tick ( ) Yes or No. True False Explain your answer. 1 mark
  • 9. 5. Glasses There are 60 pupils in a school. 6 of these pupils wear glasses. (a) The pie chart is not drawn accurately. W ear g la s s e s D o not w e a r g la s s e s What should the angles be? Show your working. ........................ ° and ........................° 2 marks (b) Exactly half of the 60 pupils in the school are boys. From this information, what percentage of boys in this school wear glasses? Tick ( ) the correct box below. 5% 6% 10% 20% 50% not possible to tell 1 mark Queensbury School 9
  • 10. 6. Horses The scatter diagram shows the heights and masses of some horses. The scatter diagram also shows a line of best fit. 700 600 M ass (k g ) 500 400 300 140 150 160 170 H e ig h t (c m ) (a) What does the scatter diagram show about the relationship between the height and mass of horses? 1 mark (b) The height of a horse is 163cm. Use the line of best fit to estimate the mass of the horse. .......................... kg 1 mark (c) A different horse has a mass of 625kg. Use the line of best fit to estimate the height of the horse. ......................... cm 1 mark
  • 11. (d) A teacher asks his class to investigate this statement: "The length of the back leg of a horse is always less than the length of the front leg of a horse." What might a scatter graph look like if the statement is correct? Use the axes below to show your answer. 11 0 100 L e n g th o f b a c k le g 9 0 (c m ) 80 70 70 80 90 100 110 L e n g th o f fr o n t le g (c m ) 1 mark Queensbury School 11
  • 12. 7. Shoe laces Some shoes have holes for shoe laces. These holes are called ‘eyes’. Simon has 7 pairs of shoes. The scatter diagram shows information about each pair. 150 × 130 L e n g th o f 11 0 × s h o e la c e (c m ) 90 × 70 × × × 50 × 0 2 4 6 8 10 12 14 16 N u m b e r o f e y e s in th e s h o e (a) Simon buys a pair of shoes. There are 14 eyes in the shoe, and the length of the shoe lace is 130 cm. Draw a cross on the scatter diagram to show this information. 1 mark (b) One of Simon’s pairs of shoes has the wrong length of shoe lace. Which of the crosses on the scatter diagram is most likely to represent this pair of shoes? Circle it. 1 mark (c) A different shoe has 12 eyes. What length of shoe lace do you think it should have? ......................... cm 1 mark