Contenu connexe
Similaire à De assignment-finalized-28112017 4
Similaire à De assignment-finalized-28112017 4 (20)
Plus de Arthur Wilson (20)
De assignment-finalized-28112017 4
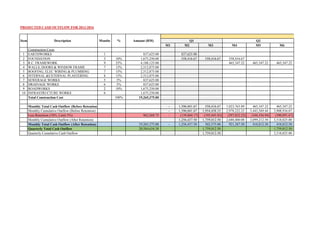
- 1. M1 M2 M3 M4 M5 M6
1 1 837,625.00
2 3 10% 558,416.67 558,416.67 558,416.67
3 9 25% 465,347.22 465,347.22 465,347.22
4 7 15%
5 7 15%
6 8 15%
7 5 5%
8 6 5%
9 2 10%
10 6
100%
- 1,396,041.67 558,416.67 1,023,763.89 465,347.22 465,347.22
- 1,396,041.67 1,954,458.33 2,978,222.22 3,443,569.44 3,908,916.67
- (139,604.17) (195,445.83) (297,822.22) (344,356.94) (390,891.67)
1,256,437.50 1,759,012.50 2,680,400.00 3,099,212.50 3,518,025.00
- 1,256,437.50 502,575.00 921,387.50 418,812.50 418,812.50
1,759,012.50 1,759,012.50
1,759,012.50 3,518,025.00Quarterly Cumulative Cash Outflow
Monthly Total Cash Outflow (Before Retention)
Monthly Cumulative Outflow (Before Retention)
Less Retention (10%, Limit 5%) 963,268.75
Monthly Cumulative Outflow (After Retention)
Monthly Total Cash Outflow (After Retention) 19,265,375.00
Quarterly Total Cash Outflow 20,584,634.38
INFRASTRUCTURE WORKS 1,675,250.00
Total Construction Cost 19,265,375.00
SEWERAGE WORKS 837,625.00
DRAINAGE WORKS 837,625.00
ROADWORKS 1,675,250.00
WALLS, DOORS & WINDOW FRAME 2,512,875.00
ROOFING, ELEC WIRING & PLUMBING 2,512,875.00
INTERNAL &EXTERNAL PLASTERING 2,512,875.00
EARTHWORKS 837,625.00
FOUNDATION 1,675,250.00
R.C. FRAMEWORK 4,188,125.00
Construction Costs
Q1 Q2
PROJECTED CASH OUTFLOW FOR 2013-2016
Item Description Months % Amount (RM)
2013
- 2. 1
2
3
4
5
6
7
8
9
10
Quarterly Cumulative Cash Outflow
Monthly Total Cash Outflow (Before Retention)
Monthly Cumulative Outflow (Before Retention)
Less Retention (10%, Limit 5%)
Monthly Cumulative Outflow (After Retention)
Monthly Total Cash Outflow (After Retention)
Quarterly Total Cash Outflow
INFRASTRUCTURE WORKS
Total Construction Cost
SEWERAGE WORKS
DRAINAGE WORKS
ROADWORKS
WALLS, DOORS & WINDOW FRAME
ROOFING, ELEC WIRING & PLUMBING
INTERNAL &EXTERNAL PLASTERING
EARTHWORKS
FOUNDATION
R.C. FRAMEWORK
Construction Costs
PROJECTED CASH OUTFLOW FOR 2013-2016
Item Description
M7 M8 M9 M10 M11 M12
465,347.22 465,347.22 465,347.22 465,347.22 465,347.22 465,347.22
358,982.14 358,982.14 358,982.14 358,982.14 358,982.14
358,982.14 358,982.14 358,982.14
314,109.38
465,347.22 824,329.37 824,329.37 1,183,311.51 1,183,311.51 1,497,420.88
4,374,263.89 5,198,593.25 6,022,922.62 7,206,234.13 8,389,545.63 9,886,966.52
(437,426.39) (519,859.33) (602,292.26) (720,623.41) (838,954.56) (963,268.75)
3,936,837.50 4,678,733.93 5,420,630.36 6,485,610.71 7,550,591.07 8,923,697.77
418,812.50 741,896.43 741,896.43 1,064,980.36 1,064,980.36 1,373,106.70
1,902,605.36 3,503,067.41
5,420,630.36 8,923,697.77
Q3 Q4
2013
- 3. 1
2
3
4
5
6
7
8
9
10
Quarterly Cumulative Cash Outflow
Monthly Total Cash Outflow (Before Retention)
Monthly Cumulative Outflow (Before Retention)
Less Retention (10%, Limit 5%)
Monthly Cumulative Outflow (After Retention)
Monthly Total Cash Outflow (After Retention)
Quarterly Total Cash Outflow
INFRASTRUCTURE WORKS
Total Construction Cost
SEWERAGE WORKS
DRAINAGE WORKS
ROADWORKS
WALLS, DOORS & WINDOW FRAME
ROOFING, ELEC WIRING & PLUMBING
INTERNAL &EXTERNAL PLASTERING
EARTHWORKS
FOUNDATION
R.C. FRAMEWORK
Construction Costs
PROJECTED CASH OUTFLOW FOR 2013-2016
Item Description
M13 M14 M15 M16 M17 M18 M19
358,982.14 358,982.14
358,982.14 358,982.14 358,982.14 358,982.14
314,109.38 314,109.38 314,109.38 314,109.38 314,109.38 314,109.38 314,109.38
139,604.17 139,604.17
279,208.33 279,208.33 279,208.33
1,032,073.66 1,032,073.66 673,091.52 673,091.52 593,317.71 732,921.88 732,921.88
10,919,040.18 11,951,113.84 12,624,205.36 13,297,296.88 13,890,614.58 14,623,536.46 15,356,458.33
(963,268.75) (963,268.75) (963,268.75) (963,268.75) (963,268.75) (963,268.75) (963,268.75)
9,955,771.43 10,987,845.09 11,660,936.61 12,334,028.13 12,927,345.83 13,660,267.71 14,393,189.58
1,032,073.66 1,032,073.66 673,091.52 673,091.52 593,317.71 732,921.88 732,921.88
2,737,238.84 1,999,331.10
11,660,936.61 13,660,267.71
Q3Q1 Q2
2014
- 4. 1
2
3
4
5
6
7
8
9
10
Quarterly Cumulative Cash Outflow
Monthly Total Cash Outflow (Before Retention)
Monthly Cumulative Outflow (Before Retention)
Less Retention (10%, Limit 5%)
Monthly Cumulative Outflow (After Retention)
Monthly Total Cash Outflow (After Retention)
Quarterly Total Cash Outflow
INFRASTRUCTURE WORKS
Total Construction Cost
SEWERAGE WORKS
DRAINAGE WORKS
ROADWORKS
WALLS, DOORS & WINDOW FRAME
ROOFING, ELEC WIRING & PLUMBING
INTERNAL &EXTERNAL PLASTERING
EARTHWORKS
FOUNDATION
R.C. FRAMEWORK
Construction Costs
PROJECTED CASH OUTFLOW FOR 2013-2016
Item Description
M20 M21 M22 M23 M24
167,525.00 167,525.00 167,525.00 167,525.00 167,525.00
139,604.17 139,604.17 139,604.17 139,604.17
837,625.00
279,208.33 279,208.33 279,208.33
586,337.50 586,337.50 586,337.50 307,129.17 1,005,150.00
15,942,795.83 16,529,133.33 17,115,470.83 17,422,600.00 18,427,750.00
(963,268.75) (963,268.75) (963,268.75) (963,268.75) (963,268.75)
14,979,527.08 15,565,864.58 16,152,202.08 16,459,331.25 17,464,481.25
586,337.50 586,337.50 586,337.50 307,129.17 1,005,150.00
1,905,596.88 1,898,616.67
15,565,864.58 17,464,481.25
Q3 Q4
2014
- 5. 1
2
3
4
5
6
7
8
9
10
Quarterly Cumulative Cash Outflow
Monthly Total Cash Outflow (Before Retention)
Monthly Cumulative Outflow (Before Retention)
Less Retention (10%, Limit 5%)
Monthly Cumulative Outflow (After Retention)
Monthly Total Cash Outflow (After Retention)
Quarterly Total Cash Outflow
INFRASTRUCTURE WORKS
Total Construction Cost
SEWERAGE WORKS
DRAINAGE WORKS
ROADWORKS
WALLS, DOORS & WINDOW FRAME
ROOFING, ELEC WIRING & PLUMBING
INTERNAL &EXTERNAL PLASTERING
EARTHWORKS
FOUNDATION
R.C. FRAMEWORK
Construction Costs
PROJECTED CASH OUTFLOW FOR 2013-2016
Item Description Q2
M25 M26 M27 … M42 M43 M44 M45
First Moiety Second Moiety
837,625.00
837625 0 0 0 0 0 0 0
19,265,375.00 19,265,375.00 19,265,375.00 19,265,375.00 19,265,375.00 19,265,375.00 19,265,375.00 19,265,375.00
(481,634.38) (481,634.38) (481,634.38) (481,634.38) (481,634.38) 0 0 0
18,783,740.63 18,783,740.63 18,783,740.63 18,783,740.63 18,783,740.63 19,265,375.00 19,265,375.00 19,265,375.00
1,319,259.38 - - - - 481,634.38 - -
1,319,259.38 1,319,259.38 481,634.38
18,783,740.63 18,783,740.63 19,265,375.00
-
Q1 Q3
2015 2016