Dtz Property Times Q4 2011
•
1 j'aime•837 vues

DTZ Ukraine has published new quarterly public report about Ukrainian commercial property market. Your feedback is always welcome!

Recommandé
Recommandé
Contenu connexe
Tendances
Tendances (12)
En vedette
Similaire à Dtz Property Times Q4 2011
Similaire à Dtz Property Times Q4 2011 (20)
Dtz Property Times Q4 2011
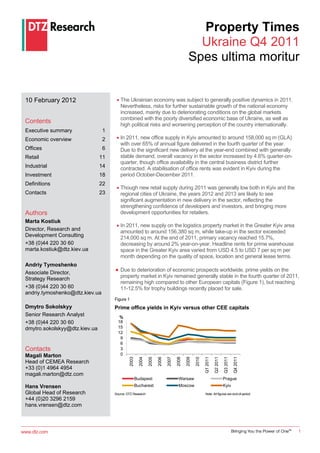
- 1. Property Times Ukraine Q4 2011 Spes ultima moritur 10 February 2012 The Ukrainian economy was subject to generally positive dynamics in 2011. Nevertheless, risks for further sustainable growth of the national economy increased, mainly due to deteriorating conditions on the global markets combined with the poorly diversified economic base of Ukraine, as well as Contents high political risks and worsening perception of the country internationally. Executive summary 1 Economic overview 2 In 2011, new office supply in Kyiv amounted to around 158,000 sq m (GLA) with over 65% of annual figure delivered in the fourth quarter of the year. Offices 6 Due to the significant new delivery at the year-end combined with generally Retail 11 stable demand, overall vacancy in the sector increased by 4.6% quarter-on- quarter, though office availability in the central business district further Industrial 14 contracted. A stabilisation of office rents was evident in Kyiv during the Investment 18 period October-December 2011. Definitions 22 Though new retail supply during 2011 was generally low both in Kyiv and the Contacts 23 regional cities of Ukraine, the years 2012 and 2013 are likely to see significant augmentation in new delivery in the sector, reflecting the strengthening confidence of developers and investors, and bringing more Authors development opportunities for retailers. Marta Kostiuk In 2011, new supply on the logistics property market in the Greater Kyiv area Director, Research and amounted to around 156,380 sq m, while take-up in the sector exceeded Development Consulting 214,000 sq m. At the end of 2011, primary vacancy reached 15.7%, +38 (0)44 220 30 60 decreasing by around 2% year-on-year. Headline rents for prime warehouse marta.kostiuk@dtz.kiev.ua space in the Greater Kyiv area varied from USD 4.5 to USD 7 per sq m per month depending on the quality of space, location and general lease terms. Andriy Tymoshenko Associate Director, Due to deterioration of economic prospects worldwide, prime yields on the Strategy Research property market in Kyiv remained generally stable in the fourth quarter of 2011, remaining high compared to other European capitals (Figure 1), but reaching +38 (0)44 220 30 60 11-12.5% for trophy buildings recently placed for sale. andriy.tymoshenko@dtz.kiev.ua Figure 1 Dmytro Sokolskyy Prime office yields in Kyiv versus other CEE capitals Senior Research Analyst % +38 (0)44 220 30 60 18 dmytro.sokolskyy@dtz.kiev.ua 15 12 9 6 Contacts 3 Magali Marton 0 Q1 2011 Q2 2011 Q3 2011 Q4 2011 2003 2004 2005 2006 2007 2008 2009 2010 Head of CEMEA Research +33 (0)1 4964 4954 magali.marton@dtz.com Budapest Warsaw Prague Hans Vrensen Bucharest Moscow Kyiv Global Head of Research Source: DTZ Research Note: All figures are end-of-period +44 (0)20 3296 2159 hans.vrensen@dtz.com www.dtz.com 1
- 2. Property Times Ukraine Q4 2011 Figure 2 Economic overview Macroeconomic indicators in Ukraine Despite generally positive dynamics in 2011, Ukraine’s % economic growth is expected to slow down in 2012. 40 The year 2011 was marked by active Ukraine’s 30 preparation for the EURO 2012 Football Championship 20 and generally positive economic dynamics in the 10 country (Figure 2). Nevertheless, the international 0 perception of Ukraine worsened owing to legal 2000 2001 2002 2003 2004 2005 2006 2007 2008 2009 2010 2011 2012* proceedings against former Prime Minister Yulia -10 Tymoshenko and other former officials. -20 -30 The present risks for Ukraine’s further economic development include external shocks combined with GDP growth Unemployment the country’s poorly diversified economic base, Inflation Industrial production weakening of domestic and global demand, political Source: Oxford Economics * projections risks related to parliamentary elections in October 2012, augmentation of public debt, increases in borrowing costs and difficulties in attracting finance, According to data of World Steel Association, during possible defaults of private companies, as well as lack the period from 2006 to 2011 Ukraine was the eighth of efficient structural reforms in the country. country in the world in terms of annual steel production. Economic growth In 2011, agricultural output increased by 17.5% year- on-year compared to the 1.5% decrease in 2010, this According to data published by the State Statistics being attributable to the record high harvest in 2011. Committee of Ukraine, real GDP increased by 4.6% year-on-year in the fourth quarter of 2011 compared to Inflation the economic growth of 6.6%, 3.8% and 5.3% in the third, second and first quarters of the year respectively. As a result of the record high harvest and utility tariffs regulation, consumer price inflation reached 4.6% in The preliminary figure of real GDP growth in 2011 is 2011 compared to 9.1% in 2010, 12.3% in 2009 and estimated at around 5.2% year-on-year compared to 22.3% in 2008. This was the lowest increase since 2002. the 4.2% economic growth in 2010. The 2012 State Budget of Ukraine was based on the According to the 2012 State Budget of Ukraine, an projection that consumer price inflation will reach 7.9% increase in real GDP is forecast at 3.9%, while Oxford at the end of the year. Economics projects the 3.4% economic growth for 2012. All other major Ukrainian and international think Major Ukrainian and international experts forecast tanks expect that real GDP growth in Ukraine in 2012 inflation for 2012 in the range from 6.6% to 11%. will be in the range from 1% to 3.5% year-on-year. Unemployment and salaries Industrial production and agriculture In accordance with the ILO methodology (that defines Despite the encouraging start to the year with 11.2% unemployment based on the population 15-70 years of annual growth in industrial production in January- age), unemployment rate in Ukraine amounted to 7.8% February 2011, since March it slowed due to the in January-September 2011 compared to 8.1% in 2010, decline in export-oriented metallurgical and machine 8.8% in 2009 and 6.4% in 2008. Oxford Economics building industries. projects that unemployment rate in Ukraine will further decrease amounting to 7.3% by the end of 2012. The annual increase in industrial production in 2011 amounted to 7.6% year-on-year compared to the 11.2% According to the preliminary data of the State Statistics growth in 2010 and the 21.9% decline in 2009. During Committee of Ukraine, the average nominal monthly the year the highest growth rates were registered in salary in Ukraine in 2011 was UAH 2,633 (equivalent to chemical, machine-building and metallurgical industries. $330) increasing by 17.6% year-on-year. During the period, real salaries grew by 8.7% year-on-year. www.dtz.com 2
- 3. Property Times Ukraine Q4 2011 Retail sales Figure 3 In 2011, retail sales in Ukraine grew by 13.7% year-on- Real monthly salary, retail sales and consumer year compared to the 7.8% annual increase in 2010 spending in Ukraine and the 20.6% annual decrease in 2009 (Figure 3). % 40 Major Ukrainian and international experts expect that 30 retail sales will be subject to less positive dynamics in 2012, with the highest monthly retail sales projected in 20 summer, during the EURO 2012 Football Championship. 10 0 National currency 2000 2001 2002 2003 2004 2005 2006 2007 2008 2009 2010 2011 -10 In accordance with the official US Dollar exchange rate -20 determined by the National Bank of Ukraine, the Ukrainian hryvnia depreciated insignificantly, from -30 Real monthly salary growth 7.95 UAH/USD in January 2011 to 7.99 UAH/USD in Retail sales growth December 2011. Consumer spending growth Source: State Statistics Committee of Ukraine, Oxford Economics The Ukrainian currency also weakened against the Euro from 10.61 UAH/EUR in January 2011 to 11.1 UAH/EUR in March 2011, but strengthened by Figure 4 late December 2011 to 10.3 UAH/EUR. Business sentiment in Ukraine According to the decree issued by the National Bank of 200 Ukraine, from 23 September 2011 the new rules of 150 foreign currency exchange by individuals in Ukraine were introduced to accommodate the requirement to 100 present identity documents prior to each currency 50 exchange transaction, while the limitation to exchange maximum UAH 150,000 per day was set (instead of 0 Q1 Q2 Q3 Q4 Q1 Q2 Q3 Q4 Q1 Q2 Q3 Q4 Q1 Q2 Q3 Q4 Q1 Q2 Q3 Q4 UAH 80,000). -50 2007 2008 2009 2010 2011 Business sentiment -100 According to the survey of business sentiment in Ukraine Businesss sentiment on staff increase conducted by the National Bank since 2006, business General business sentiment index sentiment index remained generally stable in 2010/2011, though worsened compared to 2007/Q3 2008 (Figure 4). Source: National Bank of Ukraine In 2011, general business sentiment in relation to forthcoming 12 months remained generally stable with a minor improvement in the fourth quarter of the year. At the same time, the fourth quarter of 2011 witnessed deterioration of expectations of the surveyed enterprises in relation to their industrial output, as well as inflation and the Ukrainian hryvnia depreciation. Business sentiment on staff increase during the next 12 months improved in the fourth quarter of 2011, as all surveyed enterprises expressed their intentions to increase number of staff, except for those operating in utility sector. www.dtz.com 3
- 4. Property Times Ukraine Q4 2011 International support, cooperation, ratings Figure 5 Since May 2008 Ukraine has been in negotiations with Net FDI and FDI growth in Ukraine the European Union (EU) for a free trade agreement as billion USD %, y-o-y part of a future Association Agreement. During the EU-Ukraine Summit held in December 2011, the 12 390 Association Agreement, including the deep and 10 325 comprehensive free trade area agreement, was not 8 260 6 195 signed, and the perspective for Ukraine to gain EU 4 130 membership remains very vague. According to 2 65 European officials, the main reasons for this were 0 0 deterioration of democracy and the rule of law in Jan-Nov 2011 2001 2002 2003 2004 2005 2006 2007 2008 2009 2010 -2 -65 Ukraine. As stated in the joint declaration adopted at the summit, the EU and Ukraine intend to initial the Association Agreement as soon as possible. From December 2011 through until January 2012 Net FDI Net FDI growth Ukraine was engaged in negotiations with Russia on Source: National Bank of Ukraine prices for energy resources, but failed to secure any price reduction. The Ukrainian authorities declared their intentions to significantly decrease consumption of Foreign trade and foreign direct investment Russian natural gas, as allowed by terms and According to the State Statistics Committee of Ukraine, conditions of the present contract. exports and imports of goods in Ukraine increased during the period January-November 2011 by 34.3% Ukraine failed to receive tranches from the IMF and 38.1% year-on-year respectively. The exports to scheduled in 2011 within the existing Stand-By imports ratio during the period was around 0.83. Arrangement, due to non-compliance with the IMF requirements (complex reforms in the pension system, The National Bank of Ukraine reported that net inflow of increase in gas tariffs for the population). Renewal of foreign direct investment (FDI) into Ukraine amounted financing within the Stand-By Arrangement remains to around USD 5,773 million in January-November uncertain, involving particular actions from the 2011, approximately 19% higher the figure registered Ukrainian authorities required by the IMF. during the same period in 2010 (Figure 5). According to the report ‘Doing Business 2012: Doing The most attractive sectors for foreign investment into Business in a More Transparent World’ (published by Ukraine have been the financial sector, industrial IFC and World Bank in October 2011), Ukraine was production, real estate, retail sector, construction, ranked 152nd out of 183 countries in terms of the transportation and communication. perceived ease of doing business in the country. To compare, in the 2011 report the country was ranked State budget 149th. Nevertheless, Ukraine is believed to have improved in four fields, i.e. ‘Starting a business’, The 2012 State Budget of Ukraine was approved in ‘Paying taxes’, ‘Enforcing contracts’ and ‘Resolving December 2011. insolvency’, but worsened in ‘Trading across borders’. According to the Act of the 2012 State Budget, the In October 2011, Fitch Ratings revised Ukraine's budget deficit has been set at around UAH 25.1 billion, ratings outlook from positive to stable, mainly due to while expenditures and revenues were approved at increase in public and private external borrowing costs, around UAH 358,010 million and UAH 332,821 million possible future challenges to obtain external financing, respectively. The budget is based on the average as well as projected negative impact of further global annual exchange rate for 2012 at 8 UAH/USD. economic slowdown. On the basis of similar considerations exaggerated by perceived political risks and projected weak economic growth, Moody's Investors Service revised Ukraine's outlook from stable to negative in December 2011. www.dtz.com 4
- 5. Property Times Ukraine Q4 2011 EURO 2012 Much attention has been also paid by the country In late 2009, the UEFA Executive Committee confirmed authorities to the improvement and repair of the Donetsk, Lviv and Kharkiv as host cities for group motorways of international importance in Ukraine. matches of UEFA EURO 2012, while Kyiv was appointed the venue of the final match of the Another major benefit for Ukraine hosting EURO 2012 tournament. is the impetus given to tourism in the country. This is very important, taking into account the distinct tourist- Despite existing obstacles such as the after-effects of driven economic base of many major cities of Ukraine the financial crisis, high borrowing costs and imperfect combined with the poorly developed tourist legislation, Ukraine has undertaken a wide spectrum of infrastructure in the country. preparation works for the event. Outlook The hospitality sector, as well as the transportation and The Ukraine economy demonstrated generally positive road system, were initially defined as the priority dynamics in 2011, but 2012 is expected to bring new sectors most in need of significant improvement prior to challenges to the country. UEFA EURO 2012. The areas of particular concern for Ukraine’s future Ukraine adopted a law encouraging hotel development sustainable development presently include expected in July 2010. In accordance with the law, starting from weakening of domestic and global demand, political January 2011, 3*, 4* and 5* hotels that are opened risks related to outstanding parliamentary elections and prior to 1 September 2012 are exempt from income tax political instability, debts repayment by public and for ten years. private sectors, increases in borrowing costs and difficulties in attracting finance, possibility of All stadiums in Ukraine, which will host football matches devaluation of the Ukrainian hryvnia against the hard of EURO 2012, were put into operation by the end of currencies, as well as lack of profound structural 2011. The National Stadium ‘Olimpiyskiy’ in Kyiv reforms in the country and its poorly diversified opened in early October 2011, while grand opening of economic base. the Lviv Stadium took place at the end of the month. The two other stadiums to host group matches of UEFA As forecast by leading Ukrainian and international EURO 2012, i.e. ‘Donbas Arena’ in Donetsk and experts, Ukraine will witness economic growth in a ‘Metallist’ in Kharkiv, have been operational since range from 1% to 3.5% in 2012, depending on the level August 2009 and September 2010 respectively. of domestic consumption and external market conditions, as well as prices for natural gas for Ukraine. Terminal ‘D’ at Boryspil International Airport servicing Kyiv is scheduled for opening in April 2012, while the Institutional reforms combined with the improvement of passenger terminal ‘F’ and renovated passenger inefficient markets for goods and services are terminal ‘B’ have been in operation since October 2010 recognised as being the priority tasks for Ukraine to and September 2011 correspondingly. secure long-term economic development in the country. The trial run of a new passenger terminal at Lviv International Airport commenced in January 2012, and the facility is planned to be put into full-fledged operation in late March 2012. New passenger terminal, VIP terminal and temporary airways terminal for the EURO 2012, as well as new landing strip at Kharkiv International Airport were commissioned in 2010-2011. The first phase of reconstruction of the passenger terminal at Donetsk International Airport was delivered, and the trial test of the facility is planned to start in February 2012. www.dtz.com 5
- 6. Property Times Ukraine Q4 2011 Figure 6 Office Major indicators of office property market in Kyiv High levels of new supply in 2011, but stable demand. sq m % / $ per sq m 1 400 000 80 1 200 000 70 Supply 1 000 000 60 There was approximately 1,276,635 sq m (GLA) of 50 800 000 40 speculatively delivered office stock in Kyiv as of the end 600 000 30 of 2011, excluding government buildings and offices 400 000 20 constructed by owner-occupiers (Figure 6). 200 000 10 0 0 2002 2003 2004 2005 2006 2007 2008 2009 2010 2011 New office supply in Kyiv amounted to approximately 55,060 sq m in the first three quarters of 2011, representing an increase in delivery of over 43% Total stock New supply Take-up compared to the same period in 2010. During the period Vacancy rate Prime rent October-December 2011, new office supply in the city Source: DTZ Research Note: All figures are year-end amounted to around 102,880 sq m (GLA), including the 46,405 sq m (GLA) 101 Tower and the 36,000 sq m Figure 7 (GLA) Premium Centre. Total office stock in Kyiv versus other CEE capitals In 2011, new office supply in Kyiv amounted to around sq m 158,000 sq m (GLA), which is around twice the amount 14 000 000 12 000 000 delivered in 2010. Some of the properties delivered in 10 000 000 2011 were not ready for effective occupation on the 8 000 000 commissioning date. Annual new office supply in 2011 6 000 000 falls in line with DTZ’s projections made in December 4 000 000 2010, but exceeds our subsequent expectations. 2 000 000 0 2010 was marked by the recommencement of works on 2001 2002 2003 2004 2005 2006 2007 2008 2009 2010 2011 several sizeable office schemes, and this has already led to a significant upsurge in new supply in the office Budapest Warsaw Prague property sector in Kyiv in the fourth quarter of 2011. Bucharest Moscow Kyiv Source: DTZ Research Note: All figures are year-end Nevertheless, the office property market in Kyiv remains structurally undersupplied compared to the markets in other CEE capitals in terms of total office stock, as well As of early 2012, around 305,000 sq m (GLA) of as the variety of formats and quality of properties new office space was scheduled for delivery in Kyiv available for occupation (Figure 7). during 2012.From past experience of some delays however, DTZ projects that new office supply is unlikely to exceed 230,000 sq m (GLA) during the year. Table 1 Key office property market indicators in Kyiv 2008 2009 2010 Q1 2011 Q2 2011 Q3 2011 Q4 2011 Outlook Stock (sq m) 916,510 1,040,370 1,118,695 1,139,955 1,163,455 1,173,755 1,276,635 New supply (sq m) 175,110 123,860 78,325 21,260 23,500 10,300 102,880 Take-up (sq m) 160,000 106,000 165,000 43,500 41,800 32,850 35,000 Vacancy rate (%) 4.2 17.6 12.7 13.6 11.9 11.2 15.8 Prime rents (USD / sq m / month) 70-85 25-35 30-38 38-40 38-42 38-44 38-44 Source: DTZ Research Notes: All figures are period-end and due to non-transparency of the market are subject to continued revision. Take-up and vacancy figures do not include sub-lease opportunities. www.dtz.com 6
- 7. Property Times Ukraine Q4 2011 Table 2 Major office schemes delivered in Kyiv in 2011 Period Project Location* Size Developer Major Occupancy** (sq m) occupiers** (%) Q4, 2011 101 Tower C 46,405 KAN Development KAN Stroy, Sport 13 Life, Monaco Q4, 2011 Premium Centre BC NC-WB 36,000 Premium Centre - 0 Bacardi-Martini, 100 Q2, 2011 BC at 7a Klovskyi Uzviz CBD 19,000 Zhytlobud others*** Q1, 2011 Rialto BC NC-WB 15,000 Istil Group Swedbank 57 Q3, 2011 BC at 70 Saksahanskoho Str./ CBD 10,300 Elektrotekh LLC Uniqa 45 16b Pankivska Str. Q4, 2011 UTA Service NC-WB 6,500 UTA Service Kuprum, Olive 39 Line Q4, 2011 Maxim BC CBD 6,350 Aladdin / Rele Invest WND 46 Source: DTZ Research WND – would not disclose * CBD – Central Business District; C – central outside CBD: NC-WB-non-central area on the western bank of Dnipro River, NC-EB-non-central area on the eastern bank of Dnipro River. **As of January 2012. *** Individual office units in the scheme were sold to numerous occupiers. Table 3 Major office projects scheduled for completion in Kyiv in 2012-2013 Project Location* Size (sq m) Developer Developer’s nationality Mariya BC Pechersk 47,300 KAN Development UA Gulliver BC (Parus-2 BC) CBD 43,850 Mandarin Plaza /Tri O UA Toronto-Kyiv BC C 37,670 Toronto-Kyiv UA IQ BC Pechersk 33,950 KAN Development UA Senator NC-WB 30,000 DeVision UA BC at 36 Schorsa Str. Pechersk 27,280 Zhytlobud UA BC at 28 Moskovskyi Ave. NC-WB 23,130 local developer UA Forum Victoria Park BC NC-WB 22,500 Forum Group UA BC at 15 Leiptsihska Str. Pechersk 21,800 Merx UA Sigma BC NC-WB 20,800 Midland Development Ukraine UA Horizon Podil (phase 2) Podil 16,000 ISA Prime Development UA BC at Vasylkivska Str. / Hlushkova Str. NC-WB 13,000 Rele Invest UA City Gate BC (phase 1) NC-EB 13,000 City Capital Group UA Crystal BC NC-EB 9,800 Pervaya Dnepropetrovskaya UA Investitsionnaya Companiya BC at 26/14 Spaska Str. Podil 9,350 Perspektyva Resydencia UA BC at 19 Druzhby Narodiv Bould. Pechersk 7,000 local developer UA BC at 7a Shamryla Str. NC-WB 6,700 Georgiy UA BC at 98 Chervonoarmiyska Str. C 6,300 VS Energy International UA / RUS BC at 28 Smirnova-Lastochkina Str. Podil 5,500 local developer UA Patriarch Hall BC CBD 5,000 local developer UA Source: DTZ Research * CBD – Central Business District; C – central outside CBD; NC-WB – non-central area on the western bank of Dnipro River, NC-EB – non-central area on the eastern bank of Dnipro River www.dtz.com 7
- 8. Property Times Ukraine Q4 2011 Demand Figure 8 Vacancy on the office property market in Kyiv Though Ukraine is still in recovery phase following the by locations global financial crisis of 2008/09, the market fundamentals in the office property sector in Kyiv % continued to improve in the first three quarters of 2011. 40 30 Around 35,000 sq m of office space was transacted in the Kyiv market in the fourth quarter of 2011, representing 20 an annual decrease of around 31%. However, during 10 the first three quarters of 2011 office take-up in the Ukrainian capital amounted to around 118,150 sq m, 0 increasing by around 3% year-on-year. Q4 Q1 Q2 Q3 Q4 Q1 Q2 Q3 Q4 2009 2010 2010 2010 2010 2011 2011 2011 2011 In total, approximately 152,950 sq m of offices was CBD C (outside CBD) Podil Pechersk (outside CBD) transacted in the Kyiv market in 2011, exceeding total NC-WB NC-EB take-up registered in 2009 by over 44%, but remaining Source: DTZ Research generally stable compared to 2008 and 2010. Vacancy Though office demand in Kyiv in 2011 became less Primary market-wide vacancy on the Kyiv office market sector-oriented compared to 2010, it was strongly driven reached 15.8% in late December 2011, increasing from by the companies operating in information & 11.2% at the end of the third quarter 2011 and 12.7% at communication technologies (38% of total take-up the end of 2010, but remaining lower than 17.4% registered during the period), manufacturing (26%, registered at the end of 2009. The increase in vacancy at dominated by FMCG and pharmaceutical production the end of 2011 was mainly due to recently delivered accounting for 4% and 6.8% respectively), financial projects, significant amount of which was not ready for sector (10%) and agriculture (5%). practical occupation. In view of a gradually improving economic situation, but The office availability ratio in the Kyiv central business still favourable office market conditions in Kyiv, many district further decreased in the fourth quarter of 2011, companies moved to a better location/space during 2011, amounting to 6.7% (Figure 8). or expanded / renegotiated current occupational terms with the intention of locking into a longer lease in At the same time, the availability ratio in the central and anticipation of a market uplift. non-central areas outside CBD increased to 33% and 17.4% respectively due to the recent delivery of sizeable In 2011, pre-lets on the Kyiv office property market were office properties in these locations, as well as almost absent due to the availability of opportunities to comparatively small volume and resultant high volatility of occupy space in existing projects. the market (Figure 8). Table 4 Selected major office transactions in Kyiv in 2011 Period Tenant Area (sq m) Occupier sector* Building Location** Q1, 2011 CME / 1+1 TV Channel 10,350 A&M Shchekavytskyi BC Podil Q2, 2011 TNK-BP 5,923 Manufacturing Eleven BC NC-WB Q1, 2011 EPAM Systems 5,300 ICT Vremena Goda BC NC-WB Q2, 2011 Swedbank 4,520 FIRE Rialto BC NC-WB Q1, 2011 Kernel 3,577 Agriculture 92-94 Dmytrivska Str. NC-WB Q1, 2011 VOLIA 3,460 ICT FIM Centre NC-EB Q3, 2011 PwC 3,292 BS Eurasia BC CBD Q3, 2011 Microsoft 2,908 Manufacturing Eurasia BC CBD Q1, 2011 Canadian Embassy 2,264 Embassy 13a Kostelna Str. CBD Q4, 2011 SEB Bank 1,991 FIRE 7 Mykhailivska Str. CBD Source: DTZ Research *FMCG – fast moving consumer goods; FIRE – Finance, Insurance, Real Estate; ICT – Information and Communication Technologies; A&M – Advertising and Media; BS- Business services **CBD – Central Business District, C – central outside the CBD, NC-WB – non-central area on the western bank of Dnipro River, NC-EB – non-central area on the eastern bank of Dnipro River www.dtz.com 8
- 9. Property Times Ukraine Q4 2011 Rents Outlook Between the third quarter of 2008 and late 2009, office New office supply in Kyiv may potentially amount to rents in Kyiv fell by over 50% due to the devaluation of 305,000 sq m (GLA) in 2012. This figure however the national currency and weak occupier demand remains highly sensitive to delivery of several sizeable caused by economic recession in Ukraine and worldwide. properties, commissioning of which may be delayed. In the second half of 2009 the negative dynamics DTZ expects that during 2012 the dynamics of occupier halted, and office rents stabilised at around USD 25-35 demand in Kyiv will remain generally stable, however per sq m per month for prime space, down to USD 20- new supply may start outstripping take-up towards the 25 per sq m per month for central and non-central B- year-end. As stated in the National Bank survey of class space, and USD 12-17 per sq m per month for business sentiment in Ukraine in the fourth quarter of class C. 2011, staff increase was planned in the following 12 months by all enterprises in the country, except for Some rental uplift was evident during the first three utility companies. quarters of 2011, as the supply of particularly prime CBD space has become constrained, combined with In the medium term, many leases signed or renewed in gradually strengthening occupier demand. The fourth 2008/10 on terms favourable to tenants, will expire in quarter of 2011 saw a stabilisation of office rents. one-two years, which may lead to a significant upsurge of take-up, subject to general macroeconomic In late 2011, prime office rents in Kyiv reached conditions. USD 38-44 per sq m per month, while B-class and C-class space commanded monthly rents of USD 23-35 Significant new office supply is planned for delivery in per sq m and USD 8-25 per sq m respectively. Kyiv during 2012-2013, combined with generally stable demand and economic uncertainty. However, DTZ Despite a downwards correction in late 2008, prime expects that the overall vacancy rate will increase office rents in Kyiv area remain higher than those in mainly in the offices located outside CBD, as a number Bucharest, Budapest, Prague and Warsaw, but lower of sizeable centrally-located schemes are constructed than in Moscow (Figure 9). on a build-to-suit basis. As most occupiers remain highly sensitive to capital DTZ projects that during at least the first half of 2012 expenditures, they will continue to require offices in office rents will remain generally stable in Kyiv. Kyiv to be delivered with advanced base build levels. However, we expect that due to expected new supply in the office property sector in Kyiv, average rents may be Figure 9 subject to downward pressure towards the end of 2012 Prime office rents in Kyiv versus other CEE capitals and in 2013. EUR/sq m/month Dynamics of prime office rents in Kyiv in the medium 100 term will be highly sensitive to general macroeconomic 80 conditions in Ukraine and worldwide, as well as pricing 60 strategy of sizeable business centres, such as 40 ‘Gulliver’, ‘101 Tower’ and ‘Toronto-Kyiv’, during 2012. 20 An overpricing of these schemes may lead to continued - upwards pressure on rents, while a more competitive Q1 2011 Q2 2011 Q3 2011 Q4 2011 2001 2002 2003 2004 2005 2006 2007 2008 2009 2010 pricing strategy is likely to result in a softening of prime office rents. Prague Budapest Warsaw In view of the high level of competition anticipated in Bucharest Moscow Kyiv 2012/13, developers can enhance letting prospects in Source: DTZ Research their office properties by either delivering space in more advanced condition, or by being open to alternative solutions addressing the main barrier to relocation, i.e. capital expenditure. www.dtz.com 9
- 10. Property Times Ukraine Q4 2011 www.dtz.com 10
- 11. Property Times Ukraine Q4 2011 Figure 10 Retail Major indicators of retail property market in Kyiv The retail property sector in Ukraine remains the most sq m sq m dynamic and resilient to the effects of economic crisis. 350 000 2 100 000 300 000 1 800 000 Supply 250 000 1 500 000 Total modern retail stock in Kyiv was estimated at 200 000 1 200 000 around 1,001,400 sq m (GLA) in late December 2011, 150 000 900 000 or 359 sq m of modern retail stock per 1,000 100 000 600 000 inhabitants (Figure 10). This figure counts for major 50 000 300 000 retail developments of or, over 5,000 sq m gross 0 0 2001 2002 2003 2004 2005 2006 2007 2008 2009 2010 2011 2012* 2013* lettable area (including multi-tenant retail centres and ‘big box’ single-occupied developments), and reflects a significant undersupply of retail space in the Ukrainian Annual supply Cumulative supply capital, particularly when considering the official versus unofficial population imbalance and grey salary. Source: DTZ Research Note: All figures are year-end Around 75,080 sq m (GLA) of new retail supply was Such formats as retail parks and fashion outlets are yet to delivered in Kyiv in 2011, comprised of the second be delivered in Ukraine. phase of ‘Dream Town’ in Obolon, the hypermarket Novus on Brovarskyi Avenue, as well as four relatively Though new retail supply during 2011 has been rather small neighbourhood retail centres: ‘inSilver’ on low both in Kyiv and the regional cities of Ukraine, 2012 Sribnokilska Street, ‘Kvadrat’ on Onore de Balzaka and 2013 are likely to see significant augmentation in Street, ‘Livoberezhnyi’ on Maryny Raskovoyi Street and new delivery in the sector. ‘Victorio’ on Lvivska Square. In 2012 new retail supply in Kyiv may amount to around As DTZ projected earlier, delivery of the city central 229,000 sq m (GLA), an increase on current retail stock retail and leisure centre ‘Gulliver’ and the retail centre of almost 23%. Schemes planned for delivery in the ‘Mega-City’ (phase 1) was delayed further until 2012. Ukrainian capital during the year include the first phase of ‘Ocean Plaza’ developed by UDP and KAN Development, Major retail schemes delivered in regional cities of ‘Gulliver’ by Mandarin Plaza and Tri O, ‘RayON’ by Ukraine in 2011 included ‘Ave Plaza’ and ‘Magellan’ Arricano Development, the extension of ‘Domosfera’ by (phase 1) in Kharkiv, ‘Passage’ in Dnipropetrovsk, DeVision and ‘Marmalade’ by VKF ‘Mava’. Opening of ‘City Mall’ (phase 2) in Zaporizhzhya ‘Donetsk-City’ ‘Kiev E95 Outlet Centre’ was postponed to spring 2013. (phases 2,3) in Donetsk, ‘Ukraine’ in Mariupol and ‘Galaktyka’ in Kremenchuh. Also, the DIY-stores In regional cities 2012 may see delivery of ‘City Centre’ ‘Epicentre’ opened in Chernihiv, Dnipropetrovsk, in Odessa, as well as extensions of ‘Magellan’ and Simferopol, Sevastopol, Kirovohrad, Mukachevo, ‘French Boulevard’ in Kharkiv, ‘Auchan City Park’ in Kamyanets-Podilskyi and Mariupol. Donetsk and ‘Fabrika’ in Kherson. Table 5 Key retail property market indicators in Kyiv 2007 2008 2009 2010 Q1-Q3 2011 Q4 2011 Outlook Stock (sq m) 534,185 647,885 854,220 926,320 1,001,400 1,001,400 New supply (sq m) 89,200 113,700 206,335 72,100 75,080 0 Prime shopping centre rents 180-220 200-250 120-150 160-200 160-200 160-200 (USD / sq m / month) Prime high street rents 300-350 350-380 100-160 110-220 110-230 110-230 (USD / sq m / month) Source: DTZ Research Notes: All figures are period-end and quoted for retail units of area of 100-300 sq m www.dtz.com 11
- 12. Property Times Ukraine Q4 2011 Demand New Yorker and Oysho stores were opened in both ‘Sky DTZ witnessed further improvement in the general Mall’ in Kyiv and ‘Rivera Shopping City’ in Odessa. demand dynamics of the retail market across Ukraine in The first stores FiNN FLARE, Centro and Noa Noa the first half of 2011. Despite slightly deteriorating opened in Kyiv. In the high-fashion segment, the single- retailers’ perceptions of the Ukraine’s short-term retail brand stores Christian Dior, Ermanno Scervino and potential, triggered by general dynamics on global Trussardi opened within the central areas of Kyiv. markets and political uncertainty in Ukraine, major retailers continued seeking opportunities to expand in the The lack of critical mass of quality retail space throughout country during the last six months of the year. Ukraine prevents a number of major international retailers from entering the market. DTZ believes that the opening Regardless improved performance of the retail market in of stores by such brands as H&M, C&A, Debenhams and Ukraine, the country was not even listed in A.T.Kearney’s Peek&Cloppenburg remains unlikely in the short term. Global Retail Development Index in 2010 and 2011, after being ranked the fifth most attractive retail market in 2007 ‘Big box’ retail operators with reliable sourcing of and the seventeenth in 2008-2009. financing continued to demonstrate high activity in 2011, driven by their development strategies combined with the Being the capital city of Ukraine, Kyiv remains the most widely recognised, largely unexploited potential of the attractive destination for all retailers operating and Ukrainian market and the availability of development land considering entry into the country. Occupancy levels in at comparatively affordable prices. Thus, Metro the most popular, well located quality multi-tenant retail Cash&Carry, Epicentre and Nova Liniya further expanded centres in Kyiv and other major regional cities returned to in Ukraine. A number of food hypermarket operators pre-crisis levels in the first half of 2011 and remained high including Fozzy Group, Auchan, Novus and Amstor, as during the remainder of the year. well as electronics and home appliance chains Comfy and Technolopolis actively expanded in the country, Several new market entries were registered in Ukraine considering occupation in retail developments not only in during 2011. GAP opened its flagship store on major cities of the country with populations over 750,000 Khreshchatyk Street in Kyiv followed by the stores inhabitants, but also in smaller cities. launched in ‘Karavan’ in the capital city and ‘Passage’ in Dnipropetrovsk'. Quality retail operators in Ukraine remain very selective in terms of retail space quality and occupational terms. Table 6 Major multi-tenant retail schemes scheduled for delivery in Ukraine in 2012-2013 Period Project City Size (sq m) Developer Developer’s nationality Q2, 2013 KyivMall Kyiv 75,400 Delice UA Q3, 2012 Ocean Plaza (phase 1) Kyiv 72,200 KAN Development / UDP UA Q1-Q3, 2012 Fabrika (in phases) Kherson 65,500 BUD HOUSE GROUP UA 2013 Retail and leisure centre Kyiv 57,000 BUD HOUSE GROUP UA 2013 Odessa City Odessa 55,000 Amstor UA Q1-Q3, 2013 Aquapark Kyiv 49,070 Vilna Ukrayina UA Q3-Q4, 2012 Magellan (phase 2) Kharkiv 46,500 Kray Property UA Q1-Q2, 2013 Prospekt Kyiv 40,390 Arricano Development UA Q3-Q4, 2012 Marmalade Kyiv 38,700 VKF ‘Mava’ UA Q4, 2012 Domosfera (phase 3) Kyiv 38,000 DeVision UA Q3-Q4, 2013 Forum Lviv Lviv 36,000 Multi Development NTL Q2, 2012 French Boulevard (phase 2) Kharkiv 35,000 Aksioma UA Q1, 2012 City Centre Odessa 33,000 Venford / GMG Development UA 2012 Gulliver (Continental) Kyiv 32,000 Mandarin Plaza /Tri O UA 2012 Auchan City Park (phase 2) Donetsk 26,000 Immochan Ukraine UA / FRA Q2-Q3, 2012 RayON Kyiv 23,000 Arricano Development UA Q1, 2013 Yuzhnaya Galereya (phase 2) Simferopol 19,700 Arricano Development UA Source: DTZ Research www.dtz.com 12
- 13. Property Times Ukraine Q4 2011 Rents Figure 11 With increasing retailer activity in the country and their Dynamics of retail rents in Kyiv improved perception of market potential, the first three USD/sq m/month quarters of 2011 witnessed an upward pressure on prime base rents in quality multi-tenant retail schemes 400 in Kyiv, as well as in the few western-standard retail 350 properties already well-established in other major cities. 300 250 200 During the fourth quarter of 2011 average monthly rents 150 in Kyiv retail schemes remained generally stable at 100 USD 70-90 per sq m for premises of 100-300 sq m, 50 reaching highs of USD 160-200 per sq m per month in 0 the most sought-after prime properties (Figure 11). 2006 2007 2008 2009 2010 2011 Prime high street rent Prime shopping centre rent Similar dynamics was also observed in relation to high street retail rents in Kyiv and other major cities of Source: DTZ Research Note: All figures are year-end and quoted for retail units of areas in the range of 100-300 sq m Ukraine with total population over 750,000 inhabitants. Despite the positive dynamics of an increasing number Outlook of new retailers entering the market and the The retail segment proved to be the most resilient to improvement in activity of companies already operating the effects of economic crisis in 2008/9 compared to in Ukraine, combined with nominal new supply of other property sectors in Ukraine. DTZ believes that the quality retail stock, DTZ does not anticipate any major retail property market will show further growth in the upswing in base rental rates in 2012. This is due to the medium term after global and domestic economic lack of critical mass of new market entries combined conditions further improve. with significant retail stock in pipeline, as well as economic uncertainty both globally and in Ukraine. Despite the remaining signs of the economic crisis and comparatively low incomes of the population, the Though prime retail rents across Ukraine may be potential of the retail property market in Ukraine subject to upward pressure in the short term, the longer undoubtedly remains high because of its immaturity in term sustainability of current rental rates will depend on terms of quality and formats of existing retail schemes, the actual commissioning and quality of new sizeable large country size, high population density, perceived pipeline retail schemes scheduled for completion in high brand awareness and propensity to spend. 2012/13 and general macroeconomic conditions. The opportunities within the retail property sector, over Quality remains a crucial factor for the success of all other sectors, are of priority interest for most developers existing and new retail developments in Ukraine. and investors active in Ukraine, particularly within cities of total population over 750,000 inhabitants. Owing to the deep economic downturn in Ukraine since late 2008, the majority of developers in the country now Active works on a number of sizeable retail projects in accept the fact that only a well-considered approach to Kyiv and the regional cities of Ukraine were selecting an appropriate location, efficient concept and commenced in 2010-2011 and more projects are in thoughtful phasing of a retail development with due delivery pipeline, which, if delivered to current regard to the number and mix of quality retailers and schedules, will lead to a considerable increase in retail their planned expansion into the country, will secure stock in the country by the end of 2013. long-term financial viability and investment exit. As a result, the Ukrainian market will offer more opportunities for retail chain expansion, but localised retail rents will be subject to downward pressure, particularly in poorly conceived first generation retail schemes in light of the strengthening competition within the sector. www.dtz.com 13
- 14. Property Times Ukraine Q4 2011 Figure 12 Industrial & logistics Key market indicators in the Greater Kyiv area In 2012, new supply in the Greater Kyiv area is sq m USD/sq m/ month; % expected to follow the dynamics of 2010 and 2011. 1 500 000 25 1 200 000 20 Supply At the end of 2011, total stock of modern warehousing 900 000 15 and logistics space in the Greater Kyiv area amounted 600 000 10 to approximately 1,332,230 sq m. This figure includes around 119,000 sq m of modern specialised 300 000 5 chilled&frozen and chemical warehouse facilities. 0 0 2002 2003 2004 2005 2006 2007 2008 2009 2010 2011 Similar to 2010, new supply on the logistics property market in the Greater Kyiv area in 2011 reached Total supply Annual speculative supply around 156,380 sq m. During 2011 seven logistics properties were put into operation, four of which were Prime warehousing rents Vacancy delivered in the fourth quarter of the year (Table 8). Source: DTZ Research Note: All figures are period-end The largest logistics scheme delivered in 2011 was the Figure 13 first phase of ‘Amtel Logistics Complex’ developed by ‘International Logistics Company’, affiliated with the Existing logistics stock split by major locations in Russian ‘Amtel Properties’. This property accounted for the Greater Kyiv area, as of late December 2011 around 29% of total modern logistics space delivered to the market in the Greater Kyiv area during the year. M-06 (Kyiv-Zhytomyr) 3% 4% 7% The majority of existing modern warehouse facilities in M-01 (Kyiv-Moscow), 7% Brovary-Boryspil RR the Greater Kyiv area are located along the Kyiv- 29% M-03 (Kyiv-Kharkiv) Zhytomyr Highway (M-06) and in the location referred to as Kyiv-Moscow Highway (M-01) and Brovary- 7% M-07 (Kyiv-Warsaw) Boryspil Ring Road, accounting for over 29% and 25% of total stock respectively (Figure 13). Kyiv City 18% 25% M-05 (Kyiv-Odessa) As of the start of the year, DTZ projects that new logistics supply in 2012 will amount to between 101,000 M-04 (Kyiv-Dnipropetrovsk) sq m and 181,000 sq m (GLA) (Table 9). Other Many warehouse developers in the Greater Kyiv area claimed that they are ready to begin construction of Source: DTZ Research new projects as soon as relatively large tenants for their space are secured, or within built-to-suit contracts. Table 7 Key industrial and logistics property market indicators for the Greater Kyiv area 2007 2008 2009 2010 Q1 2011 Q2 2011 Q3 2011 Q4 2011 Outlook Total supply (sq m)* 384,310 821,780 1,016,600 1,175,850 1,205,365 1,205,365 1,205,365 1,332,230 New supply (sq m)* 199,780 437,470 194,820 159,250 29,515 0 0 126,865 Vacancy (%) 1-2 14.5 20.6 17.9 14.7 13.3 11.6 15.7 Prime rents 10.5 7.5-10 5.5-7 5.5-6.5 5.5-6.5 5.5-6.5 5.5-6.5 5-7 (USD / sq m / month) Source: DTZ Research * Including ancillary office and mezzanine space Note: All figures are period-end www.dtz.com 14
- 15. Property Times Ukraine Q4 2011 Table 8 Major logistics schemes delivered in the Greater Kyiv area in 2011 Scheme Location Total area Developer Nationality Major tenants* Occupancy* (%) (sq m) Amtel Logistics Complex P-04 44,671 International RU - 0 (phase 1) Logistics Company Fruit and Vegetable M-03, E40 40,000 Factor Consults UA WND 65 Logistics Centre (phase 1) Unilogic Park (phase 2) M-01, E95 25,344 Merx Real Estate UA - 0 Arktika Logistics Centre Kyiv RR 16,846 Skandinavia UA Skandinavia-Fish 66 Warehouse complex M-01, E95 15,755 Local developer UA WND 100 Impeco M-07, E373 10,000 Local developer UA WND 100 Santa Frost (phase 2) M-05 3,760 Santa Bremor BLR /GER Eko-market, 100 Ukraine Roshen Source: DTZ Research WND – would not disclose *As of late December 2011 Table 9 Major logistics schemes planned for delivery in the Greater Kyiv area in 2012 Scheme Location Total area (sq m) Developer Nationality Fruit and Vegetable Logistics Centre (phase 2) M-03, E40 40,000 Factor Consults UA Terminal Bucha M-07, E373 31,600 Local developer UA ADG Warehouse complex M-03, E40 30,600 ADG UA V-Log M-01, E95 15,900 AIC BEL Terminal Vorzel M-07, E373 12,400 Local developer UA Source: DTZ Research www.dtz.com 15