Pharmaceutical Market Sizing
•Télécharger en tant que PPT, PDF•
2 j'aime•6,164 vues
Methodological framework for pharmaceutical market sizing, SEE estimations
Signaler
Partager
Signaler
Partager
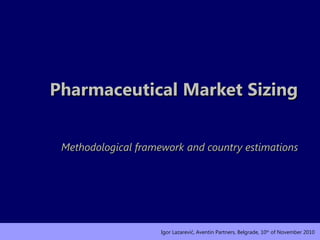
![Pharmaceutical market sizing methodology ,[object Object],[object Object],[object Object],[object Object],[object Object],[object Object],[object Object],[object Object],[object Object],[object Object],[object Object],[object Object],[object Object],[object Object],[object Object],[object Object],[object Object],[object Object],[object Object],MARKET SIZE & MARKET POTENTIAL 4 KEY QUESTIONS: Various data sources (companies, databases, analysis etc)](data:image/gif;base64,R0lGODlhAQABAIAAAAAAAP///yH5BAEAAAAALAAAAAABAAEAAAIBRAA7)
Recommandé
Recommandé
Access to customers is necessary for healthcare marketing and sales initiatives to succeed. Pharmaceutical and medical device manufacturers can optimally position, price and promote their products through strategic assessment of healthcare market segments!
www.healthcaremedicalpharmaceuticaldirectory.com
John G. Baresky
https://www.linkedin.com/in/johngbaresky
John Baresky Healthcare Marketing Leader, Pharmaceutical Marketing, Digital Marketing Strategy, Content Marketing Strategy, Market Access Strategy, Healthcare RPA Software Marketing StrategyHealthcare Brand Management Market Access Concepts - Healthcare Marketing Str...
Healthcare Brand Management Market Access Concepts - Healthcare Marketing Str...Bare Sky Marketing Healthcare Content Writing Services
Contenu connexe
Tendances
Access to customers is necessary for healthcare marketing and sales initiatives to succeed. Pharmaceutical and medical device manufacturers can optimally position, price and promote their products through strategic assessment of healthcare market segments!
www.healthcaremedicalpharmaceuticaldirectory.com
John G. Baresky
https://www.linkedin.com/in/johngbaresky
John Baresky Healthcare Marketing Leader, Pharmaceutical Marketing, Digital Marketing Strategy, Content Marketing Strategy, Market Access Strategy, Healthcare RPA Software Marketing StrategyHealthcare Brand Management Market Access Concepts - Healthcare Marketing Str...
Healthcare Brand Management Market Access Concepts - Healthcare Marketing Str...Bare Sky Marketing Healthcare Content Writing Services
Tendances (20)
Brand Differentiation in the Pharmaceutical Industry
Brand Differentiation in the Pharmaceutical Industry
Digital Pharma: Evolution and Revolution in Marketing & Sales
Digital Pharma: Evolution and Revolution in Marketing & Sales
Launching Pharmaceutical Megabrands - Best Practices
Launching Pharmaceutical Megabrands - Best Practices
Pre-Launch Planning:
Priming Your Pharma Brand For Profit And Success (mini)
Pre-Launch Planning:
Priming Your Pharma Brand For Profit And Success (mini)
Stakeholder's link pharmaceutical and medical devices
Stakeholder's link pharmaceutical and medical devices
Overcoming Barriers to Scale in Digital Therapeutics
Overcoming Barriers to Scale in Digital Therapeutics
Myanmar Pharmaceutical market an Overview and an Opportunity
Myanmar Pharmaceutical market an Overview and an Opportunity
Healthcare Brand Management Market Access Concepts - Healthcare Marketing Str...
Healthcare Brand Management Market Access Concepts - Healthcare Marketing Str...
The coming era of digital therapeutics nrc live - sept 2018
The coming era of digital therapeutics nrc live - sept 2018
Key Stakeholders and the effect of their actions on the Financial Sustainabil...
Key Stakeholders and the effect of their actions on the Financial Sustainabil...
Similaire à Pharmaceutical Market Sizing
China pharmaceutical business market forecast and investment strategy report,...
China pharmaceutical business market forecast and investment strategy report,...Qianzhan Intelligence
China pharmaceutical excipients industry indepth research and investment strategy report, 2013 2018China pharmaceutical excipients industry indepth research and investment stra...
China pharmaceutical excipients industry indepth research and investment stra...Qianzhan Intelligence
China pharmaceutical excipients industryChina pharmaceutical excipients industry indepth research and investment stra...
China pharmaceutical excipients industry indepth research and investment stra...Qianzhan Intelligence
Similaire à Pharmaceutical Market Sizing (20)
Drug of abuse testing market global trends, market share, industry size, grow...
Drug of abuse testing market global trends, market share, industry size, grow...
Pharmaceutical Field Figures in Brazil - Focus Oncology
Pharmaceutical Field Figures in Brazil - Focus Oncology
Orphan drugs market Report with Leading Competitor Analysis, Strategies and F...
Orphan drugs market Report with Leading Competitor Analysis, Strategies and F...
China pharmaceutical business market forecast and investment strategy report,...
China pharmaceutical business market forecast and investment strategy report,...
Migraine Drugs Market by Product Type, Distribution Channel, End User 2024-2032
Migraine Drugs Market by Product Type, Distribution Channel, End User 2024-2032
M&A in pharmaceutical industry between india and italy
M&A in pharmaceutical industry between india and italy
China pharmaceutical excipients industry indepth research and investment stra...
China pharmaceutical excipients industry indepth research and investment stra...
China pharmaceutical excipients industry indepth research and investment stra...
China pharmaceutical excipients industry indepth research and investment stra...
Dernier
Falcon stands out as a top-tier P2P Invoice Discounting platform in India, bridging esteemed blue-chip companies and eager investors. Our goal is to transform the investment landscape in India by establishing a comprehensive destination for borrowers and investors with diverse profiles and needs, all while minimizing risk. What sets Falcon apart is the elimination of intermediaries such as commercial banks and depository institutions, allowing investors to enjoy higher yields.Falcon Invoice Discounting: The best investment platform in india for investors
Falcon Invoice Discounting: The best investment platform in india for investorsFalcon Invoice Discounting
Saudi Arabia [ Abortion pills) Jeddah/riaydh/dammam/++918133066128☎️] cytotec tablets uses abortion pills 💊💊 How effective is the abortion pill? 💊💊 +918133066128) "Abortion pills in Jeddah" how to get cytotec tablets in Riyadh " Abortion pills in dammam*💊💊 The abortion pill is very effective. If you’re taking mifepristone and misoprostol, it depends on how far along the pregnancy is, and how many doses of medicine you take:💊💊 +918133066128) how to buy cytotec pills
At 8 weeks pregnant or less, it works about 94-98% of the time. +918133066128[ 💊💊💊 At 8-9 weeks pregnant, it works about 94-96% of the time. +918133066128) At 9-10 weeks pregnant, it works about 91-93% of the time. +918133066128)💊💊 If you take an extra dose of misoprostol, it works about 99% of the time. At 10-11 weeks pregnant, it works about 87% of the time. +918133066128) If you take an extra dose of misoprostol, it works about 98% of the time. In general, taking both mifepristone and+918133066128 misoprostol works a bit better than taking misoprostol only. +918133066128 Taking misoprostol alone works to end the+918133066128 pregnancy about 85-95% of the time — depending on how far along the+918133066128 pregnancy is and how you take the medicine. +918133066128 The abortion pill usually works, but if it doesn’t, you can take more medicine or have an in-clinic abortion. +918133066128 When can I take the abortion pill?+918133066128 In general, you can have a medication abortion up to 77 days (11 weeks)+918133066128 after the first day of your last period. If it’s been 78 days or more since the first day of your last+918133066128 period, you can have an in-clinic abortion to end your pregnancy.+918133066128
Why do people choose the abortion pill? Which kind of abortion you choose all depends on your personal+918133066128 preference and situation. With+918133066128 medication+918133066128 abortion, some people like that you don’t need to have a procedure in a doctor’s office. You can have your medication abortion on your own+918133066128 schedule, at home or in another comfortable place that you choose.+918133066128 You get to decide who you want to be with during your abortion, or you can go it alone. Because+918133066128 medication abortion is similar to a miscarriage, many people feel like it’s more “natural” and less invasive. And some+918133066128 people may not have an in-clinic abortion provider close by, so abortion pills are more available to+918133066128 them. +918133066128 Your doctor, nurse, or health center staff can help you decide which kind of abortion is best for you. +918133066128 More questions from patients: Saudi Arabia+918133066128 CYTOTEC Misoprostol Tablets. Misoprostol is a medication that can prevent stomach ulcers if you also take NSAID medications. It reduces the amount of acid in your stomach, which protects your stomach lining. The brand name of this medication is Cytotec®.+918133066128) Unwanted Kit is a combination of two medicines, ounwanted pregnancy Kit [+918133066128] Abortion Pills IN Dubai UAE Abudhabi
unwanted pregnancy Kit [+918133066128] Abortion Pills IN Dubai UAE AbudhabiAbortion pills in Kuwait Cytotec pills in Kuwait
Dernier (20)
Eluru Call Girls Service ☎ ️93326-06886 ❤️🔥 Enjoy 24/7 Escort Service
Eluru Call Girls Service ☎ ️93326-06886 ❤️🔥 Enjoy 24/7 Escort Service
FULL ENJOY Call Girls In Majnu Ka Tilla, Delhi Contact Us 8377877756
FULL ENJOY Call Girls In Majnu Ka Tilla, Delhi Contact Us 8377877756
Call Now ☎️🔝 9332606886🔝 Call Girls ❤ Service In Bhilwara Female Escorts Serv...
Call Now ☎️🔝 9332606886🔝 Call Girls ❤ Service In Bhilwara Female Escorts Serv...
Call Girls Service In Old Town Dubai ((0551707352)) Old Town Dubai Call Girl ...
Call Girls Service In Old Town Dubai ((0551707352)) Old Town Dubai Call Girl ...
Insurers' journeys to build a mastery in the IoT usage
Insurers' journeys to build a mastery in the IoT usage
Call Girls Jp Nagar Just Call 👗 7737669865 👗 Top Class Call Girl Service Bang...
Call Girls Jp Nagar Just Call 👗 7737669865 👗 Top Class Call Girl Service Bang...
👉Chandigarh Call Girls 👉9878799926👉Just Call👉Chandigarh Call Girl In Chandiga...
👉Chandigarh Call Girls 👉9878799926👉Just Call👉Chandigarh Call Girl In Chandiga...
Uneak White's Personal Brand Exploration Presentation
Uneak White's Personal Brand Exploration Presentation
Nelamangala Call Girls: 🍓 7737669865 🍓 High Profile Model Escorts | Bangalore...
Nelamangala Call Girls: 🍓 7737669865 🍓 High Profile Model Escorts | Bangalore...
Enhancing and Restoring Safety & Quality Cultures - Dave Litwiller - May 2024...
Enhancing and Restoring Safety & Quality Cultures - Dave Litwiller - May 2024...
Chandigarh Escorts Service 📞8868886958📞 Just📲 Call Nihal Chandigarh Call Girl...
Chandigarh Escorts Service 📞8868886958📞 Just📲 Call Nihal Chandigarh Call Girl...
Mysore Call Girls 8617370543 WhatsApp Number 24x7 Best Services
Mysore Call Girls 8617370543 WhatsApp Number 24x7 Best Services
Falcon Invoice Discounting: The best investment platform in india for investors
Falcon Invoice Discounting: The best investment platform in india for investors
The Path to Product Excellence: Avoiding Common Pitfalls and Enhancing Commun...
The Path to Product Excellence: Avoiding Common Pitfalls and Enhancing Commun...
unwanted pregnancy Kit [+918133066128] Abortion Pills IN Dubai UAE Abudhabi
unwanted pregnancy Kit [+918133066128] Abortion Pills IN Dubai UAE Abudhabi
B.COM Unit – 4 ( CORPORATE SOCIAL RESPONSIBILITY ( CSR ).pptx
B.COM Unit – 4 ( CORPORATE SOCIAL RESPONSIBILITY ( CSR ).pptx
Call Girls In Noida 959961⊹3876 Independent Escort Service Noida
Call Girls In Noida 959961⊹3876 Independent Escort Service Noida
Call Girls In Panjim North Goa 9971646499 Genuine Service
Call Girls In Panjim North Goa 9971646499 Genuine Service
Pharmaceutical Market Sizing
- 1. Pharmaceutical Market Sizing Methodological framework and country estimations
- 4. SEE pharma market in 2009 In million USD 1) Source: Espicom Business Intelligence, The World Pharmaceutical Markets Fact Book 2009 (estimated data, adopted) 2) Source: World Health Organization, World Health Statistics 2010 (actual data) 3) Analysis performed by Aventin Partners All data (except WHO data) are estimated and adopted in order to compare markets 7,6% 8,4% 12% 8,0% 19,5% 2,171 Sub-total / Average n/a 7,0% 13% 0,5% 1,3% 140 Albania n/a 8,9% 12% 0,2% 0,5% 55 Montenegro n/a 7,1% 13% 0,5% 1,1% 125 Macedonia n/a 9,8% 11% 0,8% 1,9% 210 Bosnia and Herzegovina 7,3% 7,6% 10% 3,3% 8,2% 910 Croatia 7,8% 9,9% 13% 2,7% 6,6% 731 Serbia 7,6% 7,7% 10,7% 40,7% 100,0% 11,126 SEE 7,7% 7,0% 9,4% 32,8% 80,5% 8,955 Sub-total / Average 7,6% 7,4% 10% 9,8% 24,0% 2,669 Hungary 9,8% 7,9% 8% 10,9% 26,7% 2,974 Greece 8,5% 7,8% 9% 3,4% 8,3% 923 Slovenia 5,7% 4,7% 12% 6,9% 17,0% 1,886 Romania 6,9% 7,3% 8% 1,8% 4,5% 502 Bulgaria 100,0% % of CEE 245,4% % of SEE n/a HC Expenditures 2007 (% of GDP) 2 10% 2009-2014 CAGR 1 6,0% HC Expenditures 2009 (% of GDP) 1 27,306 CEE Country Pharmaceutical Market Size 2009 1