Sea level rise map from open data intro
•
0 j'aime•111 vues

Intro page to DIY manual for Climate Emergency mapping Full text https://bit.ly/376wnnj

Recommandé
Contenu connexe
Plus de Andrew Zolnai
Plus de Andrew Zolnai (20)
Dernier
Dernier (20)
Sea level rise map from open data intro
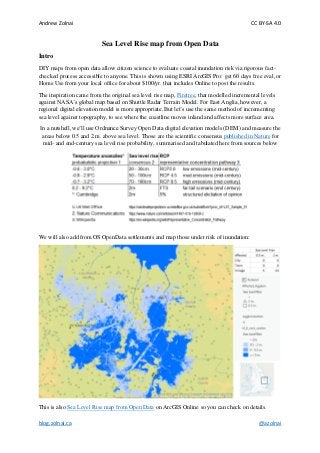
- 1. Andrew Zolnai CC BY-SA 4.0 blog.zolnai.ca @azolnai Sea Level Rise map from Open Data Intro DIY maps from open data allow citizen science to evaluate coastal inundation risk via rigorous fact- checked process accessible to anyone. This is shown using ESRI ArcGIS Pro: get 60 days free eval, or Home Use from your local office for about $100/yr. that includes Online to post the results. The inspiration came from the original sea level rise map, Firetree, that modelled incremental levels against NASA’s global map based on Shuttle Radar Terrain Model. For East Anglia, however, a regional digital elevation model is more appropriate. But let’s use the same method of incrementing sea level against topography, to see where the coastline moves inland and affects more surface area. In a nutshell, we’ll use Ordnance Survey Open Data digital elevation models (DEM) and measure the areas below 0.5 and 2 m. above sea level. Those are the scientific consensus published in Nature for mid- and end-century sea level rise probability, summarised and tabulated here from sources below We will also add from OS OpenData settlements and map those under risk of inundation: This is also Sea Level Rise map from Open Data on ArcGIS Online so you can check on details.