Financials for Jermyn Street School
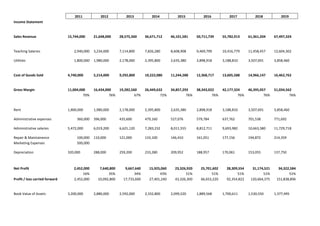
- 1. 201120122013201420152016201720182019Income StatementSales Revenue 15,744,000 21,648,000 28,575,360 36,671,712 46,101,581 50,711,739 55,782,913 61,361,204 67,497,324 Teaching Salaries2,940,000 3,234,000 7,114,800 7,826,280 8,608,908 9,469,799 10,416,779 11,458,457 12,604,302 Utilities1,800,000 1,980,000 2,178,000 2,395,800 2,635,380 2,898,918 3,188,810 3,507,691 3,858,460 Cost of Goods Sold 4,740,000 5,214,000 9,292,800 10,222,080 11,244,288 12,368,717 13,605,588 14,966,147 16,462,762 Gross Margin 11,004,000 16,434,000 19,282,560 26,449,632 34,857,293 38,343,022 42,177,324 46,395,057 51,034,562 70%76%67%72%76%76%76%76%76%Rent 1,800,000 1,980,000 2,178,000 2,395,800 2,635,380 2,898,918 3,188,810 3,507,691 3,858,460 Administrative expenses360,000 396,000 435,600 479,160 527,076 579,784 637,762 701,538 771,692 Administrative salaries 5,472,000 6,019,200 6,621,120 7,283,232 8,011,555 8,812,711 9,693,982 10,663,380 11,729,718 Repair & Maintainence100,000 110,000 121,000 133,100 146,410 161,051 177,156 194,872 214,359 Marketing Expenses500,000Depreciation 320,000 288,000 259,200 233,280 209,952 188,957 170,061 153,055 137,750 Net Profit2,452,0007,640,8009,667,64015,925,06023,326,92025,701,60228,309,55431,174,52134,322,58416%35%34%43%51%51%51%51%51%Profit / loss carried forward2,452,00010,092,80017,733,60027,401,24043,326,30066,653,22092,354,822120,664,375151,838,896Book Value of Assets 3,200,000 2,880,000 2,592,000 2,332,800 2,099,520 1,889,568 1,700,611 1,530,550 1,377,495 <br />