Accidents in the Workplace - Statistics from the UK
•
0 j'aime•696 vues

How often do accidents occur at work, and how often are they fatal? What are the most common cause, and which industries are the riskiest? Find it all out here.

Recommandé
Contenu connexe
Similaire à Accidents in the Workplace - Statistics from the UK
Similaire à Accidents in the Workplace - Statistics from the UK (20)
Plus de Banner Jones Solicitors
Plus de Banner Jones Solicitors (11)
Dernier
Dernier (20)
Accidents in the Workplace - Statistics from the UK
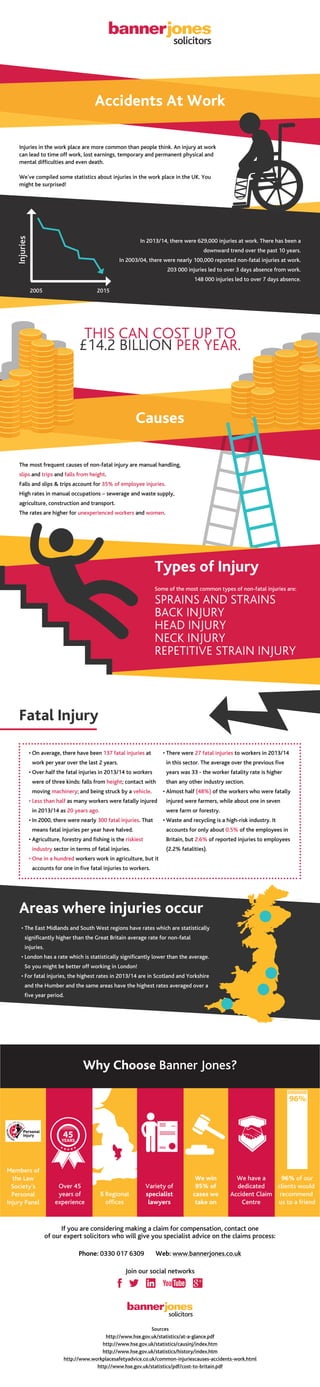
- 1. 5 Regional offices We have a dedicated Accident Claim Centre We win 95% of cases we take on 96% of our clients would recommend us to a friend 96% Over 45 years of experience Variety of specialist lawyers Members of the Law Society's Personal Injury Panel 45YEARS Why Choose Banner Jones? Accidents At Work Causes Injuries in the work place are more common than people think. An injury at work can lead to time off work, lost earnings, temporary and permanent physical and mental difficulties and even death. We’ve compiled some statistics about injuries in the work place in the UK. You might be surprised! The most frequent causes of non-fatal injury are manual handling, slips and trips and falls from height. Falls and slips & trips account for 35% of employee injuries. High rates in manual occupations – sewerage and waste supply, agriculture, construction and transport. The rates are higher for unexperienced workers and women. Phone: 0330 017 6309 Web: www.bannerjones.co.uk Join our social networks If you are considering making a claim for compensation, contact one of our expert solicitors who will give you specialist advice on the claims process: In 2013/14, there were 629,000 injuries at work. There has been a downward trend over the past 10 years. In 2003/04, there were nearly 100,000 reported non-fatal injuries at work. 203 000 injuries led to over 3 days absence from work. 148 000 injuries led to over 7 days absence. THIS CAN COST UP TO £14.2 BILLION PER YEAR. Types of Injury Some of the most common types of non-fatal injuries are: SPRAINS AND STRAINS BACK INJURY HEAD INJURY NECK INJURY REPETITIVE STRAIN INJURY Fatal Injury • On average, there have been 137 fatal injuries at work per year over the last 2 years. • Over half the fatal injuries in 2013/14 to workers were of three kinds: falls from height; contact with moving machinery; and being struck by a vehicle. • Less than half as many workers were fatally injured in 2013/14 as 20 years ago. • In 2000, there were nearly 300 fatal injuries. That means fatal injuries per year have halved. • Agriculture, forestry and fishing is the riskiest industry sector in terms of fatal injuries. • One in a hundred workers work in agriculture, but it accounts for one in five fatal injuries to workers. • There were 27 fatal injuries to workers in 2013/14 in this sector. The average over the previous five years was 33 ‑ the worker fatality rate is higher than any other industry section. • Almost half (48%) of the workers who were fatally injured were farmers, while about one in seven were farm or forestry. • Waste and recycling is a high-risk industry. It accounts for only about 0.5% of the employees in Britain, but 2.6% of reported injuries to employees (2.2% fatalities). Areas where injuries occur • The East Midlands and South West regions have rates which are statistically significantly higher than the Great Britain average rate for non-fatal injuries. • London has a rate which is statistically significantly lower than the average. So you might be better off working in London! • For fatal injuries, the highest rates in 2013/14 are in Scotland and Yorkshire and the Humber and the same areas have the highest rates averaged over a five year period. Sources http://www.hse.gov.uk/statistics/at-a-glance.pdf http://www.hse.gov.uk/statistics/causinj/index.htm http://www.hse.gov.uk/statistics/history/index.htm http://www.workplacesafetyadvice.co.uk/common-injuriescauses-accidents-work.html http://www.hse.gov.uk/statistics/pdf/cost-to-britain.pdf 2005 2015