FIE 2015 Judson Presentation Collofello Effect
•Télécharger en tant que PPTX, PDF•
1 j'aime•313 vues


Recommandé
Recommandé
Contenu connexe
En vedette
En vedette (20)
Similaire à FIE 2015 Judson Presentation Collofello Effect
Similaire à FIE 2015 Judson Presentation Collofello Effect (20)
FIE 2015 Judson Presentation Collofello Effect
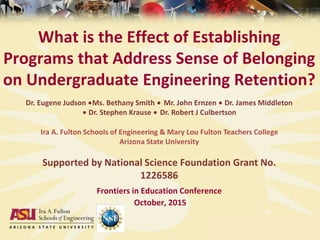
- 1. What is the Effect of Establishing Programs that Address Sense of Belonging on Undergraduate Engineering Retention? Frontiers in Education Conference October, 2015 Dr. Eugene Judson ∙Ms. Bethany Smith ∙ Mr. John Ernzen ∙ Dr. James Middleton ∙ Dr. Stephen Krause ∙ Dr. Robert J Culbertson Ira A. Fulton Schools of Engineering & Mary Lou Fulton Teachers College Arizona State University Supported by National Science Foundation Grant No. 1226586
- 2. Why is There a Need to Address Sense of Belonging in Engineering? Engineering 2-Year Persistence and 4-Year & 6-Year Graduation Rates 2007 Cohort: 50% depart in first 2 years and 8% depart in last 4 years OR 85% departure of all leavers occur in first 2 years and 15% in last 4 years Conclusions: Strong need for increase in evidence-based retention interventions Effectiveness of innovations may begin to be assessed after 2 years First Time Freshman 2-Year Persistence Rate 4-Year Graduation Rate 6-Year Graduation Rate 1998 644 45% 11% 34% 2004 765 50% 18% 38% 2007 720 50% 26% 42% 2009 890 57% 32% NA 2011 1197 58% NA NA 2014 2450 NA NA NA 2
- 3. How Does 2-Year Persistence Correlate to 6-Year Graduation Rate? Conclusions: 2-year persistence is a good predictor of 6-year graduation rate Significant differences exist between disciplines 3
- 4. 2007: A New Suite of Strategies • Co-Curricular Experiences (research opportunities, engineering camp, professional societies) • Course Curricular Experiences (two mandatory introductory courses focused on study skills and beginning design) • Student Support Programs (residential community, tutoring center, undergraduate teaching assistants) • Purpose: To keep status quo in retention, in spite of increasing enrollment
- 5. Research Question and Methods • What is the effect of establishing programs that address sense of belonging? • We focused on 2-year retention – High correlation with graduation – Using ASU online database, examined . . . • entire engineering student body, then • by gender • by ethnicity
- 6. 2-Year Engineering Retention 47.7% Retained 2 Years 1998 - 2006 Freshmen Freshmen Freshmen 56.5% Retained 2 Years 2007 - 2014 Freshmen Freshmen Freshmen
- 7. 26.3% Graduated in Engineering within 4 Years, 1998 - 2006 Freshmen Freshmen Freshmen 39.2% Graduated in Engineering within 4 Years, 2007 - 2010 Freshmen Freshmen Freshmen 4-Year Engineering Graduation Rate
- 8. 34.9% Graduated in Engineering within 6 Years, 1998 - 2006 Freshmen Freshmen Freshmen 43.5% Graduated in Engineering within 6 Years, 2007 & 2008 Freshmen Freshmen Freshmen 6-Year Engineering Graduation Rate
- 9. 2-Year Retention, Overall Retention in engineering at ASU has been increasing since 1998.
- 10. Before Reforms Retention rate was on the rise during these years at a rate of 0.9% per year.
- 11. After Reforms The rate of increasing retention rose to an average of 1.6% per year.
- 12. Before Reforms, By Gender The rate of retention was 0.6%/year for women and 1.0%/year for men.
- 13. After Reforms, By Gender The rate of retention growth increased for males (1.0% to 1.9% per year) but stayed the same for females (0.6% per year).
- 14. Before Reforms, By Ethnicity The growth in retention rates were similar for both groups. Overall retention for URMs (underrepresented minorities) was consistently lower than that of Asian and White students.
- 15. After Reforms, By Ethnicity Average increase in retention grew by about 0.4% per year for both groups. The gap in the retention rates, however, did not close.
- 16. Conclusions • 2007 strategies seem to have increased the rate at which retention is growing – Increased retention has been paralleled by rising graduation rates – Simultaneous with growing class size • Possible future investigation: different effects across the subgroups – Large jump for males, little to no effect for females? – Did not close or shrink retention gap between minority groups?