Diva-Thane European Call Girls Number-9833754194-Diva Busty Professional Call...
Short term persistence in mutual fund performance(12)
1. Short-Term Persistence in Mutual Fund
Performance
Nicolas P. B. Bollen
Vanderbilt University
Jeffrey A. Busse
Emory University
We estimate parameters of standard stock selection and market timing models using
daily mutual fund returns and quarterly measurement periods. We then rank funds
quarterly by abnormal return and measure the performance of each decile the
following quarter. The average abnormal return of the top decile in the post-ranking
quarter is 39 basis points. The post-ranking abnormal return disappears when funds
are evaluated over longer periods. These results suggest that superior performance is
a short-lived phenomenon that is observable only when funds are evaluated several
times a year.
The net new cash flow invested in U.S. mutual funds in 2000 was $229.2
billion, which exceeded the 2000 gross domestic product of all but 19
countries.1 Not surprisingly, a large industry exists to provide investors
with information to help them choose from among the thousands of
available mutual funds. The existence of the mutual fund selection indus-
try is predicated on the assumptions that some mutual fund managers
possess significant ability and that this ability persists, allowing the astute
investor to predict future performance based on past results.
From an academic perspective, assessing the existence and persistence
of mutual fund managerial ability is an important test of the efficient
market hypothesis; evidence of persistent ability would support a rejection
of its semi-strong form. What should we expect in equilibrium? Grossman
and Stiglitz (1980) argue that we should not expect that security prices
fully reflect the information of informed individuals; otherwise, there
would be no reward for the costly endeavor of seeking new information.
In the context of mutual fund performance, we should expect some fund
We thank two anonymous referees, Jonathan Berk, John Heaton (the editor), Michael Lemmon, Jeffrey
Pontiff, and seminar participants at the 2001 Western Finance Association meetings in Tucson,
Georgetown University, the University of Maryland, Rice University, the University of Utah, and
Vanderbilt University. Address correspondence to: Jeffrey A. Busse, Goizueta Business School, Emory
University, 1300 Clifton Rd., Atlanta, GA 30322-2722, or e-mail: Jeff_Busse@bus.emory.edu.
1
Net new cash flow is defined as the dollar value of new sales minus redemptions, combined with net
exchanges, and is obtained from the Investment Company Institute’s 2001 Mutual Fund Fact Book, http://
www.ici.org. Gross domestic product data is from the World Bank, http://www.worldbank.org.
The Review of Financial Studies Vol. 18, No. 2 ª 2004 The Society for Financial Studies; all rights reserved.
doi:10.1093/rfs/hhi007 Advance Access publication August 25, 2004
2. The Review of Financial Studies / v 18 n 2 2004
managers to possess an informational advantage, but over what horizon?
Berk and Green (2004) show theoretically that a fund manager’s informa-
tional advantage will be short-lived when investors direct their capital
to recent winners. The goal of this article, therefore, is to determine
empirically whether ability persists over a relatively short horizon.
Studies of ability focus on two types of managerial activity. Stock
selection refers to predicting returns of individual stocks; market timing
refers to predicting relative returns of broad asset classes. Prior studies
generally share two features. First, most use monthly returns. Second,
with some exceptions, the majority of studies find little evidence that fund
managers generate positive abnormal returns over long horizons by fol-
lowing either a stock selection or a market timing strategy. Examples
include Jensen (1969) and Elton et al. (1992) for stock selection over
periods of 10–20 years, and Treynor and Mazuy (1966) and Henriksson
(1984) for market timing over periods of 6–10 years.
A number of studies, however, find evidence that stock selection ability
persists over periods as short as one year. These studies find that although
funds on average generate negative abnormal returns, relative
performance persists. Persistence studies include Hendricks, Patel, and
Zeckhauser (1993), Goetzmann and Ibbotson (1994), Brown and
Goetzmann (1995), Grinblatt, Titman, and Wermers (1995), Gruber
(1996), Carhart (1997), Daniel et al. (1997), Nofsinger and Sias (1999),
Wermers (1999), and Grinblatt and Keloharju (2000). Most of these
articles attribute persistence at least in part to fund manager skill.
Grinblatt, Titman, and Wermers (1995) and Carhart (1997), however,
argue that the superior performance of top funds is a result of the
momentum effect of Jegadeesh and Titman (1993). After including a
momentum factor in his return model, Carhart finds that persistence
largely disappears, except among the lowest performers, where it arises
from persistently high expenses. This result suggests that fund managers
possess little stock selection skill, since the top performing funds generate
their superior returns simply by holding stocks that have recently had
high returns.
In this article, we revisit the issue of persistence in mutual fund perform-
ance and focus on a relatively short measurement period of three months.
To the extent that superior performance is short-lived, perhaps due to the
competitive nature of the mutual fund industry [see Berk and Green
(2004)] or to managerial turnover [see Chevalier and Ellison (1999)], a
short measurement horizon provides a more precise method of identifying
top performers. Analysis of quarterly periods is not possible with monthly
returns because the short time series of observations precludes efficient
estimation. For this reason we use daily mutual fund returns.
We start by estimating parameters of standard stock selection and
market timing models over subsets of our mutual fund return data. For
570
3. Mutual Fund Performance
each quarter in the sample except the last, we rank funds by their esti-
mated abnormal return and form deciles. We then compute the abnormal
return generated by each decile the following quarter. We find a statisti-
cally significant abnormal return for the top decile in the post-ranking
quarter of 25–39 basis points, depending on whether we use a stock
selection or a market timing model.
Our use of daily returns and three-month measurement periods con-
tributes to the literature on mutual fund performance in two ways. For the
first time, we provide evidence regarding short-term persistence. We find
that the top decile of fund managers generates statistically significant
quarterly abnormal returns that persist for the following quarter. The
economic significance of the post-ranking abnormal returns is question-
able, however, given the transaction costs and taxes levied on a strategy of
capturing the persistent abnormal returns of the top decile. Second, we
address a potential source of misspecification that may have biased prior
studies against finding superior performance. In particular, the type of
strategy followed by a given mutual fund is unobservable, and may change
over time. In one version of our experiment, we allow for the coexistence
of stock selection and market timing strategies, and we allow fund
managers to switch strategies over time.
In order to reconcile our results with those of Carhart (1997), we
document how our results change when we modify our experiment by
mimicking aspects of Carhart’s procedure that differ from ours. First,
Carhart ranks by prior year return and by prior three-year abnormal
return, whereas we rank by prior quarter abnormal return. When we
rank on prior return instead of abnormal return, the abnormal return in
the post-ranking quarter disappears. Our selection procedure apparently
identifies a different set of funds. Second, Carhart measures post-ranking
performance over a 31-year horizon using a concatenated time series of
post-ranking returns. In contrast, we estimate post-ranking performance
over three-month horizons and average the results in the spirit of Fama
and MacBeth (1973). When we construct a concatenated time series of the
top decile’s post-ranking returns, the abnormal return again disappears.
To understand why the abnormal return disappears with a concate-
nated time series, we record the quarterly returns of each factor in our
performance models over the entire concatenated series, as well as the
average factor loadings of the top decile every quarter. The covariance
between each factor return and the corresponding factor loading is nega-
tive. This suggests that although the top fund managers exhibit short-term
stock selection and market timing ability, they suffer from perverse factor
timing over a longer horizon. These results are consistent with the fund
flow literature, which shows that the positive relation between fund
returns and subsequent investor cash flow generates negative estimates
of market timing.
571
4. The Review of Financial Studies / v 18 n 2 2004
The rest of the article is organized as follows. Section 1 reviews the
models of mutual fund performance used in the study. Section 2 describes
the data. Section 3 presents our empirical methodology, main results, and
several specification and robustness tests. Section 4 examines the relation
between short-term and long-term performance. Section 5 concludes
the discussion.
1. Models of Mutual Fund Performance
Previous studies of mutual fund performance generally focus on either
stock selection or market timing ability.2 This section reviews the litera-
ture on both, highlighting the innovations made in this article. Section 1.1
discusses stock selection ability, Section 1.2 discusses market timing
ability, and Section 1.3 explains why we allow for the coexistence of
both types of ability.
1.1 Stock selection
Studies of stock selection, dating back to Jensen (1968), generally use the
intercept of factor model regressions to measure abnormal returns gener-
ated from picking stocks that outperform a risk-adjusted benchmark. We
use Carhart’s (1997) four-factor model:
X
4
rp;t ¼ ap þ bpk rk;t þ «p;t , ð1Þ
k¼1
where rp, t is the excess return of a mutual fund at time t, and rk, t are the
returns of four factors, including the excess return of the market portfolio,
the Fama and French (1993) size and book-to-market factors, and
Carhart’s momentum factor. Prior studies show that the latter three
factors capture the major anomalies of Sharpe’s (1964) single-factor
CAPM, and we include the factors to avoid rewarding managers for
simply exploiting these anomalies. We also include lagged values of the
four factors, as in Dimson (1979), to capture the effect of infrequent
trading of individual stocks on daily mutual fund returns.
Jensen (1969) finds that managers deliver negative abnormal returns.
Using more recent data, Ippolito (1989) finds evidence of positive abnor-
mal returns, but Elton et al. (1992) show that the benchmark chosen by
Ippolito causes this result. Using a multi-factor model, Elton et al. find
that abnormal fund returns are on average negative.
A related series of studies examines whether stock selection
ability persists. Such studies base tests of persistence on correlation in
2
Wermers (2000) investigates both ‘‘characteristic selectivity’’ and ‘‘characteristic timing,’’ although these
measures fall outside the standard risk-adjusted models of performance.
572
5. Mutual Fund Performance
period-to-period fund performance. As mentioned earlier, a large number
of studies document persistence over various horizons of at least one year.
However, Carhart (1997) finds that persistence results from an omitted
factor explaining equity returns, the momentum effect described by
Jegadeesh and Titman (1993). In addition, Carhart’s evidence suggests
that superior fund returns caused by positions in ‘‘hot’’ stocks result from
luck rather than from a defined momentum strategy.
The monthly returns used by prior studies prevent them from investi-
gating relatively short-term performance. Carhart (1997), for example,
ranks funds by prior return, over one- to five-year horizons, and by the
intercept from a four-factor version of Equation (1) estimated over three
years. Presumably, one could rank by return over a shorter period,
although this method could be interpreted as measuring the amount of
risk assumed by a manager rather than his skill. Our use of daily data
allows us to rank funds quarterly by risk-adjusted performance measures,
such as the intercept in the factor model given by Equation (1), and to
estimate three-month post-ranking performance.
1.2 Market timing
Most studies of the market timing ability of mutual fund managers infer
ability from fund returns. To infer timing ability from fund returns, prior
studies generally supplement standard factor model regressions with a
term that captures the convexity of fund returns resulting from market
timing. Treynor and Mazuy (1966; hereafter referred to as TM), for
example, use the following regression to detect market timing:
rp;t ¼ ap þ bp rm;t þ gp r2 þ «p;t ,
m;t ð2Þ
where gp measures timing ability. If a mutual fund manager increases
(decreases) a portfolio’s exposure to equities in advance of positive (nega-
tive) excess market returns, then the portfolio’s return will be a convex
function of the market return and g p will be positive.
Henriksson and Merton (1981; hereafter referred to as HM) develop a
similar model of market timing. The HM regression captures the convex
relation between the return of a successful market timer’s portfolio and
the return of the market by allowing the portfolio’s b to alternate between
two levels depending on the size of the market’s excess return:
rp;t ¼ ap þ bp rm;t þ g p It rm;t þ «p;t , ð3Þ
where I is an indicator function that equals 1 if the market’s excess return
is above some level, usually zero, and zero otherwise. In the HM regres-
sion, gp can be interpreted as the change in the portfolio’s b due to the
fund manager’s timing activity.
We modify the two timing regressions in two ways. First, we include the
three additional explanatory variables in Carhart’s (1997) four-factor
573
6. The Review of Financial Studies / v 18 n 2 2004
model of returns. Second, as before, we include lagged values of the four
factors to capture the effect of infrequent trading of individual stocks
on mutual fund returns.
Most previous studies of market timing in mutual funds, including the
TM study and that of Henriksson (1984), find significant ability in only a
few funds. The number of successful timers found by these studies is
roughly consistent with the number expected under the null hypothesis.
However, Bollen and Busse (2001) suggest that the statistical tests of prior
studies lack power because they are based on monthly data.3 Using daily
data, they find evidence of market timing ability in a significant number of
the funds in their sample. Chance and Hemler (2001) have daily data that
tracks the allocation strategies of 30 professional (non-mutual fund)
market timers. They also find a significant number of successful market
timers.
No prior study examines persistence in the market timing ability of
mutual fund managers. Graham and Harvey (1996) study the
asset allocation recommendations of investment newsletters. They find
some evidence of a short-term ‘‘hot hands’’ phenomenon whereby news-
letters are more likely to give correct advice in a given month if the prior
month’s newsletter gave correct advice. However, they fail to detect long-
term ability and conclude that an investor cannot identify a successful
newsletter based on past performance. Chance and Hemler (2001) esti-
mate the timing ability of professional market timers on two subsets of
their data. Spearman rank correlations of the two sets of estimates are
significant, and Chance and Hemler conclude that timing ability persists
in their sample.
With daily data we can investigate short-term persistence in market
timing ability. The persistence tests provide estimates of the economic
significance of mutual fund market timing ability, which complement the
recent evidence Bollen and Busse (2001) show for the existence of fund
timing ability.
1.3 Switching strategies
Prior studies focus on either stock selection or market timing ability.
Suppose, however, that some fund managers act more like stock pickers,
while others are primarily market timers. By treating all managers as one
type or the other, prior studies could be hampered by an inherent mis-
specification problem. The performance of stock pickers may not be
adequately recognized in a market timing study, and vice versa. Further-
more, a particular fund manager might switch strategies or funds at some
3
Similarly, Kothari and Warner (2001) find through simulation that monthly returns provide poor power
to reject the null that stock selection ability exists. They advocate exploiting information contained in the
reported changes in fund portfolio holdings.
574
7. Mutual Fund Performance
point in the sample, in which case treating every fund as following one
strategy or the other will likewise give rise to a misspecification. Brown,
Harlow, and Starks (1996), for example, suggest that fund managers
change strategies over the calendar year depending on year-to-date per-
formance to game compensation schemes. Also, Busse (1999) provides
evidence that fund managers time exposure to the market to coincide with
low levels of market volatility. In the third version of our experiment, we
allow for the coexistence of stock selection and market timing strategies,
and also allow fund managers to switch strategies over time. This iteration
of the analysis will be less prone to misspecification resulting from cross-
sectional differences in the strategies employed by fund managers, or from
temporal variation in the strategy followed by a particular fund.
2. Data
We study daily returns of 230 mutual funds. The sample, taken from Busse
(1999), is constructed as follows. A list of all domestic equity funds with
a ‘‘common stock’’ investment policy and a ‘‘maximum capital gains,’’
‘‘growth,’’ or ‘‘growth and income’’ investment objective and more than
$15 million in total net assets is created from the December 1984 version of
Wiesenberger’s Mutual Funds Panorama. Sector, balanced, and index
funds are not included, nor are funds that change into one of these types
in subsequent years during the sample period.
Daily per share net asset values and dividends from January 2, 1985
through December 29, 1995 are taken from Interactive Data Corp.
Moody’s Dividend Record: Annual Cumulative Issue and Standard & Poor’s
Annual Dividend Record are used to verify the dividends and dividend
dates and to determine split dates. The net asset values and dividends are
combined to form a daily return series for each fund as follows:
NAVp;t þ Dp;t
Rp;t ¼ À 1, ð4Þ
NAVp;tÀ1
where NAVp, t is the net asset value of fund p on day t, and Dp, t are the
ex-div dividends of fund p on day t.
This sample does not suffer from survivorship bias of the sort identified
in Brown et al. (1992) and Brown and Goetzmann (1995), wherein only
funds that exist at the end of the sample period are included. However,
funds that come into existence at some point between the end of 1984 and
the end of the sample period are not included.4
4
Although daily data on a wider cross-section of mutual funds are available from sources such as Standard
& Poor’s Micropal, such data are prone to considerable error, including incorrect dividends, ex-div dates,
and NAVs. The sample in this study has been corrected for most of these errors. See Busse (1999).
575
8. The Review of Financial Studies / v 18 n 2 2004
We construct daily versions of the size and book-to-market factors
similar to the monthly factors of Fama and French (1993). We construct
a daily version of the momentum factor similar to the monthly factor of
Carhart (1997), except value-weighted. See Busse (1999) and Bollen and
Busse (2001) for more details. For the return on the riskless asset, for each
day, we use the CRSP monthly 30-day Treasury bill return (T30RET)
divided by the number of days in the month.
3. Empirical Methodology and Results
This section presents tests of persistence in the stock selection and market
timing abilities of mutual fund managers based on the four-factor model
and on the two timing models. We estimate parameters of the regressions
fund-by-fund on subsets of the data consisting of nonoverlapping three-
month periods. We sort funds each quarter by their stock picking and
market timing performance, and form deciles of funds. We then examine
the performance of the deciles the following period. In Section 3.1, we
focus on measuring the statistical significance of performance persistence.
In Section 3.2, we present robustness tests to rule out spurious inference.
In Section 3.3, we comment on the economic significance of our results.
3.1 Statistical significance of persistence
To measure managerial ability, for the non-timing model, we simply use
the intercept, ap, from the regression in Equation (1) as the daily abnormal
return due to a manager’s stock picking performance. For the timing
models, we define:
1X N
rp;g ¼ ½ap þ g p f ðrm;t ÞŠ ð5Þ
N t¼1
as the daily abnormal return due to a manager’s timing performance,
where N is the number of trading days in the quarter, and we estimate
ap and gp from the two timing models in Equations (2) and (3). For TM,
f ðrm;t Þ ¼ r2 ; for HM, f(rm, t) ¼ It rm, t. Note that in Equation (5) we
m;t
include the fund’s ap, which can be interpreted as the cost of implementing
the timing strategy. We sort funds in each period in three ways: by ap in
the stock selection model, by rp, g in the two timing models, and we execute a
mixed sort by first classifying each fund as either a market timer or a stock
picker. We classify a fund as a market timer in a particular quarter if the
fund’s timing coefficient is statistically significant. We determine signifi-
cance using bootstrap standard errors as in Bollen and Busse (2001). We
then record the abnormal return for that fund as either ap or rp, g, and sort
based on this measure. We do two mixed sorts, one for each timing model.
For each sort, we form deciles of funds and then record how the funds in
each decile perform in the following period.
576
9. Mutual Fund Performance
Table 1
Risk-adjusted performance deciles: Ranking quarter
Market timing (%) Mixed (%)
Decile Stock selection, ap (%) TM HM TM HM
1 0.0738 0.0761 0.0768 0.0762 0.0754
2 0.0370 0.0376 0.0374 0.0376 0.0371
3 0.0221 0.0218 0.0223 0.0218 0.0221
4 0.0112 0.0108 0.0113 0.0108 0.0112
5 0.0017 0.0014 0.0017 0.0014 0.0017
6 À0.0072 À0.0078 À0.0077 À0.0078 À0.0073
7 À0.0163 À0.0171 À0.0174 À0.0171 À0.0165
8 À0.0275 À0.0287 À0.0291 À0.0287 À0.0280
9 À0.0426 À0.0442 À0.0451 À0.0441 À0.0437
10 À0.0828 À0.0839 À0.0870 À0.0838 À0.0844
Average À0.0030 À0.0033 À0.0036 À0.0033 À0.0032
The table lists average daily performance estimates during the quarterly ranking period for deciles of funds
sorted according to the performance estimates during the ranking period. We base the stock selection
model performance rankings on ap estimated from the four-factor model,
X
4
rp;t ¼ ap þ bpk rk;t þ «p;t :
k¼1
We base the timing model rankings on the average ap þ g p f(rm,t) from the TM and HM market timing
models,
X
4
rp;t ¼ ap þ bpk rk;t þ g p f ðrm;t Þ þ «p;t,
k¼1
where f ðrm;t Þ ¼ r2 for TM, and f(rm,t) ¼ Itrm,t for HM. The mixed rankings use the timing model
m;t
ap þ g p f(rm,t) when the g p is statistically significant at the 5% level and otherwise use the ap from the
stock selection model. We assess the statistical significance of the gp using bootstrap standard errors. The
table shows the average performance estimates during the quarterly ranking period. The sample consists
of 230 mutual funds. The sample period is from January 2, 1985 to December 29, 1995.
Tables 1 and 2 list the average abnormal return of funds in each decile.
Table 1 shows the results in the ranking quarter, and Table 2 shows the
results in the post-ranking quarter. Note that we calculate the averages
both across funds and across time. In Table 1, the top decile exhibits a
daily abnormal return from stock selection of 0.0738%, which is quite
robust across the different performance models. The bottom decile has an
abnormal return from stock selection of À0.0828% per day, again robust
across models. These daily abnormal returns are equivalent to 4.76 and
À5.08%, respectively over the quarter.5 Since we sort on performance, a
large difference between the top and bottom deciles in the ranking quarter
is not surprising. We document the variation in the ranking quarter to
provide a context for the post-ranking analysis. In the post-ranking quar-
ter, shown in Table 2, the averages are significantly different from zero at
the 5% level for the top decile and the bottom five or six deciles, suggesting
that performance persists. For stock selection, the top decile’s abnormal
5
We convert estimates of average daily abnormal returns, r, to quarterly returns by computing
(1 þ r)63 À 1.
577
10. The Review of Financial Studies / v 18 n 2 2004
Table 2
Risk-adjusted performance deciles: Post-ranking quarter
Market timing (%) Mixed (%)
Decile Stock selection, ap (%) TM HM TM HM
ÃÃ Ã Ã Ã
1 0.0061 0.0040 0.0039 0.0040 0.0056ÃÃ
2 0.0006 0.0012 0.0014 0.0011 0.0011
3 À0.0003 0.0002 À0.0001 0.0004 À0.0020
4 À0.0001 À0.0002 À0.0011 À0.0003 0.0019
5 À0.0034ÃÃ À0.0023 À0.0041ÃÃ À0.0022 À0.0042
6 À0.0035ÃÃ À0.0042ÃÃ À0.0045ÃÃ À0.0042ÃÃ À0.0040ÃÃ
7 À0.0054ÃÃ À0.0069ÃÃ À0.0046ÃÃ À0.0069ÃÃ À0.0065ÃÃ
8 À0.0055ÃÃ À0.0056ÃÃ À0.0059ÃÃ À0.0056ÃÃ À0.0042ÃÃ
9 À0.0075ÃÃ À0.0075ÃÃ À0.0079ÃÃ À0.0074ÃÃ À0.0080ÃÃ
10 À0.0122ÃÃ À0.0123ÃÃ À0.0120ÃÃ À0.0125ÃÃ À0.0120ÃÃ
Average À0.0031 À0.0034 À0.0035 À0.0033 À0.0032
The table lists average daily performance estimates during the post-ranking period for deciles of funds
sorted according to the performance estimates during the ranking period. We base the stock selection
model performance rankings on ap estimated from the four-factor model,
X
4
rp;t ¼ ap þ bpk rk;t þ «p;t :
k¼1
We base the timing model rankings on the average ap þ g p f(rm,t) from the TM and HM market timing
models,
X
4
rp;t ¼ ap þ bpk rk;t þ g p f ðrm;t Þ þ «p;t;
k¼1
where f ðrm;t Þ ¼ r2 for TM, and f(rm,t) ¼ It rm,t for HM. The mixed rankings use the timing model ap þ
m;t
g p f(rm,t) when the g p is statistically significant at the 5% level and otherwise use the ap from the stock
selection model. We assess the statistical significance of the gp using bootstrap standard errors. The table
shows the average performance estimates during the following quarterly post-ranking period. Ã and ÃÃ
indicate two-tailed significance at the 5 and 1% levels, respectively. The sample consists of 230 mutual
funds. The sample period is from January 2, 1985 to December 29, 1995.
return is 0.0061% per day, whereas the bottom decile’s abnormal return is
À0.0122% per day, corresponding to 0.39 and À0.77%, respectively over
the quarter. The results for the timing models are qualitatively similar.
Figure 1 illustrates the day-by-day performance of the top and bottom
deciles in the post-ranking quarter using the stock selection model. The
top decile generates most of the abnormal return in the first half of the
quarter, whereas the bottom decile’s abnormal return declines at a rela-
tively constant rate across the quarter. The latter result is consistent with
persistent negative abnormal returns driven by large expenses, which
accrue daily. Our results in Tables 1 and 2, as well as the steady decline
in the bottom decile’s abnormal return in Figure 1, indicate that the
abnormally bad performance of the worst funds persist strongly. Carhart
(1997) finds this same result.
To investigate the impact of persistence further, Tables 3 and 4 report
the post-ranking daily returns and Sharpe ratios of the deciles using the
same quarterly sorting procedures as those used in Tables 1 and 2, as well
as a sort based on prior quarter return, which we label Rp. Some previous
studies, including Carhart (1997), sort by past return in an effort to
578
11. Mutual Fund Performance
0.60%
0.40%
Cumulative Abnormal Return
0.20%
0.00%
Top Decile
-0.20%
Bottom Decile
-0.40%
-0.60%
-0.80%
-1.00%
Day 4 8 12 16 20 24 28 32 36 40 44 48 52 56 60
Day
Figure 1
Cumulative abnormal returns
The figure shows cumulative average abnormal returns during a one-quarter post-ranking period for the
top and bottom deciles of funds sorted according to ap during a one-quarter ranking period. We estimate
ap with the four-factor model,
X4
rp;t ¼ ap þ bpk rk;t þ «p;t :
k¼1
The sample consists of 230 mutual funds. The sample period is from January 2, 1985 to December
29, 1995.
Table 3
Post-ranking period performance deciles: Total returns
Market timing (%) Mixed (%)
Decile Returns, Rp (%) Stock selection, ap (%) TM HM TM HM
1 0.0553 0.0585 0.0571 0.0568 0.0571 0.0578
2 0.0543 0.0538 0.0537 0.0549 0.0536 0.0539
3 0.0541 0.0541 0.0560 0.0549 0.0563 0.0527
4 0.0563 0.0555 0.0559 0.0544 0.0558 0.0579
5 0.0543 0.0565 0.0569 0.0553 0.0569 0.0557
6 0.0553 0.0543 0.0535 0.0522 0.0535 0.0526
7 0.0545 0.0534 0.0538 0.0545 0.0537 0.0523
8 0.0545 0.0550 0.0523 0.0546 0.0523 0.0576
9 0.0524 0.0520 0.0542 0.0548 0.0544 0.0522
10 0.0538 0.0517 0.0512 0.0524 0.0510 0.0520
Average 0.0545 0.0545 0.0545 0.0545 0.0545 0.0545
The table lists average daily total returns during quarterly post-ranking periods for deciles of funds sorted
according to performance estimates during the quarterly ranking period. The first column represents
rankings based on return, Rp. We base the stock selection model performance rankings on ap estimated
from the four-factor model,
X
4
rp;t ¼ ap þ bpk rk;t þ «p;t:
k¼1
We base the timing model rankings on the average ap þ g p f(rm,t) from the TM and HM market timing
models,
X
4
rp;t ¼ ap þ bpk rk;t þ g p f ðrm;t Þ þ «p;t ;
k¼1
where f ðrm;t Þ ¼ r2 for TM, and f(rm,t) ¼ It rm,t for HM. The mixed rankings use the timing model ap þ
m;t
g p f(rm,t) when the gp is statistically significant at the 5% level and otherwise use the ap from the stock
selection model. We assess the statistical significance of the g p using bootstrap standard errors. This table
shows the average daily total returns during the quarterly post-ranking period. The sample consists of 230
mutual funds. The sample period is from January 2, 1985 to December 29, 1995.
579
12. The Review of Financial Studies / v 18 n 2 2004
Table 4
Post-ranking period performance deciles: Sharpe ratios
Market timing Mixed
Decile Returns, Rp Stock selection, ap TM HM TM HM
1 0.0652 0.0707 0.0697 0.0685 0.0697 0.0701
2 0.0683 0.0680 0.0670 0.0687 0.0668 0.0676
3 0.0645 0.0648 0.0667 0.0673 0.0670 0.0637
4 0.0673 0.0679 0.0691 0.0647 0.0689 0.0714
5 0.0649 0.0690 0.0700 0.0683 0.0700 0.0665
6 0.0676 0.0656 0.0646 0.0636 0.0646 0.0645
7 0.0656 0.0635 0.0622 0.0652 0.0622 0.0625
8 0.0647 0.0626 0.0612 0.0621 0.0612 0.0649
9 0.0601 0.0611 0.0637 0.0633 0.0638 0.0618
10 0.0624 0.0574 0.0566 0.0592 0.0564 0.0578
Average 0.0651 0.0651 0.0651 0.0651 0.0651 0.0651
The table lists average daily Sharpe ratios during quarterly post-ranking periods for deciles of funds sorted
according to performance estimates during the quarterly ranking period. The first column represents
rankings based on return, Rp. We base the stock selection model performance rankings on ap estimated
from the four-factor model,
X
4
rp;t ¼ ap þ bpk rk;t þ «p;t:
k¼1
We base the timing model rankings on the average ap þ g p f(rm,t) from the TM and HM market timing
models,
X
4
rp;t ¼ ap þ bpk rk;t þ g p f ðrm;t Þ þ «p;t ,
k¼1
where f ðrm;t Þ ¼ r2 for TM, and f(rm,t) ¼ It rm,t for HM. The mixed rankings use the timing model ap þ
m;t
gp f(rm,t) when the gp is statistically significant at the 5% level and otherwise use the ap from the stock
selection model. We assess the statistical significance of the gp using bootstrap standard errors. This table
shows the average Sharpe ratios during the quarterly post-ranking period. The sample consists of 230
mutual funds. The sample period is from January 2, 1985 to December 29, 1995.
classify funds using relatively short measurement windows in conjunction
with monthly data. Using both sorting procedures will provide some
insight regarding why our results differ from those reported in previous
studies. In Table 3, we see relatively little difference across the deciles
when ranking by Rp. The top decile has a 0.0553% daily return in the post-
ranking quarter, whereas the bottom decile has a 0.0538% daily return.
When ranking on ap, by contrast, the top decile has a daily return of
0.0585% versus 0.0517% for the bottom decile. Table 4 reports the Sharpe
ratios of the deciles in the post-ranking quarter. Again, the sort based on
return results in little difference across deciles in the post-ranking quarter,
0.0652 for the top decile versus 0.0624 for the bottom. The sort based on
ap, however, results in a Sharpe ratio of 0.0707 for the top decile and
0.0574 for the bottom. This result indicates that the top decile, as ranked
by abnormal return, appears to produce a superior risk-return profile.
One interesting point to make given the results of Tables 1–4 is that
the raw returns of the top and bottom deciles in the post-ranking
quarter do not vary nearly as much as the abnormal returns of the top
and bottom deciles. When sorting on stock selection, for example, the
580
13. Mutual Fund Performance
difference between decile 1 and decile 10 in subsequent post-ranking
abnormal returns due to stock selection is 0.0183% on a daily basis, as
indicated in Table 2. In contrast, the difference in post-ranking raw
returns is only 0.0068%, as listed in Table 3. The reason for this is that
the factor loadings of the top and bottom deciles are systematically
different. Table 5 shows the average factor loadings in the post-ranking
quarter for the funds in the different deciles, sorted by stock selection. The
factor loadings are different — the b on the size factor is 0.274 for the top
decile, for example, compared to 0.335 for the bottom decile. The conclu-
sion drawn from this analysis is that the superiority of the top decile over
the bottom decile is more pronounced when risk-adjusted returns are
compared as opposed to raw returns.
To provide additional insight regarding the persistence of stock selec-
tion and market timing ability, Table 6 shows the results of the following
cross-sectional regression of performance on its lagged value:
Perf p;t ¼ a þ bPerf p;tÀ1 þ «p;t , ð6Þ
where Perfp, t is either raw return or the contribution of active manage-
ment to fund returns as defined above. A positive slope coefficient would
indicate that past performance predicts the following period’s perform-
ance. We estimate the regression each quarter and record the time series
of parameter estimates. We report the average regression parameter esti-
mates, as well as p-values based on time series standard errors. This
application of Fama–MacBeth (1973) inference is motivated by the poten-
tial for cross-fund correlation in the residuals of Equation (6) resulting
from any systematic misspecification that would affect estimates of
Table 5
Factor loadings of risk-adjusted performance deciles
Decile bm bsmb bhml bmom R2
1 1.045 0.274 À0.287 0.113 0.829
2 0.990 0.172 À0.189 0.065 0.859
3 0.968 0.137 À0.166 0.072 0.864
4 0.961 0.138 À0.127 0.059 0.871
5 0.961 0.117 À0.118 0.054 0.874
6 0.967 0.121 À0.114 0.047 0.872
7 0.982 0.145 À0.121 0.051 0.868
8 0.974 0.151 À0.115 0.026 0.863
9 1.006 0.203 À0.137 0.054 0.850
10 1.055 0.335 À0.200 0.044 0.805
Average 0.990 0.178 À0.157 0.058 0.856
The table lists average factor loadings estimated from the four-factor model,
X
4
rp;t ¼ ap þ bpk rk;t þ «p;t ,
k¼1
during quarterly post-ranking periods for deciles of funds sorted according to ap during the ranking
period. The sample consists of 230 mutual funds. The sample period is from January 2, 1985 to December
29, 1995.
581
14. The Review of Financial Studies / v 18 n 2 2004
Table 6
Cross-sectional regression tests of performance persistence
Market timing (%) Mixed (%)
Returns, Stock selection,
Rp (%) ap (%) TM HM TM HM
A 0.044 À0.002 À0.003 À0.003 À0.002 À0.002
p-value .006 .213 .160 .126 .164 .181
B 0.036 0.122 0.118 0.117 0.118 0.117
p-value .502 .000 .000 .000 .000 .000
R2 0.101 0.038 0.034 0.032 0.034 0.036
Fraction of b coefficients
Positive .535 .767 .791 .721 .791 .767
p-value < .10 .395 .349 .372 .395 .372 .372
p-value < .05 .372 .349 .302 .349 .302 .326
p-value < .01 .349 .326 .302 .349 .302 .326
Negative .465 .233 .209 .279 .209 .233
p-value < .10 .349 .047 .047 .070 .047 .047
p-value < .05 .349 .047 .047 .023 .047 .047
p-value < .01 .326 .047 .047 .023 .047 .047
The table shows results of cross-sectional regressions of fund performance during one quarterly period on
fund performance during the previous quarterly period,
Perf p;t ¼ a þ bPerf p;tÀ1 þ «p;t :
The first column represents rankings based on return, Rp. We base the stock selection model performance
rankings on ap estimated from the four-factor model,
X
4
rp;t ¼ ap þ bpk rk;t þ «p;t :
k¼1
We base the timing model rankings on the average ap þ g p f(rm,t) from the TM and HM market timing
models,
X
4
rp;t ¼ ap þ bpk rk;t þ g p f ðrm;t Þ þ «p;t ,
k¼1
where f ðrm;t Þ ¼ r2 for TM, and f(rm,t) ¼ Itrm,t for HM. The mixed rankings use the timing model ap þ
m;t
gp f(rm,t) when the gp is statistically significant at the 5% level and otherwise use the ap from the stock
selection model. We assess the statistical significance of the gp using bootstrap standard errors. We
estimate a cross-sectional regression for each pair of successive quarterly periods. Listed first in the
panels are the average regression parameters for the 43 quarterly regressions. The p-values are
estimated in the spirit of Fama and MacBeth (1973) using the time series standard errors of the
parameter estimates. Listed next are the fractions of slope coefficients that are positive (negative) and
significant at the 10, 5, and 1% levels. The sample consists of 230 mutual funds. The sample period is from
January 2, 1985 to December 29, 1995.
performance. In the context of the timing models, for example, changes in
market skewness would affect the general convexity between fund returns
and the market return. Consistent with the Jagannathan and Korajczyk
(1986) conjecture, this could lead to changes in the measured timing
performance of all funds. The Fama–MacBeth standard errors capture
this effect.
Table 6 shows that the average slope of the cross-sectional regressions is
positive and significant for all of the risk-adjusted performance measures
but insignificant when we sort by return. The individual slope coefficients
582
15. Mutual Fund Performance
are positive in 70–80% of the quarters for all of the risk-adjusted perform-
ance measures, but only in 53.5% of the quarters when we sort by return.
In addition, the slope is significantly positive using OLS standard errors
several times as often as it is significantly negative for the risk-adjusted
performance measures. When we sort by return, however, the slope is
significantly negative almost as often as it is significantly positive. These
results demonstrate again that sorting by return as opposed to abnormal
return results in substantially different post-ranking performance, appar-
ently by selecting different funds. To support this conjecture, we compare
the sort based on return to the sort based on abnormal return by comput-
ing the fraction of funds placed in the same decile. We find that, regardless
of the model of abnormal return, only one-fourth of the mutual funds in
our sample were placed in the same decile by both sorts. In contrast,
when comparing sorts based on any two models of abnormal return,
three-fourths of the funds were placed in the same decile.
3.2 Specification and robustness tests
This section reports the results of four tests designed to identify sources of
spurious inference.6 First, we test whether the daily four-factor model
used to identify stock selection ability adequately controls for the size
and momentum anomalies. We construct simulated portfolios that follow
a strategy of investing in particular quintiles of size and momentum
stocks, and we then estimate the abnormal return of these simulated
portfolios. If the four-factor model is well-specified, it should generate
aps that are close to zero. To compare the results of these simulated
portfolios to the actual mutual funds, we also subtract reasonable esti-
mates of management fees and trading costs from the returns of the
simulated portfolios. A well-specified factor model should then generate
negative abnormal returns, in contrast to the positive 39 basis points
earned by the top decile of actual mutual funds in our sample.
To create the simulated portfolios, we sort stocks in the CRSP NYSE/
AMEX/Nasdaq database each quarter during our sample period into
quintiles based on prior quarter return and market capitalization. We
form 25 value-weighted portfolios based on the intersections of these
two sorts. We record daily returns and concatenate over our sample
period. We adjust returns for expenses two ways. We deduct a daily
expense ratio equivalent to 1.10% per year, which is the average expense
ratio of the funds in our sample. Also, we estimate trading costs using the
results of Keim and Madhavan (1998), who analyze a dataset of institu-
tional trades. They estimate trading costs broken down by market
capitalization quintiles, finding that in their sample period of January
1991– March 1993, total round-trip costs range from 0.49% for the largest
6
We thank the referees for suggesting the four tests in Section 3.2.
583
16. The Review of Financial Studies / v 18 n 2 2004
Table 7
Specification test
Size quintile (%)
Momentum quintile Small 2 3 4 Large
Low À6.13 À4.02 À2.20 À1.00 0.74
2 À2.69 À1.82 À1.37 À0.98 0.96
3 À2.00 À1.59 À0.90 À0.78 À0.33
4 À1.68 À1.02 À1.02 À0.56 À0.16
High À1.29 À0.76 À0.22 À0.50 À0.14
We sort stocks into quintiles quarterly on the basis of prior quarter return and market capitalization. We
construct 25 simulated portfolios by value-weighting each stock that falls into a given intersection of the
momentum and size sorts. We concatenate daily returns of the simulated portfolios over our sample
period, and adjust to reflect expense ratios and transaction costs. Daily expense ratios are equivalent to
1.10% per year, the average annual expense ratio of the funds in our sample. We estimate transaction costs
by size quintile using Keim and Madhavan (1998) and assume 100% turnover per year in the simulated
portfolios. The table lists average abnormal quarterly returns based on ap estimated from the four-
factor model,
X 4
rp;t ¼ ap þ bpk rk;t þ «p;t :
k¼1
The sample period is from January 2, 1985 to December 29, 1995.
stocks to 4.79% for the smallest. We assume 100% annual turnover in the
simulated portfolios and deduct the appropriate size quintile-based trad-
ing costs from the returns of the portfolios each year. This procedure
likely underestimates actual trading costs, since the annual turnover of the
simulated portfolios is greater than 100%.7
Table 7 lists the quarterly abnormal return of these simulated portfo-
lios. The portfolio ap generally increases with momentum (i.e., portfolios
that purchase past winners outperform portfolios that buy past losers) and
with firm size. With the exception of two portfolios consisting of large
stocks and low prior quarter returns, all of the portfolio aps are negative.
As listed in Table 5, the top decile mutual funds in our sample have higher
SMB and momentum factor loadings than the median fund, which suggest
that they invest in relatively small stocks that have recently had relatively
high returns. An appropriate comparison for the top decile mutual funds
in our sample, then, are the simulated portfolios in the top two momentum
quintiles and smallest two size quintiles. These quintiles all have negative
ap estimates. Our results indicate that misspecification in our four-factor
model cannot explain the positive abnormal returns of the top decile of
funds. Also, when we repeat the momentum size quintile analysis using
monthly data, the results are very similar to those in Table 7, which
suggests that the daily factor specification effectively corrects for stale
daily stock prices.
7
The actual turnover rate associated with a size and/or momentum strategy depends on which quintiles
it encompasses and how far a stock can drift away from a particular size momentum portfolio before
it is replaced.
584
17. Mutual Fund Performance
We explore one additional piece of evidence regarding the daily factor
model’s effectiveness at controlling for momentum strategies. If we sort on
the momentum factor loading in the ranking period (instead of sorting on
the abnormal return), the top decile abnormal return is negative during
the ranking quarter and 1.3 basis points during the post-ranking quarter,
well below the 39 basis points associated with an abnormal return sort.
This result suggests that the daily factor model provides a sufficiently high
hurdle for funds that pursue momentum strategies.
Our second test investigates the robustness of the results to alternative
momentum factors. The results thus far use a value-weighted momentum
factor formed monthly based on returns over the prior year (although not
including the returns during the last month), as is standard in the litera-
ture. However, a fund manager could pursue a momentum strategy based
on shorter past return horizons. We therefore generate additional value-
weighted momentum factors formed monthly using measurement hori-
zons of six, three, and one month. Here, we do not skip a month between
the ranking and formation dates, since the motivation for these alternative
factors is that momentum is a short-lived phenomenon. We also create a
momentum factor formed weekly based on the prior week’s returns and a
momentum factor formed daily based on the prior day’s returns. We
estimate the performance of the mutual funds in our sample quarterly as
before, both for ranking and holding purposes.
Table 8 lists the results. In all cases, the top decile generates
significant, positive abnormal returns in the post-ranking quarter. The
Table 8
Robustness test
Decile 12-mo t-stat 6-mo t-stat 3-mo t-stat 1-mo t-stat 1-wk t-stat 1-day t-stat
(%) (%) (%) (%) (%) (%)
1 0.0061 3.17 0.0085 4.11 0.0084 3.86 0.0107 5.08 0.0070 2.89 0.0064 2.80
2 0.0006 0.40 0.0038 2.50 0.0038 2.49 0.0056 3.66 0.0045 2.38 0.0037 2.17
3 À0.0003 À0.24 0.0005 0.34 0.0019 1.21 0.0014 0.89 0.0036 1.98 0.0012 0.76
4 À0.0001 À0.09 À0.0006 À0.43 0.0021 1.37 0.0021 1.55 À0.0014 À0.88 À0.0009 À0.54
5 À0.0034 À2.69 À0.0015 À1.13 À0.0006 À0.44 0.0022 1.65 0.0029 1.79 À0.0039 À2.67
6 À0.0035 À2.63 À0.0029 À2.07 À0.0020 À1.52 À0.0031 À2.18 À0.0015 À0.95 À0.0013 À0.89
7 À0.0054 À3.94 À0.0047 À3.50 À0.0023 À1.68 À0.0025 À1.71 À0.0019 À1.31 À0.0013 À0.88
8 À0.0055 À3.92 À0.0056 À3.97 À0.0050 À3.50 À0.0033 À2.36 À0.0042 À2.44 À0.0030 À2.01
9 À0.0075 À4.76 À0.0057 À3.85 À0.0041 À2.74 À0.0054 À3.77 À0.0033 À1.83 À0.0068 À4.16
10 À0.0122 À6.22 À0.0122 À6.24 À0.0110 À5.68 À0.0118 À6.04 À0.0114 À5.11 À0.0109 À5.08
The table lists average daily performance estimates during quarterly post-ranking periods for deciles of
funds sorted according to ap during quarterly ranking periods. We estimate ap with the four-factor model,
X
4
rp;t ¼ ap þ bpk rk;t þ «p;t :
k¼1
The columns show the results for alternative momentum factors. All are value-weighted indices created by
subtracting the return of 30% of stocks with the lowest returns from the return of 30% of stocks and the
highest returns as measured over horizons ranging from 12 months to 1 day. We re-form the factors
constructed from horizons of 1 month or greater each month. We re-form the weekly factor weekly. We
re-form the daily factor daily. The sample period is from January 2, 1985 to December 29, 1995.
585
18. The Review of Financial Studies / v 18 n 2 2004
measured performance is higher using the higher frequency momentum
factors. With a one-month factor, for example, the daily ap is 0.0107%,
which is equivalent to 68 basis points per quarter. These results indi-
cate that our inference does not hinge on our choice of momentum
factor, which is consistent in its construction with prior studies. Further-
more, when we use equal-weighted momentum factors [similar to
Carhart (1997)] instead of value-weighted, the top decile abnormal
returns increase across all momentum factor horizons shown in
Table 8.
The third test examines whether the cross-autocorrelation results in Lo
and MacKinlay (1990) generate the abnormal returns we find in the top
decile of mutual funds. Lo and MacKinlay find that the returns of small
stocks lag the returns of large stocks at a weekly horizon. Although they
do not identify an economic reason for this result, the result is relevant
for our study because it would be incorrect to interpret abnormal returns
as evidence of stock picking or market timing ability if the cross-
autocorrelation anomaly generates the abnormal returns. To proceed,
we follow the procedure in Lo and MacKinlay, establishing size quintile
breakpoints in the middle of our sample. We then compute quarterly
portfolio returns of the size quintiles, and compute all possible lead–lag
correlations. None of the cross-autocorrelations are significant using the
sample statistic derived in Lo and MacKinlay. This result suggests that the
mutual fund managers in the top decile of funds are not generating
abnormal returns by following a strategy that seeks to exploit cross-
autocorrelations at a quarterly frequency.
Our fourth test checks to see whether the abnormal returns we docu-
ment are the result of bid/ask bounce or some other microstructure effect
that may distort measurement when using daily data. To do this, we
conduct an experiment in which we rank quarterly using daily returns
based on the stock selection model. We then analyze performance in the
post-ranking quarters using monthly returns. In order to allow for time-
varying factor loadings, we estimate factor loadings in the post-ranking
quarter using daily returns. To measure abnormal performance in the
post-ranking quarters, we calculate each month the equal-weighted aver-
age return of the funds in the top decile using monthly data and subtract
their expected return. We compute the expected return by taking the sum
of the products of the factor loadings, which are an equal-weighted
average across funds in the top decile and the factor returns, again using
monthly data. This procedure measures performance using monthly data
while at the same time allowing for time-varying factor loadings. The time
series average of the abnormal return calculated using this procedure is 44
basis points per quarter with a t-statistic of 1.859, almost identical to our
original results. Thus, our results do not appear to be caused by micro-
structure effects. Together with the other results in this section, these
586
19. Mutual Fund Performance
results suggest that the top decile’s abnormal return detected at the
quarterly frequency is not spurious.
3.3 Economic significance
Thus far, we have provided evidence that the relative risk-adjusted per-
formance of funds persists. The top decile of funds generates, on average,
a statistically significant abnormal return of 25–39 basis points per quarter
out of sample, depending on the model of performance.
To put the magnitude of these results in perspective, note that Carhart
et al. (2002) document year-end one-day excess returns that range from 25
basis points for large-cap value funds to 174 basis points for small-cap
growth funds. These returns are partially reversed the next day indicating
that significant temporary price pressure is exerted on stocks the funds
own at the end of the year. The authors link this pattern to incentives in
the mutual fund industry. Qualitatively similar results are obtained for
quarter-ends other than the year-end, although the magnitudes are smal-
ler. The price pressure findings of Carhart et al. are likely not responsible
for the persistence we document, since reversals would generate mean
reversion in performance. However, it may be the case that some mutual
fund holdings are affected by general price pressure, unrelated to year-end
and quarter-end gaming behavior, that leads to serial correlation of
performance at the quarterly frequency. In the next section, we ex-
plore the relation between performance and observational frequency in
greater depth.
Regardless of the cause of the abnormal returns, it is valid to ask
whether an investor could exploit the persistence we document. Consider
an individual investor’s strategy of ‘‘chasing winners’’ wherein he selects
his portfolio of mutual funds based on prior quarter performance.8 Each
time an investor alters his portfolio of funds, front-end or deferred loads
could reduce the investor’s realized return. According to Reid and Rea
(2003), the average front-end sales charge for stock and bond funds was
1.1% in 2001, which would clearly eliminate the abnormal return we
document. Presumably, one could restrict attention to no-load funds,
although this would eliminate a large number of candidates. Further,
each time an investor removes a fund from his portfolio, the raw holding
period return (not abnormal return) is taxable. This also would affect an
investor’s realized return. To avoid the tax disadvantage of the strategy,
one could use a tax-deferred retirement account; however, employer-
based retirement plans typically offer a limited selection of mutual fund
companies for their employees. Investors could also face redemption fees
8
An investor would also face a lag between when the daily data are available and when the fund selection
would occur before he could begin to capture the post-ranking abnormal return.
587
20. The Review of Financial Studies / v 18 n 2 2004
that many mutual fund companies levy on investors who redeem shares
after short holding periods.
4. Short-Term Versus Long-Term Performance
Our results stand in contrast to existing evidence on mutual fund persist-
ence. Carhart (1997) reports a monthly top-decile four-factor ap of
À0.12%, which is statistically insignificant when sorting by prior year
return. When he sorts by prior three-year ap, Carhart finds a top decile
ap of 0.02% per month — again statistically insignificant. Why are our
results so different? One possibility is that we use a substantially different
procedure to sort funds and measure performance. We sort by prior
quarter risk-adjusted performance. This method is not possible with the
monthly data used by Carhart. Hence, one possible source of the differ-
ence is that our procedure ranks funds differently than Carhart’s proce-
dure. Tables 3 and 4 provide some evidence to support this explanation:
the difference between the top and bottom deciles in our sample narrows
substantially when we sort based on return rather than on abnormal
return. Furthermore, we measure post-ranking performance by abnormal
return in the following quarter. In contrast, Carhart estimates post-
ranking performance using a concatenated series of post-ranking returns,
which does not allow for time variation in factor risk loadings. Hence, a
second potential source of the difference is that we measure post-ranking
performance differently than Carhart.
To investigate the impact of the differences between our methodology
and Carhart’s, we rerun our analysis using a variety of measurement
windows, return frequencies, and performance measures. Tables 9–12
list the results for the top decile of funds and the stock selection model.
Tables 9 and 10 list the results when we measure performance over a post-
ranking period equal in length to the measurement period, which is the
procedure used in Tables 1 and 2. Table 9 lists the results when we sort
funds by abnormal return. Listed below each quarterly average abnormal
return are t-statistics estimated in the spirit of Fama and MacBeth (1973),
using the standard error of the time series of parameter estimates. Using
daily data and quarterly periods, we find that the top decile generates a
statistically significant quarterly average abnormal return of 39 basis
points in the post-ranking quarter. This is equivalent to the result listed
in Table 2. As we increase the measurement period to one and three
years, the quarterly average abnormal return drops to 7 and 5 basis points,
respectively — neither statistically significant.9 The results for the timing
models are similar and for the sake of brevity, we do not report them
9
To increase the number of tests, we repeat the three-year measurement interval analysis each year, rather
than every three years.
588
21. Mutual Fund Performance
Table 9
Top decile post-ranking period performance by length of ranking and post-ranking period: Time series
averages — sorting on abnormal return
Data frequency
Measurement interval Daily Weekly Monthly
Quarterly 0.385%
(3.165)
1-yr 0.070% 0.034%
(0.514) (0.238)
3-yr 0.049% À0.133% À0.117%
(0.518) (À1.382) (À1.002)
The table lists average abnormal quarterly returns during post-ranking periods for the top decile of funds
sorted by abnormal return during ranking periods. We measure abnormal returns by ap estimated from
the four-factor stock selection model,
X4
rp;t ¼ ap þ bpk rk;t þ «p;t :
k¼1
We estimate post-ranking abnormal returns separately over each post-ranking period. For the quarterly
measurement intervals, we rank each quarter. For the one- and three-year measurement intervals, we rank
each year. In this table, the ranking and post-ranking periods are the same duration (i.e., one quarter, one
year, or three years). Listed in parentheses below each average abnormal quarterly return are t-statistics
estimated in the spirit of Fama and MacBeth (1973) using the time series standard errors of the parameter
estimates. The sample consists of 230 mutual funds. The sample period is from January 2, 1985 to
December 29, 1995.
Table 10
Top decile post-ranking period performance by length of ranking and post-ranking period: Time series
averages — sorting on return
Data frequency
Measurement interval Daily Weekly Monthly
Quarterly 0.156%
(1.180)
1-yr À0.032% À0.069%
(À0.259) (À0.521)
3-yr À0.102% À0.185% À0.056%
(À1.045) (À1.986) (À0.508)
The table lists average abnormal quarterly returns during post-ranking periods for the top decile of funds
sorted by return during ranking periods. We measure abnormal returns by ap estimated from the
four-factor stock selection model,
X 4
rp;t ¼ ap þ bpk rk;t þ «p;t :
k¼1
We estimate post-ranking abnormal returns separately over each post-ranking period. For the quarterly
measurement intervals, we rank each quarter. For the one- and three-year measurement intervals, we rank
each year. In this table, the ranking and post-ranking periods are the same duration (i.e., one quarter, one
year, or three years). Listed in parentheses below each average abnormal quarterly return are t-statistics
estimated in the spirit of Fama and MacBeth (1973) using the time series standard errors of the parameter
estimates. The sample consists of 230 mutual funds. The sample period is from January 2, 1985 to
December 29, 1995.
here. We interpret these results as evidence that superior performance is a
short-lived phenomenon that can only be detected using relatively short
measurement windows. When we use weekly or monthly returns, the top
decile of funds does not exhibit superior performance. This finding is
589
22. The Review of Financial Studies / v 18 n 2 2004
Table 11
Top decile post-ranking period performance by length of ranking and post-ranking period:
Concatenated series — sorting on abnormal return
Data frequency
Measurement interval Daily Weekly Monthly
Quarterly 0.092%
(0.261)
1-yr 0.336% 0.339%
(0.974) (0.998)
3-yr À0.048% À0.228% À0.347%
(À0.157) (À0.751) (À1.047)
The table lists average abnormal quarterly returns during post-ranking periods for the top decile of funds
sorted by abnormal return during ranking periods. We measure abnormal returns by ap estimated from
the four-factor stock selection model,
X4
rp;t ¼ ap þ bpk rk;t þ «p;t :
k¼1
We estimate post-ranking abnormal returns once over the entire sample using a concatenated post-
ranking return series. For the quarterly measurement intervals, we rank each quarter. For the one- and
three-year measurement intervals, we rank each year. For the one-quarter and one-year measurement
intervals in this table, the ranking and post-ranking periods are the same duration (i.e., one quarter, one
year, or three years). The three-year rows correspond to a three-year ranking period and a one-year post-
ranking period, which gives a single, continuous, concatenated, post-ranking period return series. Here,
the t-statistics are standard OLS (listed in parentheses). The sample consists of 230 mutual funds. The
sample period is from January 2, 1985 to December 29, 1995.
Table 12
Top decile post-ranking period performance by length of ranking
and post-ranking period: Concatenated series — sorting on return
Measurement interval Stock selection, ap
Quarterly À0.279%
(À0.659)
1-yr 0.139%
(0.405)
3-yr À0.487%
(À1.357)
The table lists average abnormal quarterly returns during post-
ranking periods for the top decile of funds sorted by return
during ranking periods. We measure abnormal returns by ap
estimated from the four-factor stock selection model,
X
4
rp;t ¼ ap þ bpk rk;t þ «p;t :
k¼1
We estimate post-ranking abnormal returns once over the entire
sample using a concatenated post-ranking monthly return series.
For the quarterly measurement intervals, we rank each quarter.
For the one- and three-year measurement intervals, we rank each
year. For the one-quarter and one-year measurement intervals in
this table, the ranking and post-ranking periods are the same
duration (i.e., one quarter, one year, or three years). The three-
year rows correspond to a three-year ranking period and a one-
year post-ranking period, which gives a single, continuous,
concatenated, post-ranking period return series. Here, the t-
statistics are standard OLS (listed in parentheses). The sample
consists of 230 mutual funds. The sample period is from January
2, 1985 to December 29, 1995.
590
23. Mutual Fund Performance
consistent with the findings using daily data, since the weekly or monthly
data necessitate extending the measurement window.
Table 10 shows the results when we sort mutual funds by return instead
of abnormal return. Carhart (1997) emphasizes a sort based on return
because his monthly data preclude efficient estimation of abnormal return
using measurement windows shorter than three years. When we use daily
data and quarter-year horizons, our estimate of post-ranking abnormal
return for the top decile shrinks from 39 basis points per quarter when we
sort on abnormal return to an insignificant 16 basis points when we sort
on return. This difference is consistent with the results in Table 3 and 4,
wherein the sort based on return failed to segregate funds by performance
in the post-ranking period. We interpret this result as evidence that sorting
by return fails to identify top performers. A sort based on return likely
correlates to a sort based on risk. When we sort and hold funds for one- or
three-year periods, the top decile performance erodes even further and
becomes negative.
One additional difference between our methodology and Carhart’s is
that we measure performance for the top decile of funds separately over
each post-ranking period. That is, we sort at the beginning of the quarter
based on last quarter’s performance, and we then estimate performance
over the following quarter for each fund in the top decile. Carhart (1997),
by contrast, creates a portfolio of the top decile of funds, concatenates the
post-ranking annual periods into one 31-year time series, and estimates
performance once. Again, his use of monthly returns necessitates this
procedure. A potential byproduct of the procedure, however, is distorted
inference due to erroneously specifying fixed factor loadings. Tables 11
and 12 show how our results change when we measure post-ranking
performance using a concatenated time series. Similar to Tables 9 and
10, we use measurement intervals of one quarter, one year, and three
years.10 In no case is the abnormal return in the post-ranking period
statistically significant. Table 11 shows the results when we rank funds
based on abnormal return. When we use daily data and quarter-year
horizons, the abnormal return of the top decile in the post-ranking quarter
is an insignificant 9 basis points. Hence, the concatenation procedure
eliminates the measured superior performance, just as the sort based on
return does in Table 10. Table 12 shows that when we sort funds by return
and measure performance in the post-ranking period using a concatenated
series of monthly returns, the abnormal return of the top decile drops to a
negative 28 basis points. These results indicate that the main differences
between our findings and Carhart’s are attributable to the different ranking
10
The three-year rows in Tables 11 and 12 correspond to a three-year ranking period and a one-year post-
ranking period. Using a one-year post-ranking period instead of a three-year post-ranking period in
Tables 11 and 12 produces a single, continuous, concatenated return series.
591
24. The Review of Financial Studies / v 18 n 2 2004
and post- ranking horizons used in our respective studies, as well as the
procedure for measuring abnormal return in the post-ranking period.
We have shown that performance persistence vanishes when perform-
ance is measured over longer periods. Superior performance appears to
be a short-lived phenomenon that is not detectable using annual windows.
The short-term nature of performance could be generated by short-term
informational advantages that some managers might be able to exploit.
Or, as embodied in the model in Berk and Green (2004), the short-term
performance could result from the actions of investors who rely on a
community of professional fund managers with heterogeneous ability
levels. Rational mutual fund investors form beliefs about managerial
ability based on past performance, allocating their capital toward those
managers who have demonstrated ability. Going forward, abnormal
performance erodes due to its decreasing returns to scale and due to the
possibility that a manager increases fees.
We have also shown that performance persistence vanishes when per-
formance is measured using a single concatenated series rather than using
separate three-month post-ranking periods. An explanation for this phe-
nomenon is based on the difference between conditional and uncondi-
tional performance measures.11 Ferson and Schadt (1996) create
conditional versions of the standard mutual fund performance regressions
used in this article. They model dynamic fund strategies by specifying
factor loadings as linear functions of available information, including the
dividend yield of the CRSP stock index, the slope of the term structure,
and the corporate credit spread. Empirically, Ferson and Schadt find that
the performance of mutual fund managers in their sample appears to
improve modestly when evaluated using conditional measures instead of
unconditional ones.
Our use of unconditional models estimated over nonoverlapping three-
month horizons can be viewed as a non-parametric implementation of
Ferson and Schadt’s conditional model. We allow strategies (i.e., factor
loadings) to change, perhaps as a result of public or proprietary informa-
tion useful for predicting factor returns, while specifying neither the
information sources nor the response of factor loadings to information.
To understand how this interpretation can explain the link between per-
formance and horizon, define the abnormal return of fund p, labeled ap in
Equation (1), over quarter q as
X4
ap;q ¼ mp;q À bp;k;q mk;q , ð7Þ
k¼1
where mp, q and mk, q are the average return of fund p and factor k,
respectively, and bp, k, q is the factor loading of fund p on factor k, during
11
We thank a referee for this explanation.
592
25. Mutual Fund Performance
quarter q. Now consider the expected abnormal return over a sequence of
quarters:
X
4
E½ap;q Š ¼ E½mp;q Š À E½bp;k;q mk;q Š, ð8Þ
k¼1
or
X
4 X
4
E½ap;q Š ¼ E½mp;q Š À E½bp;k;q ŠE½mk;q Š À covðbp;k;q ; mk;q Þ, ð9Þ
k¼1 k¼1
whereas the abnormal return measured once over the entire period is
given by
X
4
ap ¼ mp À bp;k mk : ð10Þ
k¼1
Now the first two terms on the right-hand side of Equation (9) are
approximately equal to the right-hand side of Equation (10), since the
average of the three-month factor loadings should be approximately equal
to the factor loading estimated over the entire period. Thus, the difference
between the expected quarterly abnormal return and the abnormal return
estimated once over the entire period is given by
X
4
E½ap;q Š À ap ¼ À covðbp;k;q , mk;q Þ: ð11Þ
k¼1
This result implies that short-term abnormal performance can be hidden
when performance is measured over a longer horizon if there is negative
covariance between quarterly factor loadings and factor returns. We find
an average abnormal return of 39 basis points per quarter for the top
decile when performance is measured using daily data over quarterly
horizons, as listed in Table 9. In contrast, the abnormal return is 9 basis
points when it is measured once over the entire sample, as shown in
Table 11. Thus, the difference on the left-hand side of Equation (11) is
positive, implying that the fund managers in our sample display negative
timing activity when measured once over the entire time series using
quarterly frequency data. Quarterly factor loadings are higher when
quarterly factor returns are lower, and vice versa.
To test this explanation, we compute the covariances between the factor
returns and the average factor loadings of the funds in our top decile
across the post-ranking quarters. We do indeed find negative covariances
for all four factors, all of comparable magnitude, and the absolute mag-
nitude of the sum of the covariances is approximately equal to the 30 basis
points (39 basis points À9 basis points) difference we are trying to explain.
This result implies negative timing ability for each factor when ability is
measured once over the entire sample period with quarterly frequency
data. In contrast, our results in the previous section imply positive market
593
26. The Review of Financial Studies / v 18 n 2 2004
timing ability when ability is measured using daily returns within each
three-month post-ranking period.
What is the link between horizon and performance? The top decile of
fund managers in aggregate may have positive short-term market timing
ability, but may fail to time the market over longer horizons. As noted in
Jagannathan and Korajczyk (1986), estimates of negative, or perverse,
market timing ability have been documented consistently in previous
research. Warther (1995), Ferson and Schadt (1996), and Edelen (1999)
explain this anomaly as a consequence of a relation between fund perform-
ance and cash flow: investor subscriptions drive down a mutual fund’s
beta when market returns are high. Our findings can be interpreted as
evidence of this pattern. Top performers exhibit abnormal performance
over the short term, but are punished in aggregate and over the long term
by supplying liquidity to investors, who distort the funds’ factor loadings
at inopportune times.
5. Conclusion
In this article, we revisit the issue of persistence in mutual fund perform-
ance, emphasizing short measurement periods. We rank funds every
quarter by their risk-adjusted return measured over a three-month period
using stock selection, market timing, and mixed strategy models. We then
measure the risk-adjusted return of deciles of funds over the following
three-month period. We find that the top decile of funds generates a
statistically significant abnormal return in the post-ranking quarter of
25–39 basis points across the performance models.
We conduct a number of tests to ensure that our results are not spu-
rious. First, our analysis generates results that are robust across stock
selection, market timing, and mixed strategy models, which suggest that
misspecification of the performance model is not driving the results.
Second, we create a set of synthetic fund returns by simulating a momen-
tum strategy. The after-expenses abnormal returns of these funds are, in
almost all cases, negative. Third, we create a variety of momentum factors
to reflect different momentum frequencies. Our results are robust across
these momentum factors. Fourth, we ensure that the abnormal returns
cannot be generated by exploiting Lo and MacKinlay’s (1990) cross-
autocorrelation anomaly. Fifth, we ensure that the abnormal returns are
not a spurious microstructure effect by reproducing our main result using
monthly returns instead of daily returns.
Our results conflict with those of Carhart (1997), who finds no evidence
of superior ability after controlling for the momentum anomaly. To
determine possible sources of these disparate results, we rerun the analysis
several times, each time varying our methodology so that it follows
Carhart’s more closely. We find that when funds are sorted by return
594
27. Mutual Fund Performance
rather than abnormal return, the post-ranking performance spread
between the top and bottom deciles disappears. We also increase the
length of time over which we measure risk-adjusted returns, both in
the sorting procedure and in the post-ranking procedure. We find that
the abnormal return of the top decile disappears in both cases. Finally, we
form a concatenated series of post-ranking returns and estimate perform-
ance for each decile once over this time series, rather than estimating
performance separately over each post-ranking quarter. We find no
evidence of ability using the concatenated returns, and isolate a negative
long-term relation between factor loadings and factor returns as the
source of the difference between the results of different horizons. We
relate the difference between short- and long-term performance measures
to the difference between conditional and unconditional performance
measures.
Our results are consistent with prior research that show that investor
cash flows can distort inference in mutual fund performance. The impact
of cash flow on performance can be controlled for using conditional
methods, as in Edelen (1999). Our use of quarterly measurement periods
can be viewed as an alternative approach to control for cash flow, by
allowing mutual fund factor loadings to change over time.
Although our findings are statistically significant, and are robust to a
battery of diagnostic tests, the economic significance of persistence in
mutual fund abnormal returns is questionable. After taking into account
transaction costs and taxes, investors may generate superior returns by
following a naive buy-and-hold approach rather than a performance-
chasing strategy, even if short-term performance is predictable.
References
Berk, J., and R. Green, 2004, ‘‘Mutual Fund Flows and Performance in Rational Markets,’’. Forth
coming, Journal of Political Economy.
Bollen, N., and J. Busse, 2001, ‘‘On the Timing Ability of Mutual Fund Managers,’’ Journal of Finance,
56, 1075–1094.
Brown, S., and W. Goetzmann, 1995, ‘‘Performance Persistence,’’ Journal of Finance, 50, 679–698.
Brown, S., W. Goetzmann, R. Ibbotson, and S. Ross, 1992, ‘‘Survivorship Bias in Performance Studies,’’
Review of Financial Studies, 4, 553–580.
Brown, K., W. Harlow, and L. Starks, 1996, ‘‘Of Tournaments and Temptations: An Analysis of
Managerial Incentives in the Mutual Fund Industry,’’ Journal of Finance, 51, 85–110.
Busse, J., 1999, ‘‘Volatility Timing in Mutual Funds: Evidence from Daily Returns,’’ Review of Financial
Studies, 12, 1009–1041.
Carhart, M., 1997, ‘‘On Persistence in Mutual Fund Performance,’’ Journal of Finance, 52, 57–82.
Carhart, M., R. Kaniel, D. Musto, and A. Reed, 2002, ‘‘Learning for the Tape: Evidence of Gaming
Behavior in Equity Mutual Funds,’’ Journal of Finance, 57, 661–693.
Chance, D., and M. Hemler, 2001, ‘‘The Performance of Professional Market Timers: Daily Evidence
from Executed Strategies,’’ Journal of Financial Economics, 62, 377–411.
595
28. The Review of Financial Studies / v 18 n 2 2004
Chevalier, J., and G. Ellison, 1999, ‘‘Career Concerns of Mutual Fund Managers,’’ Quarterly Journal of
Economics, 114, 389–432.
Daniel, K., M. Grinblatt, S. Titman, and R. Wermers, 1997, ‘‘Measuring Mutual Fund Performance with
Characteristic-Based Benchmarks,’’ Journal of Finance, 52, 1035–1058.
Dimson, E., 1979, ‘‘Risk Measurement When Shares are Subject to Infrequent Trading,’’ Journal of
Financial Economics, 7, 197–226.
Edelen, R., 1999, ‘‘Investor Flows and the Assessed Performance of Open-End Mutual Funds,’’ Journal
of Financial Economics, 53, 439–466.
Elton, E., M. Gruber, S. Das, and M. Hlavka, 1992, ‘‘Efficiency with Costly Information: A
Reinterpretation of the Evidence for Managed Portfolios,’’ Review of Financial Studies, 6, 1–22.
Fama, E., and K. French, 1993, ‘‘Common Risk Factors in the Returns on Stocks and Bonds,’’ Journal of
Financial Economics, 33, 3–56.
Fama, E., and J. MacBeth, 1973, ‘‘Risk, Return, and Equilibrium: Empirical Tests,’’ Journal of Political
Economy, 81, 607–636.
Ferson, W., and R. Schadt, 1996, ‘‘Measuring Fund Strategy and Performance in Changing Economic
Conditions,’’ Journal of Finance, 51, 425–461.
Goetzmann, W., and R. Ibbotson, 1994, ‘‘Do Winners Repeat? Patterns in Mutual Fund Performance,’’
Journal of Portfolio Management, 20, 9–18.
Graham, J., and C. Harvey, 1996, ‘‘Market Timing and Volatility Implied in Investment Newsletters’
Asset Allocation Recommendations,’’ Journal of Financial Economics, 42, 397–421.
Grinblatt, M., and M. Keloharju, 2000, ‘‘The Investment Behavior and Performance of Various Investor
Types: A Study of Finland’s Unique Data Set,’’ Journal of Financial Economics, 55, 43–67.
Grinblatt, M., S. Titman, and R. Wermers, 1995, ‘‘Momentum Investing Strategies, Portfolio Performance,
and Herding: A Study of Mutual Fund Behavior,’’ American Economic Review, 85, 1088–1105.
Grossman, S., and J. Stiglitz, 1980, ‘‘On the Impossibility of Informationally Efficient Markets,’’
American Economic Review 70, 393–408.
Gruber, M., 1996, ‘‘Another Puzzle: The Growth in Actively Managed Mutual Funds,’’ Journal of
Finance, 51, 783–810.
Hendricks, D., J. Patel, and R. Zeckhauser, 1993, ‘‘Hot Hands in Mutual Funds: Short-Run Persistence
of Performance, 1974–1988,’’ Journal of Finance, 48, 93–130.
Henriksson, R., 1984, ‘‘Market Timing and Mutual Fund Performance: An Empirical Investigation,’’
Journal of Business, 57, 73–97.
Henriksson, R., and R. Merton, 1981, ‘‘On Market Timing and Investment Performance. II. Statistical
Procedures for Evaluating Forecasting Skills,’’ Journal of Business, 54, 513–533.
Investment Company Institute, 2001, 2001 Mutual Fund Fact Book, Investment Company Institute,
Washington, DC.
Ippolito, R., 1989, ‘‘Efficiency with Costly Information: A Study of Mutual Fund Performance,
1965–1984,’’ Quarterly Journal of Economics, 104, 1–23.
Jagannathan, R., and R. Korajczyk, 1986, ‘‘Assessing the Market Timing Performance of Managed
Portfolios,’’ Journal of Business, 59, 217–235.
Jegadeesh, N., and S. Titman, 1993, ‘‘Returns to Buying Winners and Selling Losers: Implications for
Stock Market Efficiency,’’ Journal of Finance, 48, 65–91.
Jensen, M., 1968, ‘‘The Performance of Mutual Funds in the Period 1945–1964,’’ Journal of Finance,
23, 389–416.
596
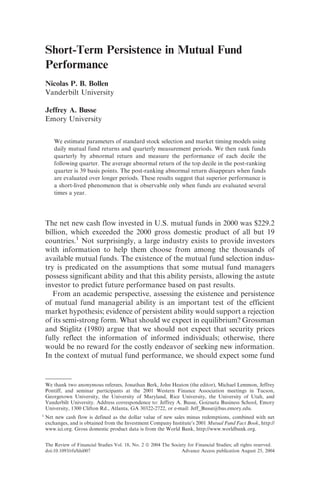
![The Review of Financial Studies / v 18 n 2 2004
managers to possess an informational advantage, but over what horizon?
Berk and Green (2004) show theoretically that a fund manager’s informa-
tional advantage will be short-lived when investors direct their capital
to recent winners. The goal of this article, therefore, is to determine
empirically whether ability persists over a relatively short horizon.
Studies of ability focus on two types of managerial activity. Stock
selection refers to predicting returns of individual stocks; market timing
refers to predicting relative returns of broad asset classes. Prior studies
generally share two features. First, most use monthly returns. Second,
with some exceptions, the majority of studies find little evidence that fund
managers generate positive abnormal returns over long horizons by fol-
lowing either a stock selection or a market timing strategy. Examples
include Jensen (1969) and Elton et al. (1992) for stock selection over
periods of 10–20 years, and Treynor and Mazuy (1966) and Henriksson
(1984) for market timing over periods of 6–10 years.
A number of studies, however, find evidence that stock selection ability
persists over periods as short as one year. These studies find that although
funds on average generate negative abnormal returns, relative
performance persists. Persistence studies include Hendricks, Patel, and
Zeckhauser (1993), Goetzmann and Ibbotson (1994), Brown and
Goetzmann (1995), Grinblatt, Titman, and Wermers (1995), Gruber
(1996), Carhart (1997), Daniel et al. (1997), Nofsinger and Sias (1999),
Wermers (1999), and Grinblatt and Keloharju (2000). Most of these
articles attribute persistence at least in part to fund manager skill.
Grinblatt, Titman, and Wermers (1995) and Carhart (1997), however,
argue that the superior performance of top funds is a result of the
momentum effect of Jegadeesh and Titman (1993). After including a
momentum factor in his return model, Carhart finds that persistence
largely disappears, except among the lowest performers, where it arises
from persistently high expenses. This result suggests that fund managers
possess little stock selection skill, since the top performing funds generate
their superior returns simply by holding stocks that have recently had
high returns.
In this article, we revisit the issue of persistence in mutual fund perform-
ance and focus on a relatively short measurement period of three months.
To the extent that superior performance is short-lived, perhaps due to the
competitive nature of the mutual fund industry [see Berk and Green
(2004)] or to managerial turnover [see Chevalier and Ellison (1999)], a
short measurement horizon provides a more precise method of identifying
top performers. Analysis of quarterly periods is not possible with monthly
returns because the short time series of observations precludes efficient
estimation. For this reason we use daily mutual fund returns.
We start by estimating parameters of standard stock selection and
market timing models over subsets of our mutual fund return data. For
570](data:image/gif;base64,R0lGODlhAQABAIAAAAAAAP///yH5BAEAAAAALAAAAAABAAEAAAIBRAA7)