BLOOM Lean Enterprise Experiment Canvas
•
21 j'aime•22,382 vues

The steps are based on the Lean Analytics approach described by Alistair Croll and Ben Yoskovitz. The BLOOM Lean Enterprise Experiment Canvas is based on Javelin's Experiment Board, it can be distributed freely and derivative work can be created as long as it also references Javelin's Experiment Board. (http://javelin.com/experiment-board.html) Download at: http://www.bloomamsterdam.com/wp-content/uploads/2014/05/BLOOM-Lean-Enterprise-Experiment-Canvas.pdf

Recommandé
Recommandé
Contenu connexe
Dernier
Dernier (20)
En vedette
En vedette (20)
BLOOM Lean Enterprise Experiment Canvas
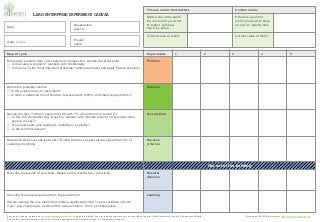
- 1. Success criterion Get out of the building Result & decision Learning Date: Responsible person: Project name: Step of cycle Phrase the problem from your customers' perspective. Include the proof point. ☐ Is this really a problem? (validate with clients/data) ☐ Is this one of the most important problems? (estimate impact and apply Pareto principle) Define the possible solution ☐ Is the solution easy to implement? ☐ Is there a balanced mix of iterative improvements (±80%) and major leaps (±20%)? Design the test (“I will run experiment #X with Y% of customers in period Z”) ☐ Is this this the fastest way to test my solution with minimal amount of resources (time, people, money)? ☐ Do actual users give feedback, implicitly or explicitly? ☐ Is the test time-boxed? Experiments 1 2 3 4 5 Problem Solution Test method The one metric that matters Control metric Draw a line in the sand: the one metric you want to impact, with how much, by when If there is a control metric you want to keep an eye on, specify here Current value of metric Current value of metric Determine what success looks like (“During the test, I expect strong signal from X% of customers”/visitors) Describe the results of your tests. Based on the results, take a decision Describe the lessons learned from the experiment Did we change the one metric that matters significantly? Are control variables still ok? If yes: pop champagne, and build the actual solution. If not: pivot/persevere. LEAN ENTERPRISE EXPERIMENT CANVAS Enterprise Canvas is based on Javelin's Experiment Board, it can be distributed freely and derivative work can be created as long as it also reference's Javelin's Experiment Board. This work is complementary to the Lean Analytics approach as described by Alistair Croll and Ben Yoskovitz. Goal: to learn More about BLOOM services at www.bloomamsterdam.com.
- 2. 2 Start-ups and large enterprises have different requirements for lean experimentation Start-up Enterprise Difference in approach • Reduce most waste by limiting the time spent on product nobody will use • Reduce most waste by using roadmap time only to solve issues that have impact on the bottom line • Experiments focus on feature optimisation, less on new product development • Focus on customer development • Focus on customer satisfaction • Improve for existing customer base first, not look for a new one • Data-poor, decisions are often made based on qualitative data. • Data-rich, prioritise to find the most important issues to improve • Problems can be prioritised based on data • Still building a brand: it is good to move fast and break stuff • Reputation is one of the strongest assets. Customers rely on quality of service • MVPs require a higher level of quality • Everybody is in, small companies make collective decisions • Need top management buy in • Need top management buy in for experimentation • Start-ups are a small team with a common goal • Enterprises are comprised of many departments • Goal of department should be closely aligned with goal of the company
- 3. Success criterion Get out of the building Result & decision Learning Date: Responsible person: Project name: Step of cycle Phrase the problem from your customers' perspective. Include the proof point. ☐ Is this really a problem? (validate with clients/data) ☐ Is this one of the most important problems? (estimate impact and apply Pareto principle) Define the possible solution ☐ Is the solution easy to implement? ☐ Is there a balanced mix of iterative improvements (±80%) and major leaps (±20%)? Design the test (“I will run experiment #X with Y% of customers in period Z”) ☐ Is this this the fastest way to test my solution with minimal amount of resources (time, people, money)? ☐ Do actual users give feedback, implicitly or explicitly? ☐ Is the test time-boxed? Experiments 1 2 3 4 5 Problem Solution Test method The one metric that matters Control metric Draw a line in the sand: the one metric you want to impact, with how much, by when If there is a control metric you want to keep an eye on, specify here Current value of metric Current value of metric Determine what success looks like (“During the test, I expect strong signal from X% of customers”/visitors) Describe the results of your tests. Based on the results, take a decision Describe the lessons learned from the experiment Did we change the one metric that matters significantly? Are control variables still ok? If yes: pop champagne, and build the actual solution. If not: pivot/persevere. LEAN ENTERPRISE EXPERIMENT CANVAS Goal: to learn % of visitors that answer the poll “was this answer useful?” with “YES” Goal: 10% 4% of visitors reply to poll with a positive answer Number of visitors/ month shouldn’t drop 1.5M / month Enterprise Canvas is based on Javelin's Experiment Board, it can be distributed freely and derivative work can be created as long as it also reference's Javelin's Experiment Board. This work is complementary to the Lean Analytics approach as described by Alistair Croll and Ben Yoskovitz. More about BLOOM services at www.bloomamsterdam.com.
- 4. Success criterion Get out of the building Result & decision Learning Date: Responsible person: Project name: Step of cycle Phrase the problem from your customers' perspective. Include the proof point. ☐ Is this really a problem? (validate with clients/data) ☐ Is this one of the most important problems? (estimate impact and apply Pareto principle) Define the possible solution ☐ Is the solution easy to implement? ☐ Is there a balanced mix of iterative improvements (±80%) and major leaps (±20%)? Design the test (“I will run experiment #X with Y% of customers in period Z”) ☐ Is this this the fastest way to test my solution with minimal amount of resources (time, people, money)? ☐ Do actual users give feedback, implicitly or explicitly? ☐ Is the test time-boxed? Experiments 1 2 3 4 5 Problem Solution Test method The one metric that matters Control metric Draw a line in the sand: the one metric you want to impact, with how much, by when If there is a control metric you want to keep an eye on, specify here Current value of metric Current value of metric Determine what success looks like (“During the test, I expect strong signal from X% of customers”/visitors) Describe the results of your tests. Based on the results, take a decision Describe the lessons learned from the experiment Did we change the one metric that matters significantly? Are control variables still ok? If yes: pop champagne, and build the actual solution. If not: pivot/persevere. LEAN ENTERPRISE EXPERIMENT CANVAS Goal: to learn % of visitors that answer the poll “was this answer useful?” with “YES” Goal: 10% 4% of visitors reply to poll with a positive answer Number of visitors/ month shouldn’t drop 1.5M / month Search function does not provide relevant results Proofpoint: Low number of clicks on search results Navigation structure is unclear Proofpoint: Large drop-off before reaching any answer Enterprise Canvas is based on Javelin's Experiment Board, it can be distributed freely and derivative work can be created as long as it also reference's Javelin's Experiment Board. This work is complementary to the Lean Analytics approach as described by Alistair Croll and Ben Yoskovitz. More about BLOOM services at www.bloomamsterdam.com.
- 5. Success criterion Get out of the building Result & decision Learning Date: Responsible person: Project name: Step of cycle Phrase the problem from your customers' perspective. Include the proof point. ☐ Is this really a problem? (validate with clients/data) ☐ Is this one of the most important problems? (estimate impact and apply Pareto principle) Define the possible solution ☐ Is the solution easy to implement? ☐ Is there a balanced mix of iterative improvements (±80%) and major leaps (±20%)? Design the test (“I will run experiment #X with Y% of customers in period Z”) ☐ Is this this the fastest way to test my solution with minimal amount of resources (time, people, money)? ☐ Do actual users give feedback, implicitly or explicitly? ☐ Is the test time-boxed? Experiments 1 2 3 4 5 Problem Solution Test method The one metric that matters Control metric Draw a line in the sand: the one metric you want to impact, with how much, by when If there is a control metric you want to keep an eye on, specify here Current value of metric Current value of metric Determine what success looks like (“During the test, I expect strong signal from X% of customers”/visitors) Describe the results of your tests. Based on the results, take a decision Describe the lessons learned from the experiment Did we change the one metric that matters significantly? Are control variables still ok? If yes: pop champagne, and build the actual solution. If not: pivot/persevere. LEAN ENTERPRISE EXPERIMENT CANVAS Goal: to learn % of visitors that answer the poll “was this answer useful?” with “YES” Goal: 10% 4% of visitors reply to poll with a positive answer Number of visitors/ month shouldn’t drop 1.5M / month Search function does not provide relevant results Proofpoint: Low number of clicks on search results Navigation structure is unclear Proofpoint: Large drop-off before reaching any answer Enterprise Canvas is based on Javelin's Experiment Board, it can be distributed freely and derivative work can be created as long as it also reference's Javelin's Experiment Board. This work is complementary to the Lean Analytics approach as described by Alistair Croll and Ben Yoskovitz. More about BLOOM services at www.bloomamsterdam.com.
- 6. Success criterion Get out of the building Result & decision Learning Date: Responsible person: Project name: Step of cycle Phrase the problem from your customers' perspective. Include the proof point. ☐ Is this really a problem? (validate with clients/data) ☐ Is this one of the most important problems? (estimate impact and apply Pareto principle) Define the possible solution ☐ Is the solution easy to implement? ☐ Is there a balanced mix of iterative improvements (±80%) and major leaps (±20%)? Design the test (“I will run experiment #X with Y% of customers in period Z”) ☐ Is this this the fastest way to test my solution with minimal amount of resources (time, people, money)? ☐ Do actual users give feedback, implicitly or explicitly? ☐ Is the test time-boxed? Experiments 1 2 3 4 5 Problem Solution Test method The one metric that matters Control metric Draw a line in the sand: the one metric you want to impact, with how much, by when If there is a control metric you want to keep an eye on, specify here Current value of metric Current value of metric Determine what success looks like (“During the test, I expect strong signal from X% of customers”/visitors) Describe the results of your tests. Based on the results, take a decision Describe the lessons learned from the experiment Did we change the one metric that matters significantly? Are control variables still ok? If yes: pop champagne, and build the actual solution. If not: pivot/persevere. LEAN ENTERPRISE EXPERIMENT CANVAS Goal: to learn % of visitors that answer the poll “was this answer useful?” with “YES” Goal: 10% 4% of visitors reply to poll with a positive answer Number of visitors/ month shouldn’t drop 1.5M / month Search function does not provide relevant results Proofpoint: Low number of clicks on search results Add filters to improve search results Navigation structure is unclear Proofpoint: Large drop-off before reaching any answer Build a new search tool with higher accuracy Increase UX of the search results Enterprise Canvas is based on Javelin's Experiment Board, it can be distributed freely and derivative work can be created as long as it also reference's Javelin's Experiment Board. This work is complementary to the Lean Analytics approach as described by Alistair Croll and Ben Yoskovitz. More about BLOOM services at www.bloomamsterdam.com.
- 7. Success criterion Get out of the building Result & decision Learning Date: Responsible person: Project name: Step of cycle Phrase the problem from your customers' perspective. Include the proof point. ☐ Is this really a problem? (validate with clients/data) ☐ Is this one of the most important problems? (estimate impact and apply Pareto principle) Define the possible solution ☐ Is the solution easy to implement? ☐ Is there a balanced mix of iterative improvements (±80%) and major leaps (±20%)? Design the test (“I will run experiment #X with Y% of customers in period Z”) ☐ Is this this the fastest way to test my solution with minimal amount of resources (time, people, money)? ☐ Do actual users give feedback, implicitly or explicitly? ☐ Is the test time-boxed? Experiments 1 2 3 4 5 Problem Solution Test method The one metric that matters Control metric Draw a line in the sand: the one metric you want to impact, with how much, by when If there is a control metric you want to keep an eye on, specify here Current value of metric Current value of metric Determine what success looks like (“During the test, I expect strong signal from X% of customers”/visitors) Describe the results of your tests. Based on the results, take a decision Describe the lessons learned from the experiment Did we change the one metric that matters significantly? Are control variables still ok? If yes: pop champagne, and build the actual solution. If not: pivot/persevere. LEAN ENTERPRISE EXPERIMENT CANVAS Goal: to learn % of visitors that answer the poll “was this answer useful?” with “YES” Goal: 10% 4% of visitors reply to poll with a positive answer Number of visitors/ month shouldn’t drop 1.5M / month Search function does not provide relevant results Proofpoint: Low number of clicks on search results Add filters to improve search results Navigation structure is unclear Proofpoint: Large drop-off before reaching any answer Build a new search tool with higher accuracy Increase UX of the search results Enterprise Canvas is based on Javelin's Experiment Board, it can be distributed freely and derivative work can be created as long as it also reference's Javelin's Experiment Board. This work is complementary to the Lean Analytics approach as described by Alistair Croll and Ben Yoskovitz. More about BLOOM services at www.bloomamsterdam.com.
- 8. Success criterion Get out of the building Result & decision Learning Date: Responsible person: Project name: Step of cycle Phrase the problem from your customers' perspective. Include the proof point. ☐ Is this really a problem? (validate with clients/data) ☐ Is this one of the most important problems? (estimate impact and apply Pareto principle) Define the possible solution ☐ Is the solution easy to implement? ☐ Is there a balanced mix of iterative improvements (±80%) and major leaps (±20%)? Design the test (“I will run experiment #X with Y% of customers in period Z”) ☐ Is this this the fastest way to test my solution with minimal amount of resources (time, people, money)? ☐ Do actual users give feedback, implicitly or explicitly? ☐ Is the test time-boxed? Experiments 1 2 3 4 5 Problem Solution Test method The one metric that matters Control metric Draw a line in the sand: the one metric you want to impact, with how much, by when If there is a control metric you want to keep an eye on, specify here Current value of metric Current value of metric Determine what success looks like (“During the test, I expect strong signal from X% of customers”/visitors) Describe the results of your tests. Based on the results, take a decision Describe the lessons learned from the experiment Did we change the one metric that matters significantly? Are control variables still ok? If yes: pop champagne, and build the actual solution. If not: pivot/persevere. LEAN ENTERPRISE EXPERIMENT CANVAS Goal: to learn % of visitors that answer the poll “was this answer useful?” with “YES” Goal: 10% 4% of visitors reply to poll with a positive answer Number of visitors/ month shouldn’t drop 1.5M / month Search function does not provide relevant results Proofpoint: Low number of clicks on search results Add filters to improve search results Add filter for key question categories Run for 2 weeks with 10% of visitors Navigation structure is unclear Proofpoint: Large drop-off before reaching any answer Build a new search tool with higher accuracy Increase UX of the search results Enterprise Canvas is based on Javelin's Experiment Board, it can be distributed freely and derivative work can be created as long as it also reference's Javelin's Experiment Board. This work is complementary to the Lean Analytics approach as described by Alistair Croll and Ben Yoskovitz. More about BLOOM services at www.bloomamsterdam.com.
- 9. Success criterion Get out of the building Result & decision Learning Date: Responsible person: Project name: Step of cycle Phrase the problem from your customers' perspective. Include the proof point. ☐ Is this really a problem? (validate with clients/data) ☐ Is this one of the most important problems? (estimate impact and apply Pareto principle) Define the possible solution ☐ Is the solution easy to implement? ☐ Is there a balanced mix of iterative improvements (±80%) and major leaps (±20%)? Design the test (“I will run experiment #X with Y% of customers in period Z”) ☐ Is this this the fastest way to test my solution with minimal amount of resources (time, people, money)? ☐ Do actual users give feedback, implicitly or explicitly? ☐ Is the test time-boxed? Experiments 1 2 3 4 5 Problem Solution Test method The one metric that matters Control metric Draw a line in the sand: the one metric you want to impact, with how much, by when If there is a control metric you want to keep an eye on, specify here Current value of metric Current value of metric Determine what success looks like (“During the test, I expect strong signal from X% of customers”/visitors) Describe the results of your tests. Based on the results, take a decision Describe the lessons learned from the experiment Did we change the one metric that matters significantly? Are control variables still ok? If yes: pop champagne, and build the actual solution. If not: pivot/persevere. LEAN ENTERPRISE EXPERIMENT CANVAS Goal: to learn % of visitors that answer the poll “was this answer useful?” with “YES” Goal: 10% 4% of visitors reply to poll with a positive answer Number of visitors/ month shouldn’t drop 1.5M / month Search function does not provide relevant results Proofpoint: Low number of clicks on search results Add filters to improve search results Add filter for key question categories Run for 2 weeks with 10% of visitors Expect +30% click-through to answer pages from search results when visitors use the filter Navigation structure is unclear Proofpoint: Large drop-off before reaching any answer Build a new search tool with higher accuracy Increase UX of the search results Enterprise Canvas is based on Javelin's Experiment Board, it can be distributed freely and derivative work can be created as long as it also reference's Javelin's Experiment Board. This work is complementary to the Lean Analytics approach as described by Alistair Croll and Ben Yoskovitz. More about BLOOM services at www.bloomamsterdam.com.
- 10. Success criterion Get out of the building Result & decision Learning Date: Responsible person: Project name: Step of cycle Phrase the problem from your customers' perspective. Include the proof point. ☐ Is this really a problem? (validate with clients/data) ☐ Is this one of the most important problems? (estimate impact and apply Pareto principle) Define the possible solution ☐ Is the solution easy to implement? ☐ Is there a balanced mix of iterative improvements (±80%) and major leaps (±20%)? Design the test (“I will run experiment #X with Y% of customers in period Z”) ☐ Is this this the fastest way to test my solution with minimal amount of resources (time, people, money)? ☐ Do actual users give feedback, implicitly or explicitly? ☐ Is the test time-boxed? Experiments 1 2 3 4 5 Problem Solution Test method The one metric that matters Control metric Draw a line in the sand: the one metric you want to impact, with how much, by when If there is a control metric you want to keep an eye on, specify here Current value of metric Current value of metric Determine what success looks like (“During the test, I expect strong signal from X% of customers”/visitors) Describe the results of your tests. Based on the results, take a decision Describe the lessons learned from the experiment Did we change the one metric that matters significantly? Are control variables still ok? If yes: pop champagne, and build the actual solution. If not: pivot/persevere. LEAN ENTERPRISE EXPERIMENT CANVAS Goal: to learn % of visitors that answer the poll “was this answer useful?” with “YES” Goal: 10% 4% of visitors reply to poll with a positive answer Number of visitors/ month shouldn’t drop 1.5M / month Search function does not provide relevant results Proofpoint: Low number of clicks on search results Add filters to improve search results Add filter for key question categories Run for 2 weeks with 10% of visitors Expect +30% click-through to answer pages from search results when visitors use the filter Navigation structure is unclear Proofpoint: Large drop-off before reaching any answer Build a new search tool with higher accuracy Increase UX of the search results Did we reach our success criterion? Enterprise Canvas is based on Javelin's Experiment Board, it can be distributed freely and derivative work can be created as long as it also reference's Javelin's Experiment Board. This work is complementary to the Lean Analytics approach as described by Alistair Croll and Ben Yoskovitz. More about BLOOM services at www.bloomamsterdam.com.
- 11. Success criterion Get out of the building Result & decision Learning Date: Responsible person: Project name: Step of cycle Phrase the problem from your customers' perspective. Include the proof point. ☐ Is this really a problem? (validate with clients/data) ☐ Is this one of the most important problems? (estimate impact and apply Pareto principle) Define the possible solution ☐ Is the solution easy to implement? ☐ Is there a balanced mix of iterative improvements (±80%) and major leaps (±20%)? Design the test (“I will run experiment #X with Y% of customers in period Z”) ☐ Is this this the fastest way to test my solution with minimal amount of resources (time, people, money)? ☐ Do actual users give feedback, implicitly or explicitly? ☐ Is the test time-boxed? Experiments 1 2 3 4 5 Problem Solution Test method The one metric that matters Control metric Draw a line in the sand: the one metric you want to impact, with how much, by when If there is a control metric you want to keep an eye on, specify here Current value of metric Current value of metric Determine what success looks like (“During the test, I expect strong signal from X% of customers”/visitors) Describe the results of your tests. Based on the results, take a decision Describe the lessons learned from the experiment Did we change the one metric that matters significantly? Are control variables still ok? If yes: pop champagne, and build the actual solution. If not: pivot/persevere. LEAN ENTERPRISE EXPERIMENT CANVAS Goal: to learn % of visitors that answer the poll “was this answer useful?” with “YES” Goal: 10% 4% of visitors reply to poll with a positive answer Number of visitors/ month shouldn’t drop 1.5M / month Search function does not provide relevant results Proofpoint: Low number of clicks on search results Add filters to improve search results Add filter for key question categories Run for 2 weeks with 10% of visitors Expect +30% click-through to answer pages from search results when visitors use the filter Navigation structure is unclear Proofpoint: Large drop-off before reaching any answer Build a new search tool with higher accuracy Increase UX of the search results Did we reach our success criterion? No: Try a different solution Enterprise Canvas is based on Javelin's Experiment Board, it can be distributed freely and derivative work can be created as long as it also reference's Javelin's Experiment Board. This work is complementary to the Lean Analytics approach as described by Alistair Croll and Ben Yoskovitz. More about BLOOM services at www.bloomamsterdam.com.
- 12. Success criterion Get out of the building Result & decision Learning Date: Responsible person: Project name: Step of cycle Phrase the problem from your customers' perspective. Include the proof point. ☐ Is this really a problem? (validate with clients/data) ☐ Is this one of the most important problems? (estimate impact and apply Pareto principle) Define the possible solution ☐ Is the solution easy to implement? ☐ Is there a balanced mix of iterative improvements (±80%) and major leaps (±20%)? Design the test (“I will run experiment #X with Y% of customers in period Z”) ☐ Is this this the fastest way to test my solution with minimal amount of resources (time, people, money)? ☐ Do actual users give feedback, implicitly or explicitly? ☐ Is the test time-boxed? Experiments 1 2 3 4 5 Problem Solution Test method The one metric that matters Control metric Draw a line in the sand: the one metric you want to impact, with how much, by when If there is a control metric you want to keep an eye on, specify here Current value of metric Current value of metric Determine what success looks like (“During the test, I expect strong signal from X% of customers”/visitors) Describe the results of your tests. Based on the results, take a decision Describe the lessons learned from the experiment Did we change the one metric that matters significantly? Are control variables still ok? If yes: pop champagne, and build the actual solution. If not: pivot/persevere. LEAN ENTERPRISE EXPERIMENT CANVAS Goal: to learn % of visitors that answer the poll “was this answer useful?” with “YES” Goal: 10% 4% of visitors reply to poll with a positive answer Number of visitors/ month shouldn’t drop 1.5M / month Search function does not provide relevant results Proofpoint: Low number of clicks on search results Add filters to improve search results Add filter for key question categories Run for 2 weeks with 10% of visitors Expect +30% click-through to answer pages from search results when visitors use the filter Navigation structure is unclear Proofpoint: Large drop-off before reaching any answer Build a new search tool with higher accuracy Increase UX of the search results Did we reach our success criterion? Did we improve the one metric that matters enough to cross the line in the sand? No: Try a different solution Enterprise Canvas is based on Javelin's Experiment Board, it can be distributed freely and derivative work can be created as long as it also reference's Javelin's Experiment Board. This work is complementary to the Lean Analytics approach as described by Alistair Croll and Ben Yoskovitz. More about BLOOM services at www.bloomamsterdam.com.
- 13. Success criterion Get out of the building Result & decision Learning Date: Responsible person: Project name: Step of cycle Phrase the problem from your customers' perspective. Include the proof point. ☐ Is this really a problem? (validate with clients/data) ☐ Is this one of the most important problems? (estimate impact and apply Pareto principle) Define the possible solution ☐ Is the solution easy to implement? ☐ Is there a balanced mix of iterative improvements (±80%) and major leaps (±20%)? Design the test (“I will run experiment #X with Y% of customers in period Z”) ☐ Is this this the fastest way to test my solution with minimal amount of resources (time, people, money)? ☐ Do actual users give feedback, implicitly or explicitly? ☐ Is the test time-boxed? Experiments 1 2 3 4 5 Problem Solution Test method The one metric that matters Control metric Draw a line in the sand: the one metric you want to impact, with how much, by when If there is a control metric you want to keep an eye on, specify here Current value of metric Current value of metric Determine what success looks like (“During the test, I expect strong signal from X% of customers”/visitors) Describe the results of your tests. Based on the results, take a decision Describe the lessons learned from the experiment Did we change the one metric that matters significantly? Are control variables still ok? If yes: pop champagne, and build the actual solution. If not: pivot/persevere. LEAN ENTERPRISE EXPERIMENT CANVAS More about BLOOM services at www.bloomamsterdam.com. This work is licensed under a Creative Commons Attribution-ShareAlike 4.0 International License. Template inspired by Javelin Experiment Board. Complementary to the Lean Analytics approach as described by Alistair Croll and Ben Yoskovitz. Goal: to learn % of visitors that answer the poll “was this answer useful?” with “YES” Goal: 10% 4% of visitors reply to poll with a positive answer Number of visitors/ month shouldn’t drop 1.5M / month Search function does not provide relevant results Proofpoint: Low number of clicks on search results Add filters to improve search results Add filter for key question categories Run for 2 weeks with 10% of visitors Expect +30% click-through to answer pages from search results when visitors use the filter Navigation structure is unclear Proofpoint: Large drop-off before reaching any answer Build a new search tool with higher accuracy Increase UX of the search results Did we reach our success criterion? Did we improve the one metric that matters enough to cross the line in the sand? No: Try a different solution No: Work on solving a new problem
- 14. Success criterion Get out of the building Result & decision Learning Date: Responsible person: Project name: Step of cycle Phrase the problem from your customers' perspective. Include the proof point. ☐ Is this really a problem? (validate with clients/data) ☐ Is this one of the most important problems? (estimate impact and apply Pareto principle) Define the possible solution ☐ Is the solution easy to implement? ☐ Is there a balanced mix of iterative improvements (±80%) and major leaps (±20%)? Design the test (“I will run experiment #X with Y% of customers in period Z”) ☐ Is this this the fastest way to test my solution with minimal amount of resources (time, people, money)? ☐ Do actual users give feedback, implicitly or explicitly? ☐ Is the test time-boxed? Experiments 1 2 3 4 5 Problem Solution Test method The one metric that matters Control metric Draw a line in the sand: the one metric you want to impact, with how much, by when If there is a control metric you want to keep an eye on, specify here Current value of metric Current value of metric Determine what success looks like (“During the test, I expect strong signal from X% of customers”/visitors) Describe the results of your tests. Based on the results, take a decision Describe the lessons learned from the experiment Did we change the one metric that matters significantly? Are control variables still ok? If yes: pop champagne, and build the actual solution. If not: pivot/persevere. LEAN ENTERPRISE EXPERIMENT CANVAS More about BLOOM services at www.bloomamsterdam.com. This work is licensed under a Creative Commons Attribution-ShareAlike 4.0 International License. Template inspired by Javelin Experiment Board. Complementary to the Lean Analytics approach as described by Alistair Croll and Ben Yoskovitz. Goal: to learn % of visitors that answer the poll “was this answer useful?” with “YES” Goal: 10% 4% of visitors reply to poll with a positive answer Number of visitors/ month shouldn’t drop 1.5M / month Search function does not provide relevant results Proofpoint: Low number of clicks on search results Add filters to improve search results Add filter for key question categories Run for 2 weeks with 10% of visitors Expect +30% click-through to answer pages from search results when visitors use the filter Navigation structure is unclear Proofpoint: Large drop-off before reaching any answer Build a new search tool with higher accuracy Increase UX of the search results Did we reach our success criterion? Did we improve the one metric that matters enough to cross the line in the sand? No: Try a different solution Yes: Roll out full version of the solution to 100% of your customers No: Work on solving a new problem