Contenu connexe
Similaire à 9 7 12weekly (20)
9 7 12weekly
- 1. Commentary
Weekly Market Update
As of September 7, 2012
The Economy Stocks
Economic data remained mixed but looked slightly better Global equity markets rose for the week.
overall. SEI expects to see choppy markets through year-end In the U.S., value stocks outperformed growth stocks and
as political and economic uncertainties remain global small-company stocks outperformed large companies.
concerns. Industrial Products and Materials outperformed, while
JPMorgan reported that global service-sector expansion Consumer Staples and Utilities underperformed.
continued for the thirty-seventh straight month, but at a slower- Bonds
than-average pace, while manufacturing is notably weaker Global bond markets fell for the week.
than services. High yield bonds outperformed, followed by global government
The chief economist of the OECD warned of global recession, bonds. Corporate bonds lagged.
describing the eurozone as the "epicenter of the crisis" and The Treasury auctioned a sizeable $40 billion in 4-week T-bills
expressing new concerns about U.S. manufacturing. at a rate of 0.105%, and announced auctions of $21 billion of
August nonfarm payrolls disappointed, increasing 96,000 10-year notes and $13 billion of 30-year bonds next week.
against expectations of 125,000 with prior months revised
down 41,000. Unemployment fell to 8.1% as the result of
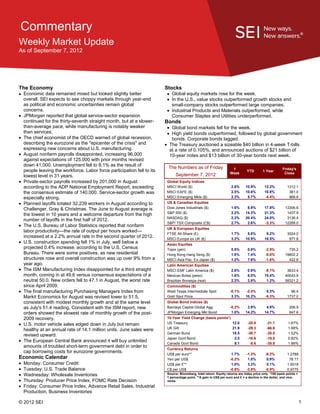
The Numbers as of Friday 1 Friday's
people leaving the workforce. Labor force participation fell to its YTD 1 Year
Week Close
lowest level in 31 years. September 7, 2012
Private-sector payrolls increased by 201,000 in August Global Equity Indices
according to the ADP National Employment Report, exceeding MSCI World ($) 2.6% 10.9% 12.2% 1312.1
the consensus estimate of 140,000. Service-sector growth was MSCI EAFE ($) 2.5% 10.6% 10.8% 381.0
especially strong. MSCI Emerging Mkts ($) 2.3% 5.7% -4.4% 968.8
Planned layoffs totaled 32,239 workers in August according to US & Canadian Equities
Challenger, Gray & Christmas. The June to August average is Dow Jones Industrials ($) 1.6% 8.9% 17.8% 13306.6
S&P 500 ($) 2.2% 14.3% 21.3% 1437.9
the lowest in 10 years and a welcome departure from the high
NASDAQ ($) 2.3% 20.4% 24.0% 3136.4
number of layoffs in the first half of 2012.
S&P/ TSX Composite (C$) 2.7% 2.6% -3.3% 12268.0
The U.S. Bureau of Labor Statistics reported that nonfarm
UK & European Equities
labor productivity—the rate of output per hours worked—
FTSE All-Share (£) 1.7% 5.8% 9.2% 3024.0
increased at a 2.2% annual rate in the second quarter of 2012. MSCI Europe ex UK (€) 3.2% 10.9% 16.5% 877.8
U.S. construction spending fell 1% in July, well below a Asian Equities
projected 0.4% increase, according to the U.S. Census Topix (yen) 0.5% 0.9% -2.9% 735.2
Bureau. There were some positives, as new residential Hong Kong Hang Seng ($) 1.6% 7.4% -0.6% 19802.2
structures rose and overall construction was up over 9% from a MSCI Asia Pac. Ex-Japan ($) 1.2% 7.6% -1.6% 422.8
year ago. Latin American Equities
The ISM Manufacturing Index disappointed for a third straight MSCI EMF Latin America ($) 2.6% 0.9% -8.1% 3633.4
month, coming in at 49.6 versus consensus expectations of a Mexican Bolsa (peso) 1.6% 8.0% 15.4% 40043.9
neutral 50.0. New orders fell to 47.1 in August, the worst rate Brazilian Bovespa (real) 2.2% 2.8% 1.2% 58321.2
since April 2009. Commodities ($)
The final manufacturing Purchasing Managers Index from West Texas Intermediate Spot -0.1% -2.4% 8.3% 96.4
Markit Economics for August was revised lower to 51.5, Gold Spot Price 3.3% 10.2% -6.3% 1737.0
consistent with modest monthly growth and at the same level Global Bond Indices ($)
as July's 51.4 reading. Consistent with the ISM report, new Barclays Capital Global Agg. -0.2% 3.9% 4.9% 206.9
orders showed the slowest rate of monthly growth of the post- JPMorgan Emerging Mkt Bond 1.0% 14.2% 14.7% 647.6
2009 recovery. 10-Year Yield Change (basis points*)
U.S. motor vehicle sales edged down in July but remain US Treasury 12.0 -20.8 -31.1 1.67%
UK Gilt 21.9 -29.3 -66.6 1.68%
healthy at an annual rate of 14.1 million units. June sales were
German Bund 18.5 -30.7 -35.0 1.52%
revised upward.
Japan Govt Bond 2.5 -16.6 -19.6 0.82%
The European Central Bank announced it will buy unlimited 8.1 -8.6 -35.8
Canada Govt Bond 1.86%
amounts of troubled short-term government debt in order to
Currency Returns
cap borrowing costs for eurozone governments. US$ per euro** 1.7% -1.3% -8.2% 1.2789
Economic Calendar Yen per US$ -0.2% 1.5% 0.9% 78.17
Monday: Consumer Credit US$ per £** 1.0% 3.3% 0.1% 1.6018
Tuesday: U.S. Trade Balance C$ per US$ -0.9% -3.8% -0.9% 0.9775
Wednesday: Wholesale Inventories Source: Bloomberg, total return. Equity returns are index price only. *100 basis points =
1 percentage point. **A gain in US$ per euro and £ = a decline in the dollar, and vice-
Thursday: Producer Price Index, FOMC Rate Decision versa.
Friday: Consumer Price Index, Advance Retail Sales, Industrial
Production, Business Inventories
© 2012 SEI 1
- 2. Santonocito & Associates
9310 NE 141 Pl.
Kirkland, WA 98034
(425)830-6612
bsantonocito@lincolninvestment.com
Advisory services and securities through Lincoln Investment Planning,
Inc. Registered Investment Advisor, Broker/Dealer Member FINRA/SIPC.
Santonocito & Associates and Lincoln Investment Planning are
independently owned and operated and each is responsible for its own
business. Supervising Office: 8230 Montgomery Road Suite 150
Cincinnati, OH 45236
Index returns are for illustrative purposes only and do not represent actual fund performance.
Index performance returns do not reflect any management fees, transaction costs or expenses. Indexes are unmanaged
and one cannot invest directly in an index. Past performance does not guarantee future results.
This material is provided by SEI Investments Management Corporation (SIMC) for educational purposes only and is not
meant to be investment advice. The reader should consult with his/her financial advisor for more information. This
material represents an assessment of the market environment at a specific point in time and is not intended to be a
forecast of future events, or a guarantee of future results. There are risks involved with investing, including possible loss
of principal. SIMC is a wholly owned subsidiary of SEI Investments Company.
© 2012 SEI 2