
Recommandé
Contenu connexe
En vedette
En vedette (20)
2011 Migration Patterns[1]
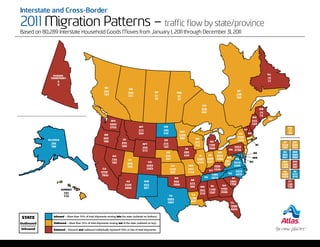
- 1. Interstate and Cross-Border 2011 Migration Patterns – traffic flow by state/province Based on 80,289 Interstate Household Goods Moves from January 1, 2011 through December 31, 2011 NL YUKON TERRITORY 15 0 17 0 BC AB 285 QC 304 SK MB 182 248 231 31 67 182 19 37 ON 878 NB 602 14 14 ME NS WA 333 2604 355 2752 MT ND NS 217 164 VT 73 MN 204 210 NY NH 39 OR 1230 3702 ALASKA 663 ID 880 WI MA SD 2679 105 786 454 971 MI CT CT DE WY 215 710 1720 RI 1216 334 169 399 254 183 2653 IA 1644 946 252 213 PA 2190 N NE 684 OH J DE DC MD 522 629 IL IN 2876 265 1863 NV 1809 WV MD 591 2552 755 UT 401 3367 1890 VA CO 1221 281 DC MA NH 703 580 2442 3416 2082 229 1794 267 466 KS MO 1036 4295 1365 267 CA 2403 1207 1511 KY 1030 2575 NJ RI 6758 975 1149 1485 NC 3975 1987 277 7803 TN 2016 1435 419 OK SC AR AZ NM 966 1893 VT 572 1758 146 2206 632 1008 GA 494 MS AL 140 2056 851 3702 HAWAII 552 1109 151 1247 3386 LA 510 112 TX 5663 1165 7861 920 FL 5269 5636 Inbound – More than 55% of total shipments moving into the state (subtotal on bottom). STATE Outbound Outbound – More than 55% of total shipments moving out of the state (subtotal on top). Inbound Balanced – Inbound and outbound individually represent 55% or less of total shipments.
- 2. 2011 Migration Patterns UNITED STATES ALABAMA ARKANSAS CONNECTICUT GEORGIA ILLINOIS Year Inbound Outbound Year Inbound Outbound Year Inbound Outbound Year Inbound Outbound Year Inbound Outbound 2011 1,247 1,109 2011 494 572 2011 946 1,216 2011 3,386 3,702 2011 2,442 3,367 2010 1,064 1,126 2010 481 477 2010 1,009 1,160 2010 2,855 3,036 2010 2,252 3,006 2009 1,100 939 2009 513 437 2009 801 1,230 2009 2,740 2,533 2009 2,140 2,623 2008 1,231 974 2008 605 586 2008 1,012 1,307 2008 3,213 3,128 2008 2,897 3,241 2007 1,291 1,008 2007 706 641 2007 1,353 1,391 2007 3,710 3,178 2007 3,273 3,600 2006 1,289 1,004 2006 744 631 2006 1,270 1,541 2006 4,289 3,405 2006 3,582 3,694 2005 1,336 1,101 2005 762 686 2005 1,342 1,583 2005 4,302 3,530 2005 3,888 4,176 2004 1,414 1,014 2004 714 610 2004 1,343 1,742 2004 4,290 3,492 2004 3,644 4,350 2003 1,160 933 2003 646 503 2003 1,264 1,549 2003 3,753 3,522 2003 3,373 3,939 2002 1,165 856 2002 610 526 2002 1,368 1,491 2002 3,652 3,689 2002 3,422 3,895 ALASKA CALIFORNIA DELAWARE HAWAII INDIANA Year Inbound Outbound Year Inbound Outbound Year Inbound Outbound Year Inbound Outbound Year Inbound Outbound 2011 169 105 2011 7,803 6,758 2011 252 334 2011 112 151 2011 1,221 1,809 2010 182 94 2010 7,160 6,529 2010 230 306 2010 75 95 2010 1,165 1,537 2009 170 126 2009 6,526 6,188 2009 221 316 2009 98 82 2009 1,086 1,465 2008 183 123 2008 7,705 6,834 2008 296 385 2008 169 176 2008 1,302 1,886 2007 218 143 2007 8,530 8,064 2007 338 400 2007 170 274 2007 1,329 1,980 2006 192 138 2006 8,485 9,407 2006 302 277 2006 294 252 2006 1,594 2,100 2005 171 121 2005 8,599 10,287 2005 353 326 2005 258 296 2005 1,712 2,283 2004 159 107 2004 8,542 9,762 2004 377 393 2004 265 270 2004 1,721 2,220 2003 198 75 2003 7,922 8,959 2003 363 365 2003 308 273 2003 1,522 2,172 2002 231 115 2002 8,288 8,606 2002 292 304 2002 356 249 2002 1,528 2,182 ARIZONA COLORADO FLORIDA IDAHO IOWA Year Inbound Outbound Year Inbound Outbound Year Inbound Outbound Year Inbound Outbound Year Inbound Outbound 2011 2,056 2,206 2011 2,403 2,082 2011 5,636 5,269 2011 399 454 2011 629 684 2010 1,798 1,942 2010 2,285 2,142 2010 5,083 5,360 2010 347 373 2010 562 562 2009 2,101 2,072 2009 2,271 1,908 2009 4,847 5,419 2009 346 432 2009 562 622 2008 2,371 2,413 2008 2,552 2,063 2008 5,277 6,367 2008 364 470 2008 650 710 2007 2,811 2,582 2007 2,697 2,049 2007 5,842 7,033 2007 499 510 2007 707 664 2006 3,091 2,864 2006 2,961 2,210 2006 6,716 7,994 2006 682 539 2006 681 796 2005 3,570 3,058 2005 2,953 2,120 2005 8,579 8,256 2005 790 467 2005 697 678 2004 3,616 2,771 2004 2,753 1,940 2004 9,069 7,180 2004 634 410 2004 636 771 2003 3,044 2,395 2003 2,483 2,167 2003 8,081 6,036 2003 520 438 2003 561 670 2002 2,803 2,435 2002 2,565 2,002 2002 7,176 5,859 2002 Inbound –487 than 55% of 525shipments moving into the 589 (subtotal on bottom). More total 2002 state 776 Inbound – More than 55% of total shipments moving into the state (subtotal on bottom). Outbound – More than 55% of total shipments moving out of the state (subtotal on top). Inbound – More than 55% of total shipments moving into the state (subtotal on Outbound – More than 55% of total shipments moving out of the state (subtotal on Balanced – Inbound and outbound individually represent 55% or less of total shipments. bottom). top). Outbound – More than 55% of total shipments moving out of the state (subtotalBalanced – Inbound and outbound individually represent 55% or less of total shipments. on top).
- 3. 2011 Migration Patterns KANSAS MAINE MICHIGAN MISSOURI NEVADA Year Inbound Outbound Year Inbound Outbound Year Inbound Outbound Year Inbound Outbound Year Inbound Outbound 2011 975 1,207 2011 355 333 2011 1,644 1,720 2011 1,149 1,511 2011 703 755 2010 926 943 2010 333 353 2010 1,405 1,819 2010 1,006 1,381 2010 715 682 2009 949 1,062 2009 352 417 2009 1,205 1,818 2009 1,072 1,316 2009 669 671 2008 930 951 2008 421 428 2008 1,619 2,392 2008 1,201 1,604 2008 849 657 2007 993 877 2007 446 515 2007 1,899 2,712 2007 1,335 1,488 2007 1,038 727 2006 1,034 872 2006 511 523 2006 2,086 2,729 2006 1,415 1,598 2006 1,229 1,059 2005 1,002 907 2005 516 646 2005 2,187 2,823 2005 1,489 1,639 2005 1,309 1,160 2004 957 875 2004 529 685 2004 2,189 2,619 2004 1,502 1,483 2004 1,424 991 2003 967 894 2003 513 609 2003 2,135 2,295 2003 1,543 1,635 2003 1,372 879 2002 1,036 924 2002 538 530 2002 2,062 2,388 2002 1,599 1,528 2002 1,117 781 KENTUCKY MARYLAND MINNESOTA MONTANA NEW HAMPSHIRE Year Inbound Outbound Year Inbound Outbound Year Inbound Outbound Year Inbound Outbound Year Inbound Outbound 2011 1,030 1,036 2011 2,552 1,863 2011 880 1,230 2011 204 217 2011 267 267 2010 1,189 843 2010 2,628 1,761 2010 780 982 2010 212 196 2010 257 199 2009 1,069 910 2009 2,214 1,599 2009 814 957 2009 220 220 2009 278 211 2008 973 833 2008 2,332 1,914 2008 1,158 1,355 2008 287 231 2008 288 276 2007 1,188 1,031 2007 2,411 2,050 2007 1,225 1,373 2007 310 303 2007 380 301 2006 1,118 907 2006 2,581 2,238 2006 1,287 1,607 2006 344 356 2006 424 368 2005 1,138 950 2005 2,876 2,464 2005 1,362 1,846 2005 392 294 2005 474 318 2004 1,097 1,031 2004 2,884 2,188 2004 1,416 1,896 2004 380 277 2004 457 385 2003 1,111 875 2003 2,545 2,079 2003 1,357 1,786 2003 314 257 2003 415 351 2002 1,045 861 2002 2,663 1,876 2002 1,359 1,856 2002 337 272 2002 475 289 LOUISIANA MASSACHUSETTS MISSISSIPPI NEBRASKA NEW JERSEY Year Inbound Outbound Year Inbound Outbound Year Inbound Outbound Year Inbound Outbound Year Inbound Outbound 2011 920 1,165 2011 1,365 1,794 2011 510 552 2011 401 522 2011 1,435 1,987 2010 940 989 2010 1,445 1,671 2010 511 648 2010 419 452 2010 1,621 2,215 2009 972 948 2009 1,395 1,498 2009 495 632 2009 399 486 2009 1,480 2,356 2008 1,023 899 2008 1,726 1,854 2008 569 780 2008 454 554 2008 1,834 2,661 2007 1,146 1,341 2007 1,892 2,036 2007 727 818 2007 544 543 2007 2,113 3,022 2006 999 1,966 2006 1,812 2,291 2006 714 1,078 2006 583 540 2006 2,198 3,145 2005 1,058 1,792 2005 1,948 2,718 2005 719 1,031 2005 597 571 2005 2,418 3,395 2004 1,250 1,723 2004 1,815 2,966 2004 703 786 2004 634 534 2004 2,268 3,541 2003 1,150 1,671 2003 1,684 2,670 2003 704 764 2003 Inbound –556 than 55% of 472shipments moving into the state (subtotal on3,137 More total 2003 2,194 bottom). 2002 1,149 1,583 2002 1,789 2,673 2002 609 785 2002 439 585 2002 2,291 2,859 Inbound – More than 55% of total shipments moving into the state (subtotal on bottom). Outbound – More than 55% of total shipments moving out of the state (subtotal on top). Inbound – More than 55% of total shipments moving into the state (subtotal on Outbound – More than 55% of total shipments moving out of the state (subtotal on Balanced – Inbound and outbound individually represent 55% or less of total shipments. bottom). top). Outbound – More than 55% of total shipments moving out of the state (subtotalBalanced – Inbound and outbound individually represent 55% or less of total shipments. on top).
- 4. 2011 Migration Patterns NEW MEXICO NORTH DAKOTA OREGON SOUTH CAROLINA TEXAS Year Inbound Outbound Year Inbound Outbound Year Inbound Outbound Year Inbound Outbound Year Inbound Outbound 2011 851 632 2011 210 164 2011 786 663 2011 1,758 1,893 2011 7,861 5,663 2010 871 706 2010 208 170 2010 658 592 2010 1,592 1,642 2010 7,248 5,322 2009 940 688 2009 218 290 2009 721 598 2009 1,368 1,337 2009 6,833 4,773 2008 923 750 2008 207 253 2008 987 682 2008 1,825 1,538 2008 8,629 6,442 2007 986 757 2007 193 143 2007 1,026 818 2007 2,023 1,757 2007 8,831 6,665 2006 1,164 833 2006 169 120 2006 1,239 721 2006 2,087 1,710 2006 9,714 6,812 2005 1,210 760 2005 166 133 2005 1,421 799 2005 2,092 1,856 2005 9,525 7,210 2004 1,172 636 2004 188 142 2004 1,298 994 2004 1,909 1,780 2004 8,644 7,442 2003 1,022 736 2003 201 106 2003 1,118 967 2003 1,637 1,526 2003 8,075 6,920 2002 876 777 2002 148 166 2002 1,198 937 2002 1,414 1,385 2002 7,723 6,778 NEW YORK OHIO PENNSYLVANIA SOUTH DAKOTA UTAH Year Inbound Outbound Year Inbound Outbound Year Inbound Outbound Year Inbound Outbound Year Inbound Outbound 2011 2,679 3,702 2011 1,890 2,876 2011 2,190 2,653 2011 183 215 2011 466 580 2010 2,688 3,481 2010 1,819 2,682 2010 2,192 2,496 2010 179 206 2010 428 448 2009 2,432 3,404 2009 1,824 2,492 2009 1,937 2,210 2009 186 295 2009 478 503 2008 3,043 4,220 2008 2,131 3,339 2008 2,328 2,800 2008 220 238 2008 512 552 2007 3,313 4,953 2007 2,345 3,841 2007 2,652 2,866 2007 185 214 2007 596 630 2006 3,297 5,026 2006 2,677 3,755 2006 2,890 3,103 2006 205 244 2006 733 658 2005 3,636 5,574 2005 3,116 4,052 2005 3,146 3,152 2005 215 226 2005 836 756 2004 3,659 5,634 2004 3,337 4,203 2004 2,943 3,412 2004 215 210 2004 670 759 2003 3,396 4,859 2003 2,933 3,686 2003 2,939 3,095 2003 204 308 2003 548 663 2002 3,583 4,981 2002 3,113 3,362 2002 2,909 2,933 2002 217 309 2002 544 745 NORTH CAROLINA OKLAHOMA RHODE ISLAND TENNESSEE VERMONT Year Inbound Outbound Year Inbound Outbound Year Inbound Outbound Year Inbound Outbound Year Inbound Outbound 2011 3,975 2,575 2011 1,008 966 2011 419 277 2011 2,016 1,485 2011 140 146 2010 3,501 2,411 2010 833 793 2010 259 254 2010 1,588 1,282 2010 113 114 2009 2,956 2,280 2009 877 652 2009 231 246 2009 1,600 1,499 2009 144 97 2008 3,923 3,045 2008 961 869 2008 252 291 2008 1,963 1,519 2008 154 165 2007 4,374 3,056 2007 937 957 2007 315 300 2007 2,289 2,047 2007 174 150 2006 4,851 3,220 2006 1,020 1,061 2006 334 340 2006 2,670 1,970 2006 198 186 2005 4,656 3,505 2005 943 1,030 2005 294 305 2005 2,481 1,999 2005 218 161 2004 4,309 3,369 2004 951 983 2004 342 318 2004 2,099 2,155 2004 228 174 2003 3,858 3,098 2003 821 1,088 2003 398 290 2003 Inbound – More than 55% of total shipments moving into the 276 (subtotal on bottom). 1,908 1,988 2003 state 183 2002 3,648 2,935 2002 820 1,053 2002 339 178 2002 2,006 2,092 2002 243 183 Inbound – More than 55% of total shipments moving into the state (subtotal on bottom). Outbound – More than 55% of total shipments moving out of the state (subtotal on top). Inbound – More than 55% of total shipments moving into the state (subtotal on Outbound – More than 55% of total shipments moving out of the state (subtotal on Balanced – Inbound and outbound individually represent 55% or less of total shipments. bottom). top). Outbound – More than 55% of total shipments moving out of the state (subtotalBalanced – Inbound and outbound individually represent 55% or less of total shipments. on top).
- 5. 2011 Migration Patterns VIRGINIA WASHINGTON, D.C. WISCONSIN Year Inbound Outbound Year Inbound Outbound Year Inbound Outbound 2011 4,295 3,416 2011 591 265 2011 710 971 2010 4,160 3,404 2010 583 265 2010 733 796 2009 4,133 2,894 2009 633 257 2009 688 806 2008 4,210 2,968 2008 667 283 2008 933 1,100 2007 4,284 3,682 2007 701 336 2007 1,028 1,257 2006 4,455 3,998 2006 640 341 2006 1,201 1,199 2005 4,645 4,264 2005 738 347 2005 1,265 1,341 2004 5,075 4,096 2004 386 167 2004 1,083 1,445 2003 4,374 3,774 2003 326 141 2003 1,126 1,335 2002 4,135 3,368 2002 628 274 2002 1,090 1,353 WASHINGTON WEST VIRGINIA WYOMING Year Inbound Outbound Year Inbound Outbound Year Inbound Outbound 2011 2,752 2,604 2011 229 281 2011 213 254 2010 2,159 2,412 2010 209 209 2010 182 245 2009 2,245 2,234 2009 245 289 2009 203 215 2008 2,913 2,272 2008 241 272 2008 251 292 2007 3,208 2,487 2007 296 335 2007 214 236 2006 3,366 3,170 2006 348 283 2006 271 269 2005 3,583 3,107 2005 362 381 2005 283 263 2004 3,087 2,915 2004 296 371 2004 257 245 2003 2,845 2,605 2003 302 346 2003 249 251 2002 2,682 2,754 2002 324 326 2002 226 215 Inbound – More than 55% of total shipments moving into the state (subtotal on bottom). Inbound – More than 55% of total shipments moving into the state (subtotal on bottom). Outbound – More than 55% of total shipments moving out of the state (subtotal on top). Inbound – More than 55% of total shipments moving into the state (subtotal on Outbound – More than 55% of total shipments moving out of the state (subtotal on Balanced – Inbound and outbound individually represent 55% or less of total shipments. bottom). top). Outbound – More than 55% of total shipments moving out of the state (subtotalBalanced – Inbound and outbound individually represent 55% or less of total shipments. on top).
- 6. 2011 Migration Patterns CANADA ALBERTA BRITISH COLUMBIA MANITOBA NEW BRUNSWICK NEWFOUNDLAND Year Inbound Outbound Year Inbound Outbound Year Inbound Outbound Year Inbound Outbound Year Inbound Outbound 2011 231 304 2011 182 285 2011 37 67 2011 14 14 2011 17 15 2010 221 310 2010 163 258 2010 35 34 2010 12 11 2010 23 13 2009 221 293 2009 209 227 2009 17 39 2009 17 14 2009 21 12 2008 236 423 2008 206 306 2008 42 67 2008 15 11 2008 24 13 2007 234 400 2007 228 326 2007 34 71 2007 25 26 2007 22 13 2006 251 279 2006 285 334 2006 36 85 2006 13 17 2006 31 22 2005 236 319 2005 307 337 2005 31 88 2005 21 28 2005 21 25 2004 150 290 2004 285 330 2004 32 68 2004 23 13 2004 329 181 2003 210 241 2003 306 320 2003 47 79 2003 20 9 2003 397 214 2002 222 286 2002 248 343 2002 40 54 2002 26 20 2002 49 44 NOVA SCOTIA ONTARIO QUEBEC SASKATCHEWAN YUKON Year Inbound Outbound Year Inbound Outbound Year Inbound Outbound Year Inbound Outbound Year Inbound Outbound 2011 39 73 2011 602 878 2011 182 248 2011 19 31 2011 0 0 2010 42 51 2010 591 782 2010 193 170 2010 21 28 2010 1 0 2009 45 64 2009 705 882 2009 147 240 2009 17 19 2009 0 0 2008 54 77 2008 718 1,123 2008 186 289 2008 22 23 2008 0 0 2007 58 109 2007 698 1,316 2007 227 294 2007 22 47 2007 0 0 2006 70 83 2006 773 1,360 2006 179 278 2006 21 46 2006 0 1 2005 51 77 2005 743 1,324 2005 184 299 2005 20 38 2005 0 2 2004 64 55 2004 798 1,140 2004 251 210 2004 22 36 2004 0 1 2003 61 53 2003 892 1,009 2003 235 200 2003 44 32 2003 1 0 2002 68 36 2002 880 1,131 2002 243 240 2002 17 34 2002 1 1 Inbound – More than 55% of total shipments moving into the state (subtotal on bottom). Inbound – More than 55% of total shipments moving into the state (subtotal on bottom). Inbound – More than 55% of total shipments moving into the state (subtotal on bottom). Outbound – More than 55% of total shipments moving out of the state (subtotal on top). Outbound – More than 55% of total shipments moving out of the state (subtotal on top). Outbound – More than 55% of total shipments moving out of the state (subtotal on top). 1-800-847-6683 Balanced – Inbound and outbound individually represent 55% or less of total shipments. Balanced – Inbound and outbound individually represent 55% or less of total shipments. www.atlasvanlines.com/migration-patterns Balanced – Inbound and outbound individually represent 55% or less of total shipments. TM & © 2012 AWGI LLC Atlas Van Lines, Inc. U.S. DOT No. 125550