SlideShare une entreprise Scribd logo
1  sur  20
Télécharger pour lire hors ligne
POPULATION REFERENCE BUREAU
I N F O R M | E M P O W E R | A DVA N C E | w w w. p r b .o r g
7.2BILLION
Worldwide population in 2014;
6 billion in less developed
countries and 1.2 billion in
more developed countries.
2.5The total fertility rate worldwide.
TFRs range from 1.1 children per
woman in Taiwan to 7.6 in Niger.
38Since 1970, the global infant
mortality rate declined from
80 infant deaths per 1,000 live
births to 38 per 1,000 live births.
53%The percentage of the world’s
population living in urban areas.
WORLD
POPULATION
DATA SHEET
2014
© 2014 Population Reference Bureau See notes on page 18 2014 WORLD POPULATION DATA SHEET 2
MOST POPULOUS COUNTRIES, 2014 AND 2050
2014 2050
COUNTRIES WITH THE HIGHEST AND LOWEST TOTAL FERTILITY RATES
COUNTRY POPULATION (MILLIONS)
India 1,657
China 1,312
Nigeria 396
United States 395
Indonesia 365
Pakistan 348
Brazil 226
Bangladesh 202
Congo, Dem. Rep. 194
Ethiopia 165
COUNTRY POPULATION (MILLIONS)
China 1,364
India 1,296
United States 318
Indonesia 251
Brazil 203
Pakistan 194
Nigeria 177
Bangladesh 158
Russia 144
Japan 127
HIGHEST IN 2013
TFR
2013 1970
Niger 7.6 7.4
South Sudan 7.0 6.9
Somalia 6.6 7.2
Chad 6.6 6.5
Congo, Dem. Rep. 6.6 6.2
Central African Republic 6.2 6.0
Angola 6.2 7.3
Mali 6.1 6.9
Burundi 6.1 7.3
Zambia 6.0 7.4
LOWEST IN 2013
TFR
2013 1970
Taiwan 1.1 3.9
Portugal 1.2 3.0
Singapore 1.2 3.2
Korea, South 1.2 4.5
Moldova 1.2 2.6
Poland 1.2 2.3
Bosnia-Herzegovina 1.3 2.7
Spain 1.3 2.9
Greece 1.3 2.4
Hungary 1.3 2.0
Slovakia 1.3 2.4
Romania 1.3 2.9
NOTE: 2013 data refer to latest data available.
© 2014 Population Reference Bureau See notes on page 18 2014 WORLD POPULATION DATA SHEET 3
POPULATION CLOCK, 2014
WORLD
MORE DEVELOPED
COUNTRIES
LESS DEVELOPED
COUNTRIES
Population 7,238,184,000 1,248,958,000 5,989,225,000
Births per
Year 143,341,000 13,794,000 129,547,000
Day 392,714 37,792 354,923
Minute 273 26 246
Deaths per
Year 56,759,000 12,328,000 44,432,000
Day 155,505 33,775 121,730
Minute 108 23 85
Natural increase per
Year 86,581,000 1,466,000 85,115,000
Day 237,209 4,017 233,193
Minute 165 3 162
Infant deaths per
Year 5,507,000 72,000 5,435,000
Day 15,087 197 14,890
Minute 10 0.1 10
© 2014 Population Reference Bureau See notes on page 18 2014 WORLD POPULATION DATA SHEET 4
W O R L D P O P U L A T I O N H I G H L I G H T S
F O C U S O N P R O G R E S S A N D C H A L L E N G E S
Extreme Poverty Rate Falls
in Many Countries.
MDG 1: ERADICATE EXTREME POVERTY AND HUNGER
In 2010, five years ahead of the target date of 2015, the world reached the
United Nations Millennium Development Goal 1: cutting in half the proportion
of people living in extreme poverty. While this global progress is outstanding,
progress in particular countries and regions is not as strong. Globally,
1.2 billion people still live on less than $1.25 a day, and disproportionately
large numbers of them live in southern Asia and sub-Saharan Africa. While
the rate of extreme poverty fell significantly in China and India, their large
populations (more than 2.5 billion combined) mean that they are two of the
top five countries that have the largest share of the global extreme poor.
SOURCE: World Bank, “Poverty Headcount Ratio at $1.25 a Day (PPP),”
accessed at http://data.worldbank.org/indicator/SI.POV.DDAY.
Child Mortality Rates Decline
Steadily Across Much of the World.
MDG 4: REDUCE CHILD MORTALITY
The child mortality rate is the number of deaths of children under 5 per 1,000
live births. The United Nations set a target for Millennium Development Goal
4: to reduce by two-thirds, between 1990 and 2015, the under-5 mortality
rate. Across the globe, many countries have made significant progress in
reducing child mortality. For example, child mortality in Bangladesh declined
from 144 child deaths per 1,000 live births to 41, a reduction of 72 percent.
The global rate in 2012 was almost one-half its 1990 rate, declining from
90 deaths per 1,000 live births to 48 in 2012. Despite these gains, many
countries will fall short of the MDG target, and further progress is needed
across much of sub-Saharan Africa and South Asia.
SOURCE: UN Inter-agency Group for Child Mortality Estimation,
“Under-Five Mortality Estimates: Rates” (September 2013),
accessed at www.childmortality.org.
1988-1992
2008-2012
47
22
World
62
12
China
37
20
Honduras
54
33
India
54
19
Indonesia
66
30
Senegal
69
38
Uganda
Percent of Population Living on Less Than $1.25/Day
Congo, Dem. Rep. (15%)
Somalia (17%)
Angola (23%)
Vietnam (54%)
Algeria (60%)
Uganda (61%)
Tanzania (68%)
Bangladesh (72%)
China (74%)
Egypt (75%)
Peru (77%)
Kenya (26%)
Papua New Guinea (29%)
Burkina Faso (49%)
Yemen (52%)
66% or
Greater
Reduction
33% – 65%
Reduction
Less Than
33% Reduction
18
14
41
54
69
20
23
60
102
63
73
164
147
146
21
79
54
144
50
51
171
177
213
98
89
202
125
178
166
86
Deaths of Children Under 5 per 1,000 Live Births
(2012 data appear inside bars; 1990 data are italicized)
© 2014 Population Reference Bureau See notes on page 18 2014 WORLD POPULATION DATA SHEET 5
1970 Male Female 2014 Male Female
Age Structure Has Changed Differently Across
Regions Between 1970 and 2014.
In 1970, just under one-half (48 percent) of the world’s population was younger than 20, a nearly equal percentage
was ages 20 to 64, and only 5 percent was 65 and older. Today, as a result of lower fertility rates and longer life
expectancy, the share of global population under age 20 has dropped to about 35 percent, the population between
ages 20 and 64 represent 58 percent, and ages 65 and older represent 7 percent. Asia, Latin America, and Oceania
all have population age structures similar to the global averages. In 1970, Europe and North America were similar
to the world average today, and their slower growth resulted in a current population much older than the global
average. Africa’s population is at the other end of the age spectrum—Africa’s current youthful age structure is much
like the global average in 1970.
SOURCE: United Nations Population Division, World Population Prospects: The 2012 Revision (New York: United Nations, 2013).
W O R L D P O P U L A T I O N H I G H L I G H T S
F O C U S O N P R O G R E S S A N D C H A L L E N G E S
10% 8% 6% 4% 2% 0% 2% 4% 6% 8% 10%
0-4
5-9
10-14
15-19
20-24
25-29
30-34
35-39
40-44
45-49
50-54
55-59
60-64
65-69
70-74
75-79
80+
Percent of Population
Latin America  Caribbean
10% 8% 6% 4% 2% 0% 2% 4% 6% 8% 10%
0-4
5-9
10-14
15-19
20-24
25-29
30-34
35-39
40-44
45-49
50-54
55-59
60-64
65-69
70-74
75-79
80+
Percent of Population
Africa
10% 8% 6% 4% 2% 0% 2% 4% 6% 8% 10%
0-4
5-9
10-14
15-19
20-24
25-29
30-34
35-39
40-44
45-49
50-54
55-59
60-64
65-69
70-74
75-79
80+
Percent of Population
North America
10% 8% 6% 4% 2% 0% 2% 4% 6% 8% 10%
0-4
5-9
10-14
15-19
20-24
25-29
30-34
35-39
40-44
45-49
50-54
55-59
60-64
65-69
70-74
75-79
80+
Percent of Population
Asia
10% 8% 6% 4% 2% 0% 2% 4% 6% 8% 10%
0-4
5-9
10-14
15-19
20-24
25-29
30-34
35-39
40-44
45-49
50-54
55-59
60-64
65-69
70-74
75-79
80+
Percent of Population
Oceania
10% 8% 6% 4% 2% 0% 2% 4% 6% 8% 10%
0-4
5-9
10-14
15-19
20-24
25-29
30-34
35-39
40-44
45-49
50-54
55-59
60-64
65-69
70-74
75-79
80+
Percent of Population
Europe
10% 8% 6% 4% 2% 0% 2% 4% 6% 8% 10%
0-4
5-9
10-14
15-19
20-24
25-29
30-34
35-39
40-44
45-49
50-54
55-59
60-64
65-69
70-74
75-79
80+
Percent of Population
World
© 2014 Population Reference Bureau See notes on page 18 2014 WORLD POPULATION DATA SHEET 6
Countries Vary in Progress Toward
Reducing Still-High Maternal Mortality.
MDG 5: IMPROVE MATERNAL HEALTH
The maternal mortality ratio is the number of maternal deaths per 100,000 live births.
Globally, this ratio dropped from 380 deaths to 210 deaths per 100,000 live births
between 1990 and 2013. Some countries have made remarkable progress. For example,
maternal mortality in Rwanda declined from 1,400 maternal deaths per 100,000 live
births to 320, a reduction of 77 percent. Even with these drops, many countries have
not yet met the United Nations target for Millennium Development Goal 5: to reduce by
three-quarters, between 1990 and 2015, the maternal mortality ratio. While the ratio has
declined rapidly in some countries, many others have made insufficient progress. The
ratio for all developing countries is 14 times higher than for developed countries—230
maternal deaths per 100,000 live births vs. 16, and further efforts are needed to end
these preventable maternal deaths.
SOURCE: World Health Organization, Trends in Maternal Mortality: 1990 to 2013
(Geneva: WHO, 2014).
As Life Expectancy Rises in the
United States, Gaps Between
Whites and Blacks Are Decreasing.
Since 1975, life expectancy at birth in the United States has increased by 10 years for black
males, by 7 years for white males and black females, and by only 4 years for white females.
In addition, the gap in life expectancy between white and black females decreased from 6
years to 3 years between 1975 and 2011; while the gap between white and black males
decreased from 7 years to 4 years across this period. However, these remaining gaps
between whites and blacks are one factor contributing to lower life expectancy at birth in
the United States compared with other developed countries. Japan, Switzerland, Sweden,
Norway, and France have life expectancies of 82 years or higher, compared with only
79 years in the United States. And, at 81 years, life expectancy at birth for women in the
United States is considerably lower than it is for women in many other developed countries,
where it has reached 84 years or higher. Hispanic females in the United States have a
higher life expectancy at birth than whites or blacks of either gender.
SOURCE: National Center For Health Statistics, “Deaths: Final Data for 2011,”
National Vital Statistics Report 63, no. 3 (2014).
W O R L D P O P U L A T I O N H I G H L I G H T S
F O C U S O N P R O G R E S S A N D C H A L L E N G E S
Côte d’Ivoire (3%)
South Africa (9%)
Kenya (17%)
India (66%)
Afghanistan (67%)
Ethiopia (70%)
Nepal (76%)
Rwanda (77%)
Eritrea (78%)
Laos (80%)
Cambodia (86%)
Cameroon (18%)
Congo, Dem. Rep. (27%)
Peru (64%)
Nigeria (53%)
75% or Greater
Reduction
33%–74%
Reduction
Less Than
33% Reduction
170 1,200
220 1,100
320 1,400
190 790
420
400
190 560
25089
560
730
590
400
140
720 740
150
490
720
1,000
1,200
1,200
1,400
380 1,700
Maternal Deaths per 100,000 Live Births
(2013 data appear inside bars; 1990 data are italicized)
86
84
82
80
78
76
74
72
70
68
66
64
62
60
1975 1979 1983 1987 1991 1995 1999 2003 2007 2011
83.7
77.3
71.3
69.5
62.4
White Females
Black Females
White Males
Black Males
Hispanic Females
81.3
78.8
78.2
Hispanic Males
76.6
72.2
Life Expectancy at Birth (years)
© 2014 Population Reference Bureau See notes on page 18 2014 WORLD POPULATION DATA SHEET 7
POPULATION, HEALTH, AND ENVIRONMENT DATA AND ESTIMATES FOR THE
Population
mid-2014
(millions)
Births
per 1,000
Population
Deaths
per 1,000
Population
Rate of
Natural
Increase
(%)
Net
Migration
Rate
per 1,000
Population
Projected
Population (millions)
2050
Population
as a
Multiple of
2014
Infant
Mortality Ratea
Total
Fertility Rateb Percent of Population
mid-2030 mid-2050 1970 2013* 1970 2013* Ages 15 Ages 65+
Both Sex
1970
WORLD 7,238 20 8 1.2 — 8,444 9,683 1.3 89 38 4.7 2.5 26 8 58
MORE DEVELOPED 1,249 11 10 0.1 2 1,292 1,309 1.0 24 5 2.3 1.6 16 17 71
LESS DEVELOPED 5,989 22 7 1.4 0 7,152 8,375 1.4 100 42 5.7 2.6 29 6 55
LESS DEVELOPED (EXCL. CHINA) 4,625 24 7 1.7 -1 5,752 7,063 1.5 119 46 5.8 3.0 32 5 51
LEAST DEVELOPED 916 33 9 2.4 -1 1,290 1,855 2.0 150 64 5.7 4.3 40 4 44
AFRICA 1,136 36 10 2.5 0 1,637 2,428 2.1 139 62 6.7 4.7 41 4 45
SUB-SAHARAN AFRICA 920 37 11 2.6 0 1,360 2,081 2.3 138 67 6.7 5.1 43 3 44
NORTHERN AFRICA 217 28 7 2.2 -2 277 347 1.6 140 33 6.5 3.4 32 5 52
Algeria 39.1 25 6 1.9 -1 49.9 60.3 1.5 128 26 7.6 2.9 28 6 50
Egypt 87.9 32 6 2.6 -1 113.2 146.0 1.7 169 29 5.9 3.5 32 6 52
Libya 6.3 21 4 1.7 -7 7.5 8.4 1.3 104 14 7.9 2.4 29 5 56
Morocco 33.3 22 6 1.5 -3 38.2 41.4 1.2 118 29 6.7 2.6 28 5 53
Sudan 38.8 34 8 2.5 -4 55.1 77.1 2.0 97 55 6.9 5.2 41 3 52
Tunisia 11.0 19 6 1.3 -3 12.4 13.1 1.2 158 16 6.4 2.2 24 7 51
Western Saharae 0.6 21 6 1.5 17 0.8 0.8 1.4 168 37 6.6 2.4 27 3 42
WESTERN AFRICA 339 39 12 2.7 -1 507 784 2.3 152 66 6.7 5.4 44 3 41
Benin 10.3 37 10 2.7 -0 15.0 21.5 2.1 155 69 6.8 4.9 43 3 42
Burkina Faso 17.9 43 11 3.1 -2 28.4 46.6 2.6 163 70 6.6 5.9 46 2 39
Cape Verde 0.5 22 5 1.7 -7 0.6 0.7 1.5 109 24 6.9 2.6 30 5 52
Côte d'Ivoire 20.8 37 14 2.3 1 29.2 42.3 2.0 156 75 7.9 4.9 41 3 44
Gambia 1.9 41 10 3.1 -2 3.1 4.9 2.5 120 55 6.1 5.6 46 2 38
Ghana 27.0 34 9 2.5 -1 37.7 52.6 1.9 110 53 7.0 4.3 38 5 49
Guinea 11.6 38 12 2.7 -0 16.9 23.9 2.1 190 67 6.2 5.1 42 3 37
Guinea-Bissau 1.7 38 13 2.5 -1 2.5 3.5 2.0 144 94 6.1 5.0 41 3 44
Liberia 4.4 35 9 2.6 -1 6.4 9.4 2.1 186 54 6.7 4.7 43 3 39
Mali 15.9 42 13 2.9 -2 26.3 45.6 2.9 184 58 6.9 6.1 48 3 32
Mauritania 4.0 34 9 2.6 -1 5.6 7.9 2.0 110 72 6.8 4.1 40 3 49
Niger 18.2 50 11 3.9 -0 33.8 68.0 3.7 154 54 7.4 7.6 50 3 36
Nigeria 177.5 39 13 2.5 -0 261.7 396.5 2.2 153 69 6.5 5.6 44 3 41
Senegal 13.9 40 8 3.2 -1 21.8 35.1 2.5 111 43 7.3 5.3 44 3 39
Sierra Leone 6.3 38 17 2.1 -1 8.2 10.5 1.7 197 92 6.7 4.9 42 3 35
Togo 7.0 37 11 2.6 -0 10.0 14.5 2.1 120 66 7.1 4.7 42 3 47
EASTERN AFRICA 378 36 9 2.7 0 561 851 2.3 134 57 7.1 4.9 44 3 45
Burundi 10.5 45 13 3.2 -0 16.4 26.7 2.5 139 87 7.3 6.1 45 2 44
Comoros 0.7 34 9 2.5 -3 1.0 1.3 1.8 134 36 7.1 4.3 42 3 48
Djibouti 0.9 28 9 1.9 -4 1.1 1.2 1.4 112 55 6.8 3.4 34 4 49
Eritrea 6.5 33 7 2.6 2 9.8 14.3 2.2 151 42 6.7 4.7 43 2 41
Ethiopia 95.9 28 8 2.1 -0 130.5 165.1 1.7 144 50 7.0 4.1 43 3 43
Kenya 43.2 34 9 2.6 -0 60.0 81.3 1.9 98 47 8.1 4.3 42 3 52
Madagascar 22.4 34 7 2.7 -0 34.3 52.8 2.4 139 42 7.3 4.4 42 3 45
Malawi 16.8 40 12 2.9 0 26.0 41.2 2.4 175 66 7.3 5.5 45 3 41
Mauritius 1.3 11 8 0.3 -0 1.3 1.2 1.0 66 12.1 3.8 1.4 21 8 63
Mayotte 0.2 31 3 2.8 -5 0.3 0.5 2.1 53 4 7.9 4.1 45 2 62
Mozambique 25.1 43 13 2.9 0 38.4 63.5 2.5 165 85 6.6 5.7 45 3 39
Reunion 0.9 17 5 1.2 -5 1.0 1.2 1.4 53 7 4.8 2.4 24 9 63
Rwanda 11.1 31 8 2.3 -1 15.8 21.0 1.9 136 49 8.2 4.0 41 3 44
Seychelles 0.1 19 7 1.1 2 0.1 0.1 1.1 54 11.4 5.8 2.4 22 8 66
Somalia 10.8 44 12 3.2 -3 16.9 27.1 2.5 154 80 7.2 6.6 48 3 41
South Sudan 11.7 36 12 2.4 16 17.3 39.3 3.3 187 78 6.9 7.0 42 3 36
per woman to 2.8.in 2050. contraception. P O P U
POPULATION, HEALTH, AND ENVIRONMENT DATA AND ESTIMATES FOR THE COUNTRIES AND REGIONS OF THE WORLD
© 2014 Population Reference Bureau See notes on page 18 2014 WORLD POPULATION DATA SHEET 8
Eritrea 6.5 33 7 2.6 2 9.8 14.3 2.2 151 42 6.7 4.7 43 2 41
Ethiopia 95.9 28 8 2.1 -0 130.5 165.1 1.7 144 50 7.0 4.1 43 3 43
Kenya 43.2 34 9 2.6 -0 60.0 81.3 1.9 98 47 8.1 4.3 42 3 52
Madagascar 22.4 34 7 2.7 -0 34.3 52.8 2.4 139 42 7.3 4.4 42 3 45
Malawi 16.8 40 12 2.9 0 26.0 41.2 2.4 175 66 7.3 5.5 45 3 41
Mauritius 1.3 11 8 0.3 -0 1.3 1.2 1.0 66 12.1 3.8 1.4 21 8 63
Mayotte 0.2 31 3 2.8 -5 0.3 0.5 2.1 53 4 7.9 4.1 45 2 62
Mozambique 25.1 43 13 2.9 0 38.4 63.5 2.5 165 85 6.6 5.7 45 3 39
Reunion 0.9 17 5 1.2 -5 1.0 1.2 1.4 53 7 4.8 2.4 24 9 63
Rwanda 11.1 31 8 2.3 -1 15.8 21.0 1.9 136 49 8.2 4.0 41 3 44
Seychelles 0.1 19 7 1.1 2 0.1 0.1 1.1 54 11.4 5.8 2.4 22 8 66
Somalia 10.8 44 12 3.2 -3 16.9 27.1 2.5 154 80 7.2 6.6 48 3 41
South Sudan 11.7 36 12 2.4 16 17.3 39.3 3.3 187 78 6.9 7.0 42 3 36
Tanzania 50.8 40 9 3.1 -1 79.4 129.4 2.5 124 49 6.8 5.3 45 3 47
Uganda 38.8 43 9 3.4 -1 63.4 104.1 2.7 113 57 7.1 5.9 48 2 49
Zambia 15.1 45 11 3.4 -1 26.1 49.2 3.3 112 66 7.4 6.0 47 3 49
Zimbabwe 14.7 33 9 2.4 6 21.5 30.2 2.1 86 37 7.4 3.8 40 3 55
MIDDLE AFRICA 142 45 15 3.0 -0 225 372 2.6 144 97 6.4 6.1 46 3 43
Angola 22.4 46 14 3.2 1 36.4 60.8 2.7 179 96 7.3 6.2 48 2 37
Cameroon 22.8 39 12 2.7 -1 34.5 54.3 2.4 127 62 6.2 5.1 43 3 46
Central African Republic 4.8 47 15 3.2 0 6.7 9.7 2.0 149 116 6.0 6.2 40 4 42
Chad 13.3 48 15 3.3 -2 21.8 37.4 2.8 153 96 6.5 6.6 49 2 41
Congo 4.6 38 10 2.8 -2 6.8 10.6 2.3 93 64 6.3 5.0 42 3 53
Congo, Dem. Rep. 71.2 46 16 3.0 -0 114.9 193.6 2.7 138 109 6.2 6.6 46 3 44
Equatorial Guinea 0.8 36 13 2.2 5 1.1 1.6 2.1 162 89 5.7 4.9 39 3 40
Gabon 1.7 32 9 2.3 1 2.4 3.3 1.9 124 43 5.1 4.1 38 5 47
Sao Tome and Principe 0.2 36 7 2.9 -2 0.3 0.4 2.2 82 44 6.5 4.3 42 4 56
SOUTHERN AFRICA 61 21 11 1.0 3 68 75 1.2 85 44 5.7 2.4 30 5 53
Botswana 2.0 24 17 0.7 2 2.3 2.8 1.4 97 32 6.6 2.6 34 4 55
Lesotho 1.9 30 21 0.9 -6 2.1 2.7 1.4 127 82 5.8 3.3 36 6 49
Namibia 2.3 30 7 2.2 -0 3.0 3.7 1.6 108 39 6.5 3.6 36 4 53
South Africa 53.7 20 11 1.0 3 58.7 64.1 1.2 80 42 5.6 2.3 29 5 53
Swaziland 1.3 30 14 1.6 -1 1.5 1.8 1.4 133 65 6.9 3.4 38 3 48
AMERICAS 972 16 7 0.9 0 1,106 1,217 1.3 68 15 4.0 2.1 24 10 65
NORTHERN AMERICA 353 12 8 0.4 3 396 444 1.3 21 5 2.3 1.8 19 14 71
Canada 35.5 11 7 0.4 8 41.5 48.4 1.4 19 4.8 2.2 1.6 16 15 72
United States 317.7 13 8 0.4 3 354.4 395.3 1.2 20 5.4 2.5 1.9 19 14 71
LATIN AMERICA AND THE CARIBBEAN 618 18 6 1.2 -1 710 773 1.3 86 18 5.3 2.2 27 7 60
CENTRAL AMERICA 165 21 6 1.5 -2 195 222 1.3 81 16 6.6 2.4 30 6 60
Belize 0.4 23 4 1.9 6 0.5 0.6 1.7 64 14 6.3 2.6 36 4 66
Costa Rica 4.8 15 4 1.1 2 5.6 6.1 1.3 61 8.7 4.9 1.8 24 7 67
El Salvador 6.4 20 7 1.4 -7 6.9 6.9 1.1 104 17 6.2 2.2 30 7 57
Guatemala 15.9 31 5 2.6 -1 22.6 31.3 2.0 109 23 6.2 3.8 40 5 52
Honduras 8.2 24 5 2.0 -1 10.2 11.7 1.4 112 24 7.3 2.8 35 4 53
Mexico 119.7 19 6 1.4 -2 137.5 150.8 1.3 75 13 6.7 2.2 28 6 61
Nicaragua 6.2 23 5 1.9 -6 7.5 8.4 1.4 105 17 6.9 2.5 33 5 54
Panama 3.9 20 5 1.5 2 4.8 5.6 1.4 53 14 5.2 2.5 28 7 66
CARIBBEAN 43 18 8 1.1 -4 47 49 1.1 77 33 4.7 2.3 26 9 62
Antigua and Barbuda 0.1 14 5 0.8 5 0.1 0.1 1.4 45 16 3.7 1.8 24 7 66
Bahamas 0.4 16 5 1.1 2 0.4 0.5 1.3 36 17 3.5 2.0 26 6 66
Barbados 0.3 12 8 0.4 1 0.3 0.3 1.1 46 10 3.1 1.8 20 13 65
Cuba 11.2 11 8 0.3 -4 10.7 9.3 0.8 45 4.6 4.0 1.7 17 13 70
Curacao 0.2 13 8 0.5 4 0.2 0.2 1.2 31 9.8 3.3 2.2 19 15 69
Dominica 0.1 13 8 0.5 -6 0.1 0.1 0.9 — 21 — 2.0 22 10 —
Dominican Republic 10.4 21 6 1.5 -3 12.0 13.2 1.3 102 25 6.2 2.5 31 6 58
Grenada 0.1 16 7 0.8 -2 0.1 0.1 0.9 49 9 4.6 2.0 27 7 64
Guadeloupe 0.4 13 7 0.6 -7 0.4 0.4 1.0 37 8.1 4.9 2.2 21 15 65
Haiti 10.8 28 9 1.9 -3 13.5 16.8 1.6 141 59 5.8 3.4 35 4 47
Jamaica 2.7 18 7 1.1 -5 2.9 2.7 1.0 48 21 5.5 2.3 27 8 68
POPULATION, HEALTH, AND ENVIRONMENT DATA AND ESTIMATES FOR THE
Population
mid-2014
(millions)
Births
per 1,000
Population
Deaths
per 1,000
Population
Rate of
Natural
Increase
(%)
Net
Migration
Rate
per 1,000
Population
Projected
Population (millions)
2050
Population
as a
Multiple of
2014
Infant
Mortality Ratea
Total
Fertility Rateb Percent of Population
mid-2030 mid-2050 1970 2013* 1970 2013* Ages 15 Ages 65+
Both Sex
1970
WORLD 7,238 20 8 1.2 — 8,444 9,683 1.3 89 38 4.7 2.5 26 8 58
MORE DEVELOPED 1,249 11 10 0.1 2 1,292 1,309 1.0 24 5 2.3 1.6 16 17 71
LESS DEVELOPED 5,989 22 7 1.4 0 7,152 8,375 1.4 100 42 5.7 2.6 29 6 55
LESS DEVELOPED (EXCL. CHINA) 4,625 24 7 1.7 -1 5,752 7,063 1.5 119 46 5.8 3.0 32 5 51
LEAST DEVELOPED 916 33 9 2.4 -1 1,290 1,855 2.0 150 64 5.7 4.3 40 4 44
AFRICA 1,136 36 10 2.5 0 1,637 2,428 2.1 139 62 6.7 4.7 41 4 45
SUB-SAHARAN AFRICA 920 37 11 2.6 0 1,360 2,081 2.3 138 67 6.7 5.1 43 3 44
NORTHERN AFRICA 217 28 7 2.2 -2 277 347 1.6 140 33 6.5 3.4 32 5 52
Algeria 39.1 25 6 1.9 -1 49.9 60.3 1.5 128 26 7.6 2.9 28 6 50
Egypt 87.9 32 6 2.6 -1 113.2 146.0 1.7 169 29 5.9 3.5 32 6 52
Libya 6.3 21 4 1.7 -7 7.5 8.4 1.3 104 14 7.9 2.4 29 5 56
Morocco 33.3 22 6 1.5 -3 38.2 41.4 1.2 118 29 6.7 2.6 28 5 53
Sudan 38.8 34 8 2.5 -4 55.1 77.1 2.0 97 55 6.9 5.2 41 3 52
Tunisia 11.0 19 6 1.3 -3 12.4 13.1 1.2 158 16 6.4 2.2 24 7 51
Western Saharae 0.6 21 6 1.5 17 0.8 0.8 1.4 168 37 6.6 2.4 27 3 42
WESTERN AFRICA 339 39 12 2.7 -1 507 784 2.3 152 66 6.7 5.4 44 3 41
Benin 10.3 37 10 2.7 -0 15.0 21.5 2.1 155 69 6.8 4.9 43 3 42
Burkina Faso 17.9 43 11 3.1 -2 28.4 46.6 2.6 163 70 6.6 5.9 46 2 39
Cape Verde 0.5 22 5 1.7 -7 0.6 0.7 1.5 109 24 6.9 2.6 30 5 52
Côte d'Ivoire 20.8 37 14 2.3 1 29.2 42.3 2.0 156 75 7.9 4.9 41 3 44
Gambia 1.9 41 10 3.1 -2 3.1 4.9 2.5 120 55 6.1 5.6 46 2 38
Ghana 27.0 34 9 2.5 -1 37.7 52.6 1.9 110 53 7.0 4.3 38 5 49
Guinea 11.6 38 12 2.7 -0 16.9 23.9 2.1 190 67 6.2 5.1 42 3 37
Guinea-Bissau 1.7 38 13 2.5 -1 2.5 3.5 2.0 144 94 6.1 5.0 41 3 44
Liberia 4.4 35 9 2.6 -1 6.4 9.4 2.1 186 54 6.7 4.7 43 3 39
Mali 15.9 42 13 2.9 -2 26.3 45.6 2.9 184 58 6.9 6.1 48 3 32
Mauritania 4.0 34 9 2.6 -1 5.6 7.9 2.0 110 72 6.8 4.1 40 3 49
Niger 18.2 50 11 3.9 -0 33.8 68.0 3.7 154 54 7.4 7.6 50 3 36
Nigeria 177.5 39 13 2.5 -0 261.7 396.5 2.2 153 69 6.5 5.6 44 3 41
Senegal 13.9 40 8 3.2 -1 21.8 35.1 2.5 111 43 7.3 5.3 44 3 39
Sierra Leone 6.3 38 17 2.1 -1 8.2 10.5 1.7 197 92 6.7 4.9 42 3 35
Togo 7.0 37 11 2.6 -0 10.0 14.5 2.1 120 66 7.1 4.7 42 3 47
EASTERN AFRICA 378 36 9 2.7 0 561 851 2.3 134 57 7.1 4.9 44 3 45
Burundi 10.5 45 13 3.2 -0 16.4 26.7 2.5 139 87 7.3 6.1 45 2 44
Comoros 0.7 34 9 2.5 -3 1.0 1.3 1.8 134 36 7.1 4.3 42 3 48
Djibouti 0.9 28 9 1.9 -4 1.1 1.2 1.4 112 55 6.8 3.4 34 4 49
Eritrea 6.5 33 7 2.6 2 9.8 14.3 2.2 151 42 6.7 4.7 43 2 41
Ethiopia 95.9 28 8 2.1 -0 130.5 165.1 1.7 144 50 7.0 4.1 43 3 43
Kenya 43.2 34 9 2.6 -0 60.0 81.3 1.9 98 47 8.1 4.3 42 3 52
Madagascar 22.4 34 7 2.7 -0 34.3 52.8 2.4 139 42 7.3 4.4 42 3 45
Malawi 16.8 40 12 2.9 0 26.0 41.2 2.4 175 66 7.3 5.5 45 3 41
Mauritius 1.3 11 8 0.3 -0 1.3 1.2 1.0 66 12.1 3.8 1.4 21 8 63
Mayotte 0.2 31 3 2.8 -5 0.3 0.5 2.1 53 4 7.9 4.1 45 2 62
Mozambique 25.1 43 13 2.9 0 38.4 63.5 2.5 165 85 6.6 5.7 45 3 39
Reunion 0.9 17 5 1.2 -5 1.0 1.2 1.4 53 7 4.8 2.4 24 9 63
Rwanda 11.1 31 8 2.3 -1 15.8 21.0 1.9 136 49 8.2 4.0 41 3 44
Seychelles 0.1 19 7 1.1 2 0.1 0.1 1.1 54 11.4 5.8 2.4 22 8 66
Somalia 10.8 44 12 3.2 -3 16.9 27.1 2.5 154 80 7.2 6.6 48 3 41
South Sudan 11.7 36 12 2.4 16 17.3 39.3 3.3 187 78 6.9 7.0 42 3 36
per woman to 2.8.in 2050. contraception. P O P U
POPULATION, HEALTH, AND ENVIRONMENT DATA AND ESTIMATES FOR THE COUNTRIES AND REGIONS OF THE WORLD
© 2014 Population Reference Bureau See notes on page 18 2014 WORLD POPULATION DATA SHEET 9
POPULATION, HEALTH, AND ENVIRONMENT DATA AND ESTIMATES FOR THE
Population
mid-2014
(millions)
Births
per 1,000
Population
Deaths
per 1,000
Population
Rate of
Natural
Increase
(%)
Net
Migration
Rate
per 1,000
Population
Projected
Population (millions)
2050
Population
as a
Multiple of
2014
Infant
Mortality Ratea
Total
Fertility Rateb Percent of Population
mid-2030 mid-2050 1970 2013* 1970 2013* Ages 15 Ages 65+
Both Sex
1970
WORLD 7,238 20 8 1.2 — 8,444 9,683 1.3 89 38 4.7 2.5 26 8 58
MORE DEVELOPED 1,249 11 10 0.1 2 1,292 1,309 1.0 24 5 2.3 1.6 16 17 71
LESS DEVELOPED 5,989 22 7 1.4 0 7,152 8,375 1.4 100 42 5.7 2.6 29 6 55
LESS DEVELOPED (EXCL. CHINA) 4,625 24 7 1.7 -1 5,752 7,063 1.5 119 46 5.8 3.0 32 5 51
LEAST DEVELOPED 916 33 9 2.4 -1 1,290 1,855 2.0 150 64 5.7 4.3 40 4 44
AFRICA 1,136 36 10 2.5 0 1,637 2,428 2.1 139 62 6.7 4.7 41 4 45
SUB-SAHARAN AFRICA 920 37 11 2.6 0 1,360 2,081 2.3 138 67 6.7 5.1 43 3 44
NORTHERN AFRICA 217 28 7 2.2 -2 277 347 1.6 140 33 6.5 3.4 32 5 52
Algeria 39.1 25 6 1.9 -1 49.9 60.3 1.5 128 26 7.6 2.9 28 6 50
Egypt 87.9 32 6 2.6 -1 113.2 146.0 1.7 169 29 5.9 3.5 32 6 52
Libya 6.3 21 4 1.7 -7 7.5 8.4 1.3 104 14 7.9 2.4 29 5 56
Morocco 33.3 22 6 1.5 -3 38.2 41.4 1.2 118 29 6.7 2.6 28 5 53
Sudan 38.8 34 8 2.5 -4 55.1 77.1 2.0 97 55 6.9 5.2 41 3 52
Tunisia 11.0 19 6 1.3 -3 12.4 13.1 1.2 158 16 6.4 2.2 24 7 51
Western Saharae 0.6 21 6 1.5 17 0.8 0.8 1.4 168 37 6.6 2.4 27 3 42
WESTERN AFRICA 339 39 12 2.7 -1 507 784 2.3 152 66 6.7 5.4 44 3 41
Benin 10.3 37 10 2.7 -0 15.0 21.5 2.1 155 69 6.8 4.9 43 3 42
Burkina Faso 17.9 43 11 3.1 -2 28.4 46.6 2.6 163 70 6.6 5.9 46 2 39
Cape Verde 0.5 22 5 1.7 -7 0.6 0.7 1.5 109 24 6.9 2.6 30 5 52
Côte d'Ivoire 20.8 37 14 2.3 1 29.2 42.3 2.0 156 75 7.9 4.9 41 3 44
Gambia 1.9 41 10 3.1 -2 3.1 4.9 2.5 120 55 6.1 5.6 46 2 38
Ghana 27.0 34 9 2.5 -1 37.7 52.6 1.9 110 53 7.0 4.3 38 5 49
Guinea 11.6 38 12 2.7 -0 16.9 23.9 2.1 190 67 6.2 5.1 42 3 37
Guinea-Bissau 1.7 38 13 2.5 -1 2.5 3.5 2.0 144 94 6.1 5.0 41 3 44
Liberia 4.4 35 9 2.6 -1 6.4 9.4 2.1 186 54 6.7 4.7 43 3 39
Mali 15.9 42 13 2.9 -2 26.3 45.6 2.9 184 58 6.9 6.1 48 3 32
Mauritania 4.0 34 9 2.6 -1 5.6 7.9 2.0 110 72 6.8 4.1 40 3 49
Niger 18.2 50 11 3.9 -0 33.8 68.0 3.7 154 54 7.4 7.6 50 3 36
Nigeria 177.5 39 13 2.5 -0 261.7 396.5 2.2 153 69 6.5 5.6 44 3 41
Senegal 13.9 40 8 3.2 -1 21.8 35.1 2.5 111 43 7.3 5.3 44 3 39
Sierra Leone 6.3 38 17 2.1 -1 8.2 10.5 1.7 197 92 6.7 4.9 42 3 35
Togo 7.0 37 11 2.6 -0 10.0 14.5 2.1 120 66 7.1 4.7 42 3 47
EASTERN AFRICA 378 36 9 2.7 0 561 851 2.3 134 57 7.1 4.9 44 3 45
Burundi 10.5 45 13 3.2 -0 16.4 26.7 2.5 139 87 7.3 6.1 45 2 44
Comoros 0.7 34 9 2.5 -3 1.0 1.3 1.8 134 36 7.1 4.3 42 3 48
Djibouti 0.9 28 9 1.9 -4 1.1 1.2 1.4 112 55 6.8 3.4 34 4 49
Eritrea 6.5 33 7 2.6 2 9.8 14.3 2.2 151 42 6.7 4.7 43 2 41
Ethiopia 95.9 28 8 2.1 -0 130.5 165.1 1.7 144 50 7.0 4.1 43 3 43
Kenya 43.2 34 9 2.6 -0 60.0 81.3 1.9 98 47 8.1 4.3 42 3 52
Madagascar 22.4 34 7 2.7 -0 34.3 52.8 2.4 139 42 7.3 4.4 42 3 45
Malawi 16.8 40 12 2.9 0 26.0 41.2 2.4 175 66 7.3 5.5 45 3 41
Mauritius 1.3 11 8 0.3 -0 1.3 1.2 1.0 66 12.1 3.8 1.4 21 8 63
Mayotte 0.2 31 3 2.8 -5 0.3 0.5 2.1 53 4 7.9 4.1 45 2 62
Mozambique 25.1 43 13 2.9 0 38.4 63.5 2.5 165 85 6.6 5.7 45 3 39
Reunion 0.9 17 5 1.2 -5 1.0 1.2 1.4 53 7 4.8 2.4 24 9 63
Rwanda 11.1 31 8 2.3 -1 15.8 21.0 1.9 136 49 8.2 4.0 41 3 44
Seychelles 0.1 19 7 1.1 2 0.1 0.1 1.1 54 11.4 5.8 2.4 22 8 66
Somalia 10.8 44 12 3.2 -3 16.9 27.1 2.5 154 80 7.2 6.6 48 3 41
South Sudan 11.7 36 12 2.4 16 17.3 39.3 3.3 187 78 6.9 7.0 42 3 36
per woman to 2.8.in 2050. contraception. P O P UPanama 3.9 20 5 1.5 2 4.8 5.6 1.4 53 14 5.2 2.5 28 7 66
CARIBBEAN 43 18 8 1.1 -4 47 49 1.1 77 33 4.7 2.3 26 9 62
Antigua and Barbuda 0.1 14 5 0.8 5 0.1 0.1 1.4 45 16 3.7 1.8 24 7 66
Bahamas 0.4 16 5 1.1 2 0.4 0.5 1.3 36 17 3.5 2.0 26 6 66
Barbados 0.3 12 8 0.4 1 0.3 0.3 1.1 46 10 3.1 1.8 20 13 65
Cuba 11.2 11 8 0.3 -4 10.7 9.3 0.8 45 4.6 4.0 1.7 17 13 70
Curacao 0.2 13 8 0.5 4 0.2 0.2 1.2 31 9.8 3.3 2.2 19 15 69
Dominica 0.1 13 8 0.5 -6 0.1 0.1 0.9 — 21 — 2.0 22 10 —
Dominican Republic 10.4 21 6 1.5 -3 12.0 13.2 1.3 102 25 6.2 2.5 31 6 58
Grenada 0.1 16 7 0.8 -2 0.1 0.1 0.9 49 9 4.6 2.0 27 7 64
Guadeloupe 0.4 13 7 0.6 -7 0.4 0.4 1.0 37 8.1 4.9 2.2 21 15 65
Haiti 10.8 28 9 1.9 -3 13.5 16.8 1.6 141 59 5.8 3.4 35 4 47
Jamaica 2.7 18 7 1.1 -5 2.9 2.7 1.0 48 21 5.5 2.3 27 8 68
Martinique 0.4 12 7 0.4 -10 0.4 0.4 1.1 40 8 4.6 1.9 19 17 66
Puerto Rico 3.6 11 8 0.3 -13 3.4 3.0 0.8 29 8.1 3.2 1.6 19 16 72
St. Kitts-Nevis 0.1 13 7 0.6 7 0.1 0.1 1.2 — 17 — 1.6 22 8 —
St. Lucia 0.2 13 8 0.6 0 0.2 0.2 1.0 50 20 6.1 1.5 23 9 63
St. Vincent and the Grenadines 0.1 17 8 0.9 -9 0.1 0.1 1.0 64 20 6.0 2.2 25 7 65
Trinidad and Tobago 1.3 13 10 0.3 -3 1.2 1.0 0.7 46 24 3.6 1.6 20 9 65
SOUTH AMERICA 410 17 6 1.1 -0 467 503 1.2 89 18 4.9 2.1 26 8 60
Argentina 42.7 19 7 1.1 -0 50.2 59.4 1.4 53 11.7 3.1 2.3 25 10 66
Bolivia 10.3 26 7 1.9 0 13.0 15.8 1.5 156 39 6.6 3.2 35 5 46
Brazil 202.8 15 6 0.9 0 223.1 226.3 1.1 96 20 5.0 1.8 24 7 59
Chile 17.7 14 6 0.9 0 19.6 20.2 1.1 79 7.7 4.0 1.9 22 10 62
Colombia 47.7 19 6 1.3 -2 55.7 61.3 1.3 78 18 5.6 2.3 28 7 61
Ecuador 16.0 23 5 1.8 -0 19.8 23.4 1.5 101 17 6.1 2.8 31 7 58
French Guiana 0.3 27 3 2.4 2 0.4 0.6 2.4 47 10 4.7 3.5 34 5 65
Guyana 0.7 20 7 1.3 -15 0.8 0.8 1.0 60 29 5.1 2.5 36 3 59
Paraguay 6.9 23 6 1.7 -1 8.6 10.1 1.5 56 29 5.7 2.8 33 5 65
Peru 30.8 20 5 1.5 -3 35.9 40.1 1.3 118 16 6.3 2.4 29 6 53
Suriname 0.6 20 7 1.3 -2 0.7 0.7 1.3 46 20 5.7 2.6 28 6 63
Uruguay 3.4 14 9 0.5 -2 3.6 3.6 1.1 47 9.3 2.9 2.0 22 14 69
Venezuela 30.2 20 5 1.5 0 36.1 40.5 1.3 54 14.4 5.4 2.4 29 6 65
Population
(millions)
Birth Rate Death Rate Natural Increase
(%)
Migration Rate mid-2030 mid-2050 Population
Change
1970 2013* 1970 2013* 15 65+ Both, 197
Population (millions) Infant Mortality Total Fertility Rate % of Population
NOTES
(—) Indicates data unavailable or inapplicable.
* Denotes 2013 or most recent year for which data are available.
a Infant deaths per 1,000 live births. Rates shown with decimals indicate national statistics
reported as completely registered, while those without are estimates from the sources
cited on the reverse. Rates shown in italics are based upon fewer than 50 annual infant
deaths and, as a result, are subject to considerable yearly variability.
b Average number of children born to a woman during
c Data prior to 2008 are shown in italics.
d Data prior to 2013 are shown in italics.
e The status of Western Sahara is disputed by Morocc
f Special Administrative Region.
g Does not include the population of Crimea, estimate
1875 Connecticut Ave., NW, Washington, DC 20009 USA
tel. 202-483-1100 | fax 202-328-3937
e-mail: popref@prb.org | website: www.prb.org
POPULATION, HEALTH, AND ENVIRONMENT DATA AND ESTIMATES FOR THE
Population
mid-2014
(millions)
Births
per 1,000
Population
Deaths
per 1,000
Population
Rate of
Natural
Increase
(%)
Net
Migration
Rate
per 1,000
Population
Projected
Population (millions)
2050
Population
as a
Multiple of
2014
Infant
Mortality Ratea
Total
Fertility Rateb Percent of Population
mid-2030 mid-2050 1970 2013* 1970 2013* Ages 15 Ages 65+
Both Sex
1970
ASIA 4,351 18 7 1.1 -0 4,907 5,252 1.2 91 34 5.4 2.2 25 7 57
ASIA (Excl. China) 2,987 21 7 1.4 -0 3,507 3,941 1.3 114 40 5.9 2.5 29 6 53
WESTERN ASIA 255 22 5 1.7 2 322 387 1.5 122 25 5.8 2.9 30 5 56
Armenia 3.0 14 9 0.5 -8 3.0 2.8 0.9 66 10 3.2 1.6 19 11 70
Azerbaijan 9.5 18 6 1.3 0 11.1 12.1 1.3 103 11 4.6 2.2 22 6 65
Bahrain 1.3 15 2 1.3 20 1.6 1.8 1.4 58 8 6.5 2.1 21 2 63
Cyprus 1.2 13 7 0.6 -2 1.3 1.4 1.2 26 6 2.5 1.5 17 12 73
Georgia 4.8 13 11 0.2 -1 4.8 4.6 1.0 55 11 2.6 1.7 17 14 67
Iraq 35.1 31 5 2.6 1 53.8 80.5 2.3 80 29 7.4 4.1 40 3 58
Israel 8.2 21 5 1.6 3 10.5 13.9 1.7 23 3.0 3.8 3.0 28 10 72
Jordan 7.6 28 4 2.4 -8 9.9 13.1 1.7 71 17 7.9 3.5 34 4 60
Kuwait 3.7 18 2 1.7 35 5.1 6.6 1.8 47 8 7.2 2.4 23 2 66
Lebanon 5.0 13 4 0.9 20 5.2 5.3 1.1 44 9 5.0 1.5 20 9 66
Oman 4.1 20 2 1.8 39 5.4 6.3 1.6 120 9 7.3 2.8 22 3 50
Palestinian Territory 4.4 31 4 2.7 -1 6.6 9.1 2.1 99 20 7.9 4.1 40 3 56
Qatar 2.3 11 1 1.0 2 2.8 3.0 1.3 43 7 6.9 2.1 14 1 68
Saudi Arabia 30.8 22 4 1.8 2 37.4 42.4 1.4 122 16 7.3 2.9 30 3 53
Syria 22.0 24 4 2.1 -11 29.9 36.7 1.7 81 17 7.6 3.0 35 4 59
Turkey 77.2 16 5 1.1 0 88.3 93.3 1.2 145 10 5.7 2.1 25 8 52
United Arab Emirates 9.4 15 1 1.4 22 12.3 15.5 1.6 67 6 6.6 1.8 16 0 62
Yemen 26.0 36 8 2.8 -1 33.6 38.8 1.5 196 68 7.5 4.4 42 3 41
SOUTH CENTRAL ASIA 1,874 22 7 1.6 -1 2,220 2,516 1.3 133 47 5.7 2.5 31 5 49
CENTRAL ASIA 67 24 6 1.8 -1 81 93 1.4 95 41 5.1 2.7 29 5 62
Kazakhstan 17.3 23 8 1.5 -0 20.3 24.5 1.4 81 28 3.5 2.7 25 7 63
Kyrgyzstan 5.8 28 7 2.1 -1 7.5 9.4 1.6 105 27 4.9 3.2 31 4 61
Tajikistan 8.3 34 7 2.7 -5 11.2 14.8 1.8 129 57 6.9 3.8 36 3 60
40Percentag
population
ULATION Data Sheet
C E B U R E A U
POPULATION, HEALTH, AND ENVIRONMENT DATA AND ESTIMATES FOR THE COUNTRIES AND REGIONS OF THE WORLD
© 2014 Population Reference Bureau See notes on page 18 2014 WORLD POPULATION DATA SHEET 10
POPULATION, HEALTH, AND ENVIRONMENT DATA AND ESTIMATES FOR THE
Population
mid-2014
(millions)
Births
per 1,000
Population
Deaths
per 1,000
Population
Rate of
Natural
Increase
(%)
Net
Migration
Rate
per 1,000
Population
Projected
Population (millions)
2050
Population
as a
Multiple of
2014
Infant
Mortality Ratea
Total
Fertility Rateb Percent of Population
mid-2030 mid-2050 1970 2013* 1970 2013* Ages 15 Ages 65+
Both Sex
1970
WORLD 7,238 20 8 1.2 — 8,444 9,683 1.3 89 38 4.7 2.5 26 8 58
MORE DEVELOPED 1,249 11 10 0.1 2 1,292 1,309 1.0 24 5 2.3 1.6 16 17 71
LESS DEVELOPED 5,989 22 7 1.4 0 7,152 8,375 1.4 100 42 5.7 2.6 29 6 55
LESS DEVELOPED (EXCL. CHINA) 4,625 24 7 1.7 -1 5,752 7,063 1.5 119 46 5.8 3.0 32 5 51
LEAST DEVELOPED 916 33 9 2.4 -1 1,290 1,855 2.0 150 64 5.7 4.3 40 4 44
AFRICA 1,136 36 10 2.5 0 1,637 2,428 2.1 139 62 6.7 4.7 41 4 45
SUB-SAHARAN AFRICA 920 37 11 2.6 0 1,360 2,081 2.3 138 67 6.7 5.1 43 3 44
NORTHERN AFRICA 217 28 7 2.2 -2 277 347 1.6 140 33 6.5 3.4 32 5 52
Algeria 39.1 25 6 1.9 -1 49.9 60.3 1.5 128 26 7.6 2.9 28 6 50
Egypt 87.9 32 6 2.6 -1 113.2 146.0 1.7 169 29 5.9 3.5 32 6 52
Libya 6.3 21 4 1.7 -7 7.5 8.4 1.3 104 14 7.9 2.4 29 5 56
Morocco 33.3 22 6 1.5 -3 38.2 41.4 1.2 118 29 6.7 2.6 28 5 53
Sudan 38.8 34 8 2.5 -4 55.1 77.1 2.0 97 55 6.9 5.2 41 3 52
Tunisia 11.0 19 6 1.3 -3 12.4 13.1 1.2 158 16 6.4 2.2 24 7 51
Western Saharae 0.6 21 6 1.5 17 0.8 0.8 1.4 168 37 6.6 2.4 27 3 42
WESTERN AFRICA 339 39 12 2.7 -1 507 784 2.3 152 66 6.7 5.4 44 3 41
Benin 10.3 37 10 2.7 -0 15.0 21.5 2.1 155 69 6.8 4.9 43 3 42
Burkina Faso 17.9 43 11 3.1 -2 28.4 46.6 2.6 163 70 6.6 5.9 46 2 39
Cape Verde 0.5 22 5 1.7 -7 0.6 0.7 1.5 109 24 6.9 2.6 30 5 52
Côte d'Ivoire 20.8 37 14 2.3 1 29.2 42.3 2.0 156 75 7.9 4.9 41 3 44
Gambia 1.9 41 10 3.1 -2 3.1 4.9 2.5 120 55 6.1 5.6 46 2 38
Ghana 27.0 34 9 2.5 -1 37.7 52.6 1.9 110 53 7.0 4.3 38 5 49
Guinea 11.6 38 12 2.7 -0 16.9 23.9 2.1 190 67 6.2 5.1 42 3 37
Guinea-Bissau 1.7 38 13 2.5 -1 2.5 3.5 2.0 144 94 6.1 5.0 41 3 44
Liberia 4.4 35 9 2.6 -1 6.4 9.4 2.1 186 54 6.7 4.7 43 3 39
Mali 15.9 42 13 2.9 -2 26.3 45.6 2.9 184 58 6.9 6.1 48 3 32
Mauritania 4.0 34 9 2.6 -1 5.6 7.9 2.0 110 72 6.8 4.1 40 3 49
Niger 18.2 50 11 3.9 -0 33.8 68.0 3.7 154 54 7.4 7.6 50 3 36
Nigeria 177.5 39 13 2.5 -0 261.7 396.5 2.2 153 69 6.5 5.6 44 3 41
Senegal 13.9 40 8 3.2 -1 21.8 35.1 2.5 111 43 7.3 5.3 44 3 39
Sierra Leone 6.3 38 17 2.1 -1 8.2 10.5 1.7 197 92 6.7 4.9 42 3 35
Togo 7.0 37 11 2.6 -0 10.0 14.5 2.1 120 66 7.1 4.7 42 3 47
EASTERN AFRICA 378 36 9 2.7 0 561 851 2.3 134 57 7.1 4.9 44 3 45
Burundi 10.5 45 13 3.2 -0 16.4 26.7 2.5 139 87 7.3 6.1 45 2 44
Comoros 0.7 34 9 2.5 -3 1.0 1.3 1.8 134 36 7.1 4.3 42 3 48
Djibouti 0.9 28 9 1.9 -4 1.1 1.2 1.4 112 55 6.8 3.4 34 4 49
Eritrea 6.5 33 7 2.6 2 9.8 14.3 2.2 151 42 6.7 4.7 43 2 41
Ethiopia 95.9 28 8 2.1 -0 130.5 165.1 1.7 144 50 7.0 4.1 43 3 43
Kenya 43.2 34 9 2.6 -0 60.0 81.3 1.9 98 47 8.1 4.3 42 3 52
Madagascar 22.4 34 7 2.7 -0 34.3 52.8 2.4 139 42 7.3 4.4 42 3 45
Malawi 16.8 40 12 2.9 0 26.0 41.2 2.4 175 66 7.3 5.5 45 3 41
Mauritius 1.3 11 8 0.3 -0 1.3 1.2 1.0 66 12.1 3.8 1.4 21 8 63
Mayotte 0.2 31 3 2.8 -5 0.3 0.5 2.1 53 4 7.9 4.1 45 2 62
Mozambique 25.1 43 13 2.9 0 38.4 63.5 2.5 165 85 6.6 5.7 45 3 39
Reunion 0.9 17 5 1.2 -5 1.0 1.2 1.4 53 7 4.8 2.4 24 9 63
Rwanda 11.1 31 8 2.3 -1 15.8 21.0 1.9 136 49 8.2 4.0 41 3 44
Seychelles 0.1 19 7 1.1 2 0.1 0.1 1.1 54 11.4 5.8 2.4 22 8 66
Somalia 10.8 44 12 3.2 -3 16.9 27.1 2.5 154 80 7.2 6.6 48 3 41
South Sudan 11.7 36 12 2.4 16 17.3 39.3 3.3 187 78 6.9 7.0 42 3 36
per woman to 2.8.in 2050. contraception. P O P UKuwait 3.7 18 2 1.7 35 5.1 6.6 1.8 47 8 7.2 2.4 23 2 66
Lebanon 5.0 13 4 0.9 20 5.2 5.3 1.1 44 9 5.0 1.5 20 9 66
Oman 4.1 20 2 1.8 39 5.4 6.3 1.6 120 9 7.3 2.8 22 3 50
Palestinian Territory 4.4 31 4 2.7 -1 6.6 9.1 2.1 99 20 7.9 4.1 40 3 56
Qatar 2.3 11 1 1.0 2 2.8 3.0 1.3 43 7 6.9 2.1 14 1 68
Saudi Arabia 30.8 22 4 1.8 2 37.4 42.4 1.4 122 16 7.3 2.9 30 3 53
Syria 22.0 24 4 2.1 -11 29.9 36.7 1.7 81 17 7.6 3.0 35 4 59
Turkey 77.2 16 5 1.1 0 88.3 93.3 1.2 145 10 5.7 2.1 25 8 52
United Arab Emirates 9.4 15 1 1.4 22 12.3 15.5 1.6 67 6 6.6 1.8 16 0 62
Yemen 26.0 36 8 2.8 -1 33.6 38.8 1.5 196 68 7.5 4.4 42 3 41
SOUTH CENTRAL ASIA 1,874 22 7 1.6 -1 2,220 2,516 1.3 133 47 5.7 2.5 31 5 49
CENTRAL ASIA 67 24 6 1.8 -1 81 93 1.4 95 41 5.1 2.7 29 5 62
Kazakhstan 17.3 23 8 1.5 -0 20.3 24.5 1.4 81 28 3.5 2.7 25 7 63
Kyrgyzstan 5.8 28 7 2.1 -1 7.5 9.4 1.6 105 27 4.9 3.2 31 4 61
Tajikistan 8.3 34 7 2.7 -5 11.2 14.8 1.8 129 57 6.9 3.8 36 3 60
Turkmenistan 5.3 22 8 1.4 -1 6.2 6.6 1.2 116 47 6.3 2.4 28 4 58
Uzbekistan 30.7 22 5 1.8 -1 35.8 38.1 1.2 89 44 6.5 2.4 28 4 63
SOUTH ASIA 1,806 22 7 1.5 -1 2,139 2,422 1.3 134 47 5.8 2.5 31 5 49
Afghanistan 31.3 35 8 2.7 -3 43.5 56.5 1.8 208 74 7.7 5.1 46 2 37
Bangladesh 158.5 20 6 1.5 -3 185.1 201.9 1.3 165 33 7.0 2.2 29 5 48
Bhutan 0.7 22 6 1.5 0 0.9 1.1 1.5 174 47 6.7 2.5 30 5 37
India 1,296.2 22 7 1.5 -0 1,510.0 1,656.9 1.3 129 44 5.5 2.4 31 5 49
Iran 77.4 19 5 1.4 -0 90.0 99.2 1.3 139 16 6.4 1.8 24 5 51
Maldives 0.4 23 3 1.9 -0 0.5 0.5 1.4 161 9 7.2 2.3 26 5 44
Nepal 27.1 22 7 1.5 -3 31.7 35.2 1.3 166 46 6.0 2.4 34 5 42
Pakistan 194.0 28 8 2.0 -3 254.7 348.0 1.8 123 74 6.6 3.8 38 4 53
Sri Lanka 20.7 18 6 1.2 -3 22.5 23.0 1.1 49 9 4.3 2.1 26 8 64
SOUTHEAST ASIA 621 19 7 1.3 -0 733 831 1.3 89 28 5.7 2.4 27 6 55
Brunei 0.4 16 3 1.3 1 0.5 0.5 1.3 34 4 5.8 1.6 25 5 67
Cambodia 14.8 24 6 1.8 -2 18.4 21.7 1.5 123 45 6.5 2.8 31 6 42
Indonesia 251.5 20 6 1.4 -1 306.7 365.3 1.5 109 32 5.5 2.6 29 5 52
Laos 6.8 26 6 2.0 -2 8.3 9.1 1.3 143 68 6.0 3.2 35 4 46
Malaysia 30.1 17 5 1.3 3 36.0 41.1 1.4 42 7 4.9 2.1 26 6 64
Myanmar 53.7 17 9 0.9 -1 58.7 58.6 1.1 116 49 6.0 2.0 25 5 51
Philippines 100.1 24 6 1.8 -1 127.8 157.1 1.6 63 23 6.3 3.0 34 4 61
Singapore 5.5 9 5 0.5 12 6.5 7.0 1.3 22 2.0 3.2 1.2 16 11 68
Thailand 66.4 12 8 0.4 0 66.8 61.0 0.9 69 11 5.6 1.8 18 10 60
Timor-Leste 1.2 37 10 2.7 0 1.8 2.9 2.4 186 63 5.9 5.7 42 5 40
Vietnam 90.7 17 7 1.0 -0 102.0 106.3 1.2 55 15 6.5 2.1 24 7 60
EAST ASIA 1,601 12 7 0.4 0 1,631 1,519 0.9 49 14 4.9 1.5 16 11 64
China 1,364.1 12 7 0.5 -0 1,400.1 1,311.8 1.0 51 15 5.5 1.6 16 10 63
China, Hong Kong SARf 7.2 8 6 0.2 4 8.1 8.6 1.2 21 1.6 3.3 1.1 11 15 72
China, Macao SARf 0.6 11 3 0.8 35 0.7 0.8 1.3 31 3 2.2 1.2 11 8 69
Japan 127.1 8 10 -0.2 1 116.6 97.1 0.8 14 1.9 2.1 1.4 13 26 72
Korea, North 24.9 15 9 0.5 -0 26.7 27.0 1.1 51 26 4.3 2.0 22 9 60
Korea, South 50.4 9 5 0.3 0 52.2 48.1 1.0 50 2.9 4.5 1.2 15 12 61
Mongolia 2.9 28 6 2.3 -0 3.5 4.3 1.5 112 26 7.6 2.9 28 4 55
Taiwan 23.4 8 7 0.1 1 23.5 21.0 0.9 27 3.7 3.9 1.1 14 12 68
EUROPE 741 11 11 0.0 2 746 726 1.0 27 6 2.3 1.6 16 17 70
EUROPEAN UNION 507 10 10 0.0 1 517 514 1.0 25 4 2.4 1.5 16 18 71
NORTHERN EUROPE 102 12 9 0.3 2 111 119 1.2 17 3 2.3 1.8 18 17 72
Channel Islands 0.2 11 8 0.3 0 0.2 0.2 1.1 24 2.9 2.1 1.7 15 16 72
Denmark 5.6 10 9 0.1 5 5.9 6.1 1.1 14 3.0 2.0 1.7 17 18 73
Estonia 1.3 11 12 -0.1 -5 1.2 1.2 0.9 22 2.1 2.2 1.5 16 18 70
Finland 5.5 11 9 0.1 3 5.8 6.1 1.1 13 1.8 1.8 1.8 16 19 70
Iceland 0.3 13 7 0.7 5 0.4 0.4 1.3 13 1.8 2.8 1.9 21 13 74
Ireland 4.6 15 7 0.9 -7 5.2 5.7 1.2 20 3.3 3.9 2.0 22 12 71
Latvia 2.0 10 14 -0.4 -12 1.6 1.4 0.7 20 3.6 2.0 1.5 14 19 70
Lithuania 2.9 10 14 -0.4 -6 2.7 2.5 0.9 23 3.6 2.4 1.6 15 18 71
POPULATION, HEALTH, AND ENVIRONMENT DATA AND ESTIMATES FOR THE COUNTRIES AND REGIONS OF THE WORLD
© 2014 Population Reference Bureau See notes on page 18 2014 WORLD POPULATION DATA SHEET 11
POPULATION, HEALTH, AND ENVIRONMENT DATA AND ESTIMATES FOR THE
Population
mid-2014
(millions)
Births
per 1,000
Population
Deaths
per 1,000
Population
Rate of
Natural
Increase
(%)
Net
Migration
Rate
per 1,000
Population
Projected
Population (millions)
2050
Population
as a
Multiple of
2014
Infant
Mortality Ratea
Total
Fertility Rateb Percent of Population
mid-2030 mid-2050 1970 2013* 1970 2013* Ages 15 Ages 65+
Both Sex
1970
WORLD 7,238 20 8 1.2 — 8,444 9,683 1.3 89 38 4.7 2.5 26 8 58
MORE DEVELOPED 1,249 11 10 0.1 2 1,292 1,309 1.0 24 5 2.3 1.6 16 17 71
LESS DEVELOPED 5,989 22 7 1.4 0 7,152 8,375 1.4 100 42 5.7 2.6 29 6 55
LESS DEVELOPED (EXCL. CHINA) 4,625 24 7 1.7 -1 5,752 7,063 1.5 119 46 5.8 3.0 32 5 51
LEAST DEVELOPED 916 33 9 2.4 -1 1,290 1,855 2.0 150 64 5.7 4.3 40 4 44
AFRICA 1,136 36 10 2.5 0 1,637 2,428 2.1 139 62 6.7 4.7 41 4 45
SUB-SAHARAN AFRICA 920 37 11 2.6 0 1,360 2,081 2.3 138 67 6.7 5.1 43 3 44
NORTHERN AFRICA 217 28 7 2.2 -2 277 347 1.6 140 33 6.5 3.4 32 5 52
Algeria 39.1 25 6 1.9 -1 49.9 60.3 1.5 128 26 7.6 2.9 28 6 50
Egypt 87.9 32 6 2.6 -1 113.2 146.0 1.7 169 29 5.9 3.5 32 6 52
Libya 6.3 21 4 1.7 -7 7.5 8.4 1.3 104 14 7.9 2.4 29 5 56
Morocco 33.3 22 6 1.5 -3 38.2 41.4 1.2 118 29 6.7 2.6 28 5 53
Sudan 38.8 34 8 2.5 -4 55.1 77.1 2.0 97 55 6.9 5.2 41 3 52
Tunisia 11.0 19 6 1.3 -3 12.4 13.1 1.2 158 16 6.4 2.2 24 7 51
Western Saharae 0.6 21 6 1.5 17 0.8 0.8 1.4 168 37 6.6 2.4 27 3 42
WESTERN AFRICA 339 39 12 2.7 -1 507 784 2.3 152 66 6.7 5.4 44 3 41
Benin 10.3 37 10 2.7 -0 15.0 21.5 2.1 155 69 6.8 4.9 43 3 42
Burkina Faso 17.9 43 11 3.1 -2 28.4 46.6 2.6 163 70 6.6 5.9 46 2 39
Cape Verde 0.5 22 5 1.7 -7 0.6 0.7 1.5 109 24 6.9 2.6 30 5 52
Côte d'Ivoire 20.8 37 14 2.3 1 29.2 42.3 2.0 156 75 7.9 4.9 41 3 44
Gambia 1.9 41 10 3.1 -2 3.1 4.9 2.5 120 55 6.1 5.6 46 2 38
Ghana 27.0 34 9 2.5 -1 37.7 52.6 1.9 110 53 7.0 4.3 38 5 49
Guinea 11.6 38 12 2.7 -0 16.9 23.9 2.1 190 67 6.2 5.1 42 3 37
Guinea-Bissau 1.7 38 13 2.5 -1 2.5 3.5 2.0 144 94 6.1 5.0 41 3 44
Liberia 4.4 35 9 2.6 -1 6.4 9.4 2.1 186 54 6.7 4.7 43 3 39
Mali 15.9 42 13 2.9 -2 26.3 45.6 2.9 184 58 6.9 6.1 48 3 32
Mauritania 4.0 34 9 2.6 -1 5.6 7.9 2.0 110 72 6.8 4.1 40 3 49
Niger 18.2 50 11 3.9 -0 33.8 68.0 3.7 154 54 7.4 7.6 50 3 36
Nigeria 177.5 39 13 2.5 -0 261.7 396.5 2.2 153 69 6.5 5.6 44 3 41
Senegal 13.9 40 8 3.2 -1 21.8 35.1 2.5 111 43 7.3 5.3 44 3 39
Sierra Leone 6.3 38 17 2.1 -1 8.2 10.5 1.7 197 92 6.7 4.9 42 3 35
Togo 7.0 37 11 2.6 -0 10.0 14.5 2.1 120 66 7.1 4.7 42 3 47
EASTERN AFRICA 378 36 9 2.7 0 561 851 2.3 134 57 7.1 4.9 44 3 45
Burundi 10.5 45 13 3.2 -0 16.4 26.7 2.5 139 87 7.3 6.1 45 2 44
Comoros 0.7 34 9 2.5 -3 1.0 1.3 1.8 134 36 7.1 4.3 42 3 48
Djibouti 0.9 28 9 1.9 -4 1.1 1.2 1.4 112 55 6.8 3.4 34 4 49
Eritrea 6.5 33 7 2.6 2 9.8 14.3 2.2 151 42 6.7 4.7 43 2 41
Ethiopia 95.9 28 8 2.1 -0 130.5 165.1 1.7 144 50 7.0 4.1 43 3 43
Kenya 43.2 34 9 2.6 -0 60.0 81.3 1.9 98 47 8.1 4.3 42 3 52
Madagascar 22.4 34 7 2.7 -0 34.3 52.8 2.4 139 42 7.3 4.4 42 3 45
Malawi 16.8 40 12 2.9 0 26.0 41.2 2.4 175 66 7.3 5.5 45 3 41
Mauritius 1.3 11 8 0.3 -0 1.3 1.2 1.0 66 12.1 3.8 1.4 21 8 63
Mayotte 0.2 31 3 2.8 -5 0.3 0.5 2.1 53 4 7.9 4.1 45 2 62
Mozambique 25.1 43 13 2.9 0 38.4 63.5 2.5 165 85 6.6 5.7 45 3 39
Reunion 0.9 17 5 1.2 -5 1.0 1.2 1.4 53 7 4.8 2.4 24 9 63
Rwanda 11.1 31 8 2.3 -1 15.8 21.0 1.9 136 49 8.2 4.0 41 3 44
Seychelles 0.1 19 7 1.1 2 0.1 0.1 1.1 54 11.4 5.8 2.4 22 8 66
Somalia 10.8 44 12 3.2 -3 16.9 27.1 2.5 154 80 7.2 6.6 48 3 41
South Sudan 11.7 36 12 2.4 16 17.3 39.3 3.3 187 78 6.9 7.0 42 3 36
per woman to 2.8.in 2050. contraception. P O P UMongolia 2.9 28 6 2.3 -0 3.5 4.3 1.5 112 26 7.6 2.9 28 4 55
Taiwan 23.4 8 7 0.1 1 23.5 21.0 0.9 27 3.7 3.9 1.1 14 12 68
EUROPE 741 11 11 0.0 2 746 726 1.0 27 6 2.3 1.6 16 17 70
EUROPEAN UNION 507 10 10 0.0 1 517 514 1.0 25 4 2.4 1.5 16 18 71
NORTHERN EUROPE 102 12 9 0.3 2 111 119 1.2 17 3 2.3 1.8 18 17 72
Channel Islands 0.2 11 8 0.3 0 0.2 0.2 1.1 24 2.9 2.1 1.7 15 16 72
Denmark 5.6 10 9 0.1 5 5.9 6.1 1.1 14 3.0 2.0 1.7 17 18 73
Estonia 1.3 11 12 -0.1 -5 1.2 1.2 0.9 22 2.1 2.2 1.5 16 18 70
Finland 5.5 11 9 0.1 3 5.8 6.1 1.1 13 1.8 1.8 1.8 16 19 70
Iceland 0.3 13 7 0.7 5 0.4 0.4 1.3 13 1.8 2.8 1.9 21 13 74
Ireland 4.6 15 7 0.9 -7 5.2 5.7 1.2 20 3.3 3.9 2.0 22 12 71
Latvia 2.0 10 14 -0.4 -12 1.6 1.4 0.7 20 3.6 2.0 1.5 14 19 70
Lithuania 2.9 10 14 -0.4 -6 2.7 2.5 0.9 23 3.6 2.4 1.6 15 18 71
Norway 5.1 12 8 0.4 8 6.0 6.7 1.3 11 2.5 2.5 1.8 18 16 74
Sweden 9.7 12 9 0.2 2 10.8 11.4 1.2 11 2.3 1.9 1.9 17 19 74
United Kingdom 64.5 12 9 0.3 3 71.1 77.0 1.2 13 3.9 2.4 1.9 18 17 72
WESTERN EUROPE 190 10 10 0.0 3 196 198 1.0 20 3 2.2 1.7 16 19 71
Austria 8.5 9 9 0.0 6 9.0 9.4 1.1 26 3.1 2.3 1.4 14 18 70
Belgium 11.2 11 10 0.2 4 11.9 12.6 1.1 21 3.8 2.3 1.8 17 18 71
France 64.1 12 9 0.3 1 68.3 72.1 1.1 18 3.6 2.5 2.0 18 18 72
Germany 80.9 8 11 -0.2 5 80.0 76.2 0.9 22 3.3 2.1 1.4 13 21 71
Liechtenstein 0.04 10 6 0.4 4 0.04 0.04 1.2 — 3.3 — 1.5 16 15 —
Luxembourg 0.6 11 7 0.4 19 0.7 0.7 1.3 25 3.5 2.0 1.6 17 14 70
Monaco 0.04 6 7 -0.1 23 0.04 0.05 1.4 — — — 1.4 13 24 —
Netherlands 16.9 10 8 0.2 1 17.6 17.9 1.1 13 3.8 2.6 1.7 17 17 74
Switzerland 8.2 10 8 0.2 6 8.7 9.0 1.1 15 3.6 2.1 1.5 15 18 73
EASTERN EUROPE 294 12 13 -0.1 1 285 262 0.9 29 8 2.1 1.5 15 14 69
Belarus 9.5 13 13 -0.1 1 9.3 9.0 1.0 23 4.3 2.3 1.7 15 14 71
Bulgaria 7.2 9 14 -0.5 -0 6.5 5.7 0.8 27 7.3 2.2 1.5 14 20 71
Czech Republic 10.5 10 10 0.0 -0 10.8 11.1 1.1 20 2.5 1.9 1.5 15 17 70
Hungary 9.9 9 13 -0.4 1 9.7 9.4 0.9 36 5.1 2.0 1.3 14 17 70
Moldova 4.1 11 11 0.0 -0 3.4 2.1 0.5 47 14 2.6 1.2 16 10 65
Poland 38.5 10 10 -0.1 -0 37.5 34.8 0.9 37 4.6 2.3 1.2 15 14 70
Romania 20.0 10 12 -0.3 -0 18.7 16.5 0.8 49 8.5 2.9 1.3 16 16 68
Russiag 143.7 13 13 0.0 2 143.5 134.1 0.9 28 10.3 2.0 1.7 16 13 69
Slovakia 5.4 10 10 0.1 0 5.4 5.0 0.9 26 5.5 2.4 1.3 15 14 70
Ukraineg 42.9 11 15 -0.4 1 40.1 33.8 0.7 22 7.0 2.1 1.5 15 15 71
SOUTHERN EUROPE 154 9 10 -0.1 -1 153 147 1.0 36 4 2.6 1.3 15 19 70
Albania 3.0 12 7 0.5 -6 3.1 2.9 1.0 98 14.4 5.1 1.8 19 12 67
Andorra 0.1 8 3 0.5 -7 0.1 0.1 0.9 — 3.4 — 1.1 15 13 —
Bosnia-Herzegovina 3.8 8 9 -0.1 0 3.7 3.3 0.9 70 5 2.7 1.3 16 16 66
Croatia 4.2 10 13 -0.3 -1 4.0 3.6 0.8 34 3.6 1.8 1.6 15 19 68
Greece 11.0 9 11 -0.1 -4 10.7 9.4 0.9 30 2.9 2.4 1.3 15 20 71
Italy 61.3 9 10 -0.1 3 63.4 63.5 1.0 29 3.2 2.4 1.4 14 21 71
Kosovoh 1.8 15 4 1.1 -2 2.0 1.9 1.0 — 11 — 2.0 28 7 —
Macedoniai 2.1 11 9 0.2 1 2.0 1.8 0.9 88 10 3.0 1.5 17 12 66
Malta 0.4 10 8 0.2 7 0.4 0.4 0.9 28 5.7 2.0 1.4 15 16 71
Montenegro 0.6 12 10 0.3 -3 0.7 0.8 1.2 40 5.2 2.7 1.7 19 13 70
Portugal 10.4 8 10 -0.2 -4 9.9 9.1 0.9 58 3.0 3.0 1.2 15 19 67
San Marino 0.03 10 7 0.3 5 0.04 0.04 1.1 — 6.4 2.2 1.5 15 18 —
Serbia 7.1 9 14 -0.5 0 6.7 6.4 0.9 59 5.4 2.4 1.4 14 18 68
Slovenia 2.1 10 9 0.1 -0 2.1 2.1 1.0 25 2.9 2.2 1.5 15 17 69
Spain 46.5 9 8 0.1 -4 44.5 42.3 0.9 21 3.1 2.9 1.3 15 18 72
OCEANIA 39 18 7 1.1 6 48 60 1.6 43 21 3.4 2.4 24 11 66
Australia 23.5 13 6 0.7 10 28.6 36.4 1.5 18 3.3 2.9 1.9 19 14 71
Federated States of Micronesia 0.1 24 5 1.9 -19 0.1 0.1 0.9 63 29 6.9 3.5 34 4 62
Fiji 0.9 21 8 1.4 -6 0.9 1.0 1.2 44 15 4.5 2.5 29 5 60
French Polynesia 0.3 17 6 1.1 -6 0.3 0.3 1.2 76 5.1 5.1 2.1 25 6 60
Guam 0.2 22 5 1.7 -6 0.2 0.3 1.6 45 13.4 4.4 3.1 27 7 66
POPULATION, HEALTH, AND ENVIRONMENT DATA AND ESTIMATES FOR THE COUNTRIES AND REGIONS OF THE WORLD
© 2014 Population Reference Bureau See notes on page 18 2014 WORLD POPULATION DATA SHEET 12
POPULATION, HEALTH, AND ENVIRONMENT DATA AND ESTIMATES FOR THE
Population
mid-2014
(millions)
Births
per 1,000
Population
Deaths
per 1,000
Population
Rate of
Natural
Increase
(%)
Net
Migration
Rate
per 1,000
Population
Projected
Population (millions)
2050
Population
as a
Multiple of
2014
Infant
Mortality Ratea
Total
Fertility Rateb Percent of Population
mid-2030 mid-2050 1970 2013* 1970 2013* Ages 15 Ages 65+
Both Sex
1970
WORLD 7,238 20 8 1.2 — 8,444 9,683 1.3 89 38 4.7 2.5 26 8 58
MORE DEVELOPED 1,249 11 10 0.1 2 1,292 1,309 1.0 24 5 2.3 1.6 16 17 71
LESS DEVELOPED 5,989 22 7 1.4 0 7,152 8,375 1.4 100 42 5.7 2.6 29 6 55
LESS DEVELOPED (EXCL. CHINA) 4,625 24 7 1.7 -1 5,752 7,063 1.5 119 46 5.8 3.0 32 5 51
LEAST DEVELOPED 916 33 9 2.4 -1 1,290 1,855 2.0 150 64 5.7 4.3 40 4 44
AFRICA 1,136 36 10 2.5 0 1,637 2,428 2.1 139 62 6.7 4.7 41 4 45
SUB-SAHARAN AFRICA 920 37 11 2.6 0 1,360 2,081 2.3 138 67 6.7 5.1 43 3 44
NORTHERN AFRICA 217 28 7 2.2 -2 277 347 1.6 140 33 6.5 3.4 32 5 52
Algeria 39.1 25 6 1.9 -1 49.9 60.3 1.5 128 26 7.6 2.9 28 6 50
Egypt 87.9 32 6 2.6 -1 113.2 146.0 1.7 169 29 5.9 3.5 32 6 52
Libya 6.3 21 4 1.7 -7 7.5 8.4 1.3 104 14 7.9 2.4 29 5 56
Morocco 33.3 22 6 1.5 -3 38.2 41.4 1.2 118 29 6.7 2.6 28 5 53
Sudan 38.8 34 8 2.5 -4 55.1 77.1 2.0 97 55 6.9 5.2 41 3 52
Tunisia 11.0 19 6 1.3 -3 12.4 13.1 1.2 158 16 6.4 2.2 24 7 51
Western Saharae 0.6 21 6 1.5 17 0.8 0.8 1.4 168 37 6.6 2.4 27 3 42
WESTERN AFRICA 339 39 12 2.7 -1 507 784 2.3 152 66 6.7 5.4 44 3 41
Benin 10.3 37 10 2.7 -0 15.0 21.5 2.1 155 69 6.8 4.9 43 3 42
Burkina Faso 17.9 43 11 3.1 -2 28.4 46.6 2.6 163 70 6.6 5.9 46 2 39
Cape Verde 0.5 22 5 1.7 -7 0.6 0.7 1.5 109 24 6.9 2.6 30 5 52
Côte d'Ivoire 20.8 37 14 2.3 1 29.2 42.3 2.0 156 75 7.9 4.9 41 3 44
Gambia 1.9 41 10 3.1 -2 3.1 4.9 2.5 120 55 6.1 5.6 46 2 38
Ghana 27.0 34 9 2.5 -1 37.7 52.6 1.9 110 53 7.0 4.3 38 5 49
Guinea 11.6 38 12 2.7 -0 16.9 23.9 2.1 190 67 6.2 5.1 42 3 37
Guinea-Bissau 1.7 38 13 2.5 -1 2.5 3.5 2.0 144 94 6.1 5.0 41 3 44
Liberia 4.4 35 9 2.6 -1 6.4 9.4 2.1 186 54 6.7 4.7 43 3 39
Mali 15.9 42 13 2.9 -2 26.3 45.6 2.9 184 58 6.9 6.1 48 3 32
Mauritania 4.0 34 9 2.6 -1 5.6 7.9 2.0 110 72 6.8 4.1 40 3 49
Niger 18.2 50 11 3.9 -0 33.8 68.0 3.7 154 54 7.4 7.6 50 3 36
Nigeria 177.5 39 13 2.5 -0 261.7 396.5 2.2 153 69 6.5 5.6 44 3 41
Senegal 13.9 40 8 3.2 -1 21.8 35.1 2.5 111 43 7.3 5.3 44 3 39
Sierra Leone 6.3 38 17 2.1 -1 8.2 10.5 1.7 197 92 6.7 4.9 42 3 35
Togo 7.0 37 11 2.6 -0 10.0 14.5 2.1 120 66 7.1 4.7 42 3 47
EASTERN AFRICA 378 36 9 2.7 0 561 851 2.3 134 57 7.1 4.9 44 3 45
Burundi 10.5 45 13 3.2 -0 16.4 26.7 2.5 139 87 7.3 6.1 45 2 44
Comoros 0.7 34 9 2.5 -3 1.0 1.3 1.8 134 36 7.1 4.3 42 3 48
Djibouti 0.9 28 9 1.9 -4 1.1 1.2 1.4 112 55 6.8 3.4 34 4 49
Eritrea 6.5 33 7 2.6 2 9.8 14.3 2.2 151 42 6.7 4.7 43 2 41
Ethiopia 95.9 28 8 2.1 -0 130.5 165.1 1.7 144 50 7.0 4.1 43 3 43
Kenya 43.2 34 9 2.6 -0 60.0 81.3 1.9 98 47 8.1 4.3 42 3 52
Madagascar 22.4 34 7 2.7 -0 34.3 52.8 2.4 139 42 7.3 4.4 42 3 45
Malawi 16.8 40 12 2.9 0 26.0 41.2 2.4 175 66 7.3 5.5 45 3 41
Mauritius 1.3 11 8 0.3 -0 1.3 1.2 1.0 66 12.1 3.8 1.4 21 8 63
Mayotte 0.2 31 3 2.8 -5 0.3 0.5 2.1 53 4 7.9 4.1 45 2 62
Mozambique 25.1 43 13 2.9 0 38.4 63.5 2.5 165 85 6.6 5.7 45 3 39
Reunion 0.9 17 5 1.2 -5 1.0 1.2 1.4 53 7 4.8 2.4 24 9 63
Rwanda 11.1 31 8 2.3 -1 15.8 21.0 1.9 136 49 8.2 4.0 41 3 44
Seychelles 0.1 19 7 1.1 2 0.1 0.1 1.1 54 11.4 5.8 2.4 22 8 66
Somalia 10.8 44 12 3.2 -3 16.9 27.1 2.5 154 80 7.2 6.6 48 3 41
South Sudan 11.7 36 12 2.4 16 17.3 39.3 3.3 187 78 6.9 7.0 42 3 36
per woman to 2.8.in 2050. contraception. P O P UItaly 61.3 9 10 -0.1 3 63.4 63.5 1.0 29 3.2 2.4 1.4 14 21 71
Kosovoh 1.8 15 4 1.1 -2 2.0 1.9 1.0 — 11 — 2.0 28 7 —
Macedoniai 2.1 11 9 0.2 1 2.0 1.8 0.9 88 10 3.0 1.5 17 12 66
Malta 0.4 10 8 0.2 7 0.4 0.4 0.9 28 5.7 2.0 1.4 15 16 71
Montenegro 0.6 12 10 0.3 -3 0.7 0.8 1.2 40 5.2 2.7 1.7 19 13 70
Portugal 10.4 8 10 -0.2 -4 9.9 9.1 0.9 58 3.0 3.0 1.2 15 19 67
San Marino 0.03 10 7 0.3 5 0.04 0.04 1.1 — 6.4 2.2 1.5 15 18 —
Serbia 7.1 9 14 -0.5 0 6.7 6.4 0.9 59 5.4 2.4 1.4 14 18 68
Slovenia 2.1 10 9 0.1 -0 2.1 2.1 1.0 25 2.9 2.2 1.5 15 17 69
Spain 46.5 9 8 0.1 -4 44.5 42.3 0.9 21 3.1 2.9 1.3 15 18 72
OCEANIA 39 18 7 1.1 6 48 60 1.6 43 21 3.4 2.4 24 11 66
Australia 23.5 13 6 0.7 10 28.6 36.4 1.5 18 3.3 2.9 1.9 19 14 71
Federated States of Micronesia 0.1 24 5 1.9 -19 0.1 0.1 0.9 63 29 6.9 3.5 34 4 62
Fiji 0.9 21 8 1.4 -6 0.9 1.0 1.2 44 15 4.5 2.5 29 5 60
French Polynesia 0.3 17 6 1.1 -6 0.3 0.3 1.2 76 5.1 5.1 2.1 25 6 60
Guam 0.2 22 5 1.7 -6 0.2 0.3 1.6 45 13.4 4.4 3.1 27 7 66
Kiribati 0.1 30 9 2.1 -1 0.2 0.2 1.9 114 45 6.1 3.8 35 4 51
Marshall Islands 0.1 30 4 2.5 -17 0.1 0.1 1.3 — 26 — 4.1 40 2 —
Nauru 0.01 36 8 2.9 -9 0.1 0.1 1.6 — 39 — 4.3 37 1 —
New Caledonia 0.3 17 5 1.2 4 0.3 0.3 1.3 59 5 5.3 2.2 24 8 62
New Zealand 4.3 13 7 0.7 5 4.9 5.5 1.3 17 4.4 3.2 2.0 20 14 71
Palau 0.02 14 9 0.5 0 0.1 0.1 1.0 — 11 — 1.7 20 6 —
Papua New Guinea 7.6 33 10 2.3 0 10.5 14.2 1.9 106 48 6.2 4.3 39 3 46
Samoa 0.2 29 5 2.4 -24 0.2 0.2 1.3 73 16 7.2 4.7 39 5 55
Solomon Islands 0.6 31 5 2.6 0 0.9 0.4 0.6 98 26 6.9 4.1 39 3 54
Tonga 0.1 27 7 2.0 -19 0.1 0.1 1.2 40 17 5.9 3.9 37 6 65
Tuvalu 0.01 25 9 1.6 0 0.1 0.1 1.8 — 10 — 3.2 33 5 —
Vanuatu 0.3 29 5 2.4 0 0.4 0.5 1.8 108 21 6.3 4.4 39 4 52
Population
(millions)
Birth Rate Death Rate Natural Increase
(%)
Migration Rate mid-2030 mid-2050 Population
Change
1970 2013* 1970 2013* 15 65+ Both, 197
Population (millions) Infant Mortality Total Fertility Rate % of Population
POPULATION, HEALTH, AND ENVIRONMENT DATA AND ESTIMATES FOR THE COUNTRIES AND REGIONS OF THE WORLD
© 2014 Population Reference Bureau See notes on page 18 2014 WORLD POPULATION DATA SHEET 13
ENVIRONMENT DATA AND ESTIMATES FOR THE COUNTRIES AND REGIONS OF THE WORLD
Infant
Mortality Ratea
Total
Fertility Rateb Percent of Population
Life Expectancy at Birth (years)
Percent
Urban
Percent of Married Women
15-49 Using Contraceptionc
Population
per Square
Kilometer
GNI PPP
per Capita
($US)
2013d
Carbon Emissions
(million tons)
1990 2012970 2013* 1970 2013* Ages 15 Ages 65+
Both Sexes
1970
Both Sexes
2013*
Males
2013*
Females
2013*
All
Methods
Modern
Methods
89 38 4.7 2.5 26 8 58 71 69 73 53 63 56 53 14,210 6,127 9,667
24 5 2.3 1.6 16 17 71 79 75 82 77 70 60 23 37,470 3,883 3,606
00 42 5.7 2.6 29 6 55 69 67 71 48 61 55 72 8,920 2,029 5,510
19 46 5.8 3.0 32 5 51 67 65 69 46 54 46 63 8,060 1,358 2,884
50 64 5.7 4.3 40 4 44 61 60 62 28 36 30 44 1,970 20 62
39 62 6.7 4.7 41 4 45 59 58 60 40 34 28 37 4,470 188 331
38 67 6.7 5.1 43 3 44 57 56 58 37 29 23 41 3,220 125 193
40 33 6.5 3.4 32 5 52 69 68 71 51 53 47 28 9,600 64 139
28 26 7.6 2.9 28 6 50 71 69 73 73 61 52 16 12,990 21.5 37.7
69 29 5.9 3.5 32 6 52 71 69 72 43 60 58 88 10,850 20.7 58.7
04 14 7.9 2.4 29 5 56 75 73 77 78 42 20 4 28,110 10.0 16.7
18 29 6.7 2.6 28 5 53 71 69 73 59 67 57 75 7,000 6.4 14.3
97 55 6.9 5.2 41 3 52 62 60 64 33 9 — 21 2,370 1.5 3.9
58 16 6.4 2.2 24 7 51 75 73 77 66 63 50 67 10,960 3.6 7.5
68 37 6.6 2.4 27 3 42 68 66 70 82 — — 2 — 0.0 0.0
52 66 6.7 5.4 44 3 41 55 54 55 45 17 11 55 3,930 18 33
55 69 6.8 4.9 43 3 42 59 58 61 45 13 7 91 1,780 0.2 1.5
63 70 6.6 5.9 46 2 39 56 56 57 27 16 15 65 1,560 0.2 0.5
09 24 6.9 2.6 30 5 52 75 71 79 62 61 57 126 6,220 0.0 0.1
56 75 7.9 4.9 41 3 44 51 50 51 53 18 12 65 2,900 1.6 1.7
20 55 6.1 5.6 46 2 38 59 57 60 57 9 8 169 1,620 0.1 0.1
10 53 7.0 4.3 38 5 49 61 60 62 51 35 23 113 3,880 1.1 2.5
90 67 6.2 5.1 42 3 37 56 55 57 36 6 3 47 1,160 0.3 0.3
44 94 6.1 5.0 41 3 44 54 53 56 44 14 10 48 1,240 0.1 0.1
86 54 6.7 4.7 43 3 39 60 59 61 47 20 19 39 790 0.1 0.2
84 58 6.9 6.1 48 3 32 55 55 54 35 10 10 13 1,540 0.1 0.2
10 72 6.8 4.1 40 3 49 62 60 63 41 9 8 4 2,850 0.7 0.6
54 54 7.4 7.6 50 3 36 58 58 58 22 14 8 14 910 0.2 0.4
53 69 6.5 5.6 44 3 41 52 52 53 50 15 9 192 5,600 12.4 22.2
11 43 7.3 5.3 44 3 39 63 62 65 47 18 16 71 2,240 0.9 2.0
97 92 6.7 4.9 42 3 35 45 45 46 41 17 15 88 1,750 0.1 0.2
20 66 7.1 4.7 42 3 47 56 56 57 38 15 13 123 1,180 0.2 0.4
34 57 7.1 4.9 44 3 45 60 59 62 24 39 31 54 1,570 11 17
39 87 7.3 6.1 45 2 44 54 52 56 10 22 18 377 820 0.1 0.1
34 36 7.1 4.3 42 3 48 61 59 61 28 19 13 335 1,560 0.0 0.0
12 55 6.8 3.4 34 4 49 62 60 63 77 19 18 38 — 0.1 0.2
51 42 6.7 4.7 43 2 41 63 60 65 21 8 7 56 1,180 — 0.1
44 50 7.0 4.1 43 3 43 63 62 65 17 42 40 87 1,350 0.8 1.8
98 47 8.1 4.3 42 3 52 62 60 64 24 46 39 74 2,250 1.6 3.5
39 42 7.3 4.4 42 3 45 65 63 66 33 40 33 38 1,350 0.3 0.6
75 66 7.3 5.5 45 3 41 55 55 55 16 46 42 142 760 0.2 0.4
66 12.1 3.8 1.4 21 8 63 74 70 77 42 76 39 618 17,220 0.4 1.2
53 4 7.9 4.1 45 2 62 79 76 82 50 — — 600 — — —
65 85 6.6 5.7 45 3 39 53 51 55 31 12 11 31 1,040 0.3 0.8
53 7 4.8 2.4 24 9 63 80 77 83 94 67 64 339 — 0.4 1.2
36 49 8.2 4.0 41 3 44 65 63 66 17 52 45 421 1,430 0.2 0.2
54 11.4 5.8 2.4 22 8 66 73 69 78 54 — — 198 23,270 0.0 0.2
54 80 7.2 6.6 48 3 41 55 53 57 38 15 1 17 — 0.0 0.2
87 78 6.9 7.0 42 3 36 55 54 56 17 4 1 18 2,190 — —
ASIA
ASIA (Excl. China
WESTERN ASIA
Armenia
Azerbaijan
Bahrain
Cyprus
Georgia
Iraq
Israel
Jordan
Kuwait
Lebanon
Oman
Palestinian Terri
Qatar
Saudi Arabia
Syria
Turkey
United Arab Em
Yemen
SOUTH CENTRA
CENTRAL ASIA
Kazakhstan
Kyrgyzstan
Tajikistan
Turkmenistan
Uzbekistan
SOUTH ASIA
Afghanistan
Bangladesh
Bhutan
India
Iran
Maldives
Nepal
Pakistan
Sri Lanka
SOUTHEAST ASI
Brunei
Cambodia
Indonesia
Laos
Malaysia
Myanmar
Philippines
Singapore
Thailand
Timor-Leste
P O P U L A T I O N R E F E R E N C E B
POPULATION, HEALTH, AND ENVIRONMENT DATA AND ESTIMATES
Population
mid-2014
(millions)
Births
per 1,000
Population
Deaths
per 1,000
Population
Rate of
Natural
Increase
(%)
Net
Migration
Rate
per 1,000
Population
Projected
Population (millions)
2050
Population
as a
Multiple of
2014
Infant
Mortality Ratea
Total
Fertility Rateb Percent of Popu
mid-2030 mid-2050 1970 2013* 1970 2013* Ages 15 Ag
WORLD 7,238 20 8 1.2 — 8,444 9,683 1.3 89 38 4.7 2.5 26
MORE DEVELOPED 1,249 11 10 0.1 2 1,292 1,309 1.0 24 5 2.3 1.6 16
LESS DEVELOPED 5,989 22 7 1.4 0 7,152 8,375 1.4 100 42 5.7 2.6 29
LESS DEVELOPED (EXCL. CHINA) 4,625 24 7 1.7 -1 5,752 7,063 1.5 119 46 5.8 3.0 32
LEAST DEVELOPED 916 33 9 2.4 -1 1,290 1,855 2.0 150 64 5.7 4.3 40
AFRICA 1,136 36 10 2.5 0 1,637 2,428 2.1 139 62 6.7 4.7 41
SUB-SAHARAN AFRICA 920 37 11 2.6 0 1,360 2,081 2.3 138 67 6.7 5.1 43
NORTHERN AFRICA 217 28 7 2.2 -2 277 347 1.6 140 33 6.5 3.4 32
Algeria 39.1 25 6 1.9 -1 49.9 60.3 1.5 128 26 7.6 2.9 28
Egypt 87.9 32 6 2.6 -1 113.2 146.0 1.7 169 29 5.9 3.5 32
Libya 6.3 21 4 1.7 -7 7.5 8.4 1.3 104 14 7.9 2.4 29
Morocco 33.3 22 6 1.5 -3 38.2 41.4 1.2 118 29 6.7 2.6 28
Sudan 38.8 34 8 2.5 -4 55.1 77.1 2.0 97 55 6.9 5.2 41
Tunisia 11.0 19 6 1.3 -3 12.4 13.1 1.2 158 16 6.4 2.2 24
Western Saharae 0.6 21 6 1.5 17 0.8 0.8 1.4 168 37 6.6 2.4 27
WESTERN AFRICA 339 39 12 2.7 -1 507 784 2.3 152 66 6.7 5.4 44
Benin 10.3 37 10 2.7 -0 15.0 21.5 2.1 155 69 6.8 4.9 43
Burkina Faso 17.9 43 11 3.1 -2 28.4 46.6 2.6 163 70 6.6 5.9 46
Cape Verde 0.5 22 5 1.7 -7 0.6 0.7 1.5 109 24 6.9 2.6 30
Côte d'Ivoire 20.8 37 14 2.3 1 29.2 42.3 2.0 156 75 7.9 4.9 41
Gambia 1.9 41 10 3.1 -2 3.1 4.9 2.5 120 55 6.1 5.6 46
Ghana 27.0 34 9 2.5 -1 37.7 52.6 1.9 110 53 7.0 4.3 38
Guinea 11.6 38 12 2.7 -0 16.9 23.9 2.1 190 67 6.2 5.1 42
Guinea-Bissau 1.7 38 13 2.5 -1 2.5 3.5 2.0 144 94 6.1 5.0 41
Liberia 4.4 35 9 2.6 -1 6.4 9.4 2.1 186 54 6.7 4.7 43
Mali 15.9 42 13 2.9 -2 26.3 45.6 2.9 184 58 6.9 6.1 48
Mauritania 4.0 34 9 2.6 -1 5.6 7.9 2.0 110 72 6.8 4.1 40
Niger 18.2 50 11 3.9 -0 33.8 68.0 3.7 154 54 7.4 7.6 50
Nigeria 177.5 39 13 2.5 -0 261.7 396.5 2.2 153 69 6.5 5.6 44
Senegal 13.9 40 8 3.2 -1 21.8 35.1 2.5 111 43 7.3 5.3 44
Sierra Leone 6.3 38 17 2.1 -1 8.2 10.5 1.7 197 92 6.7 4.9 42
Togo 7.0 37 11 2.6 -0 10.0 14.5 2.1 120 66 7.1 4.7 42
EASTERN AFRICA 378 36 9 2.7 0 561 851 2.3 134 57 7.1 4.9 44
Burundi 10.5 45 13 3.2 -0 16.4 26.7 2.5 139 87 7.3 6.1 45
Comoros 0.7 34 9 2.5 -3 1.0 1.3 1.8 134 36 7.1 4.3 42
Djibouti 0.9 28 9 1.9 -4 1.1 1.2 1.4 112 55 6.8 3.4 34
Eritrea 6.5 33 7 2.6 2 9.8 14.3 2.2 151 42 6.7 4.7 43
Ethiopia 95.9 28 8 2.1 -0 130.5 165.1 1.7 144 50 7.0 4.1 43
Kenya 43.2 34 9 2.6 -0 60.0 81.3 1.9 98 47 8.1 4.3 42
Madagascar 22.4 34 7 2.7 -0 34.3 52.8 2.4 139 42 7.3 4.4 42
Malawi 16.8 40 12 2.9 0 26.0 41.2 2.4 175 66 7.3 5.5 45
Mauritius 1.3 11 8 0.3 -0 1.3 1.2 1.0 66 12.1 3.8 1.4 21
Mayotte 0.2 31 3 2.8 -5 0.3 0.5 2.1 53 4 7.9 4.1 45
Mozambique 25.1 43 13 2.9 0 38.4 63.5 2.5 165 85 6.6 5.7 45
Reunion 0.9 17 5 1.2 -5 1.0 1.2 1.4 53 7 4.8 2.4 24
Rwanda 11.1 31 8 2.3 -1 15.8 21.0 1.9 136 49 8.2 4.0 41
Seychelles 0.1 19 7 1.1 2 0.1 0.1 1.1 54 11.4 5.8 2.4 22
Somalia 10.8 44 12 3.2 -3 16.9 27.1 2.5 154 80 7.2 6.6 48
South Sudan 11.7 36 12 2.4 16 17.3 39.3 3.3 187 78 6.9 7.0 42
per woman to 2.8.in 2050. contraception. P O
POPULATION, HEALTH, AND ENVIRONMENT DATA AND ESTIMATES FOR THE COUNTRIES AND REGIONS OF THE WORLD
© 2014 Population Reference Bureau See notes on page 18 2014 WORLD POPULATION DATA SHEET 14
ENVIRONMENT DATA AND ESTIMATES FOR THE COUNTRIES AND REGIONS OF THE WORLD
Infant
Mortality Ratea
Total
Fertility Rateb Percent of Population
Life Expectancy at Birth (years)
Percent
Urban
Percent of Married Women
15-49 Using Contraceptionc
Population
per Square
Kilometer
GNI PPP
per Capita
($US)
2013d
Carbon Emissions
(million tons)
1990 2012970 2013* 1970 2013* Ages 15 Ages 65+
Both Sexes
1970
Both Sexes
2013*
Males
2013*
Females
2013*
All
Methods
Modern
Methods
89 38 4.7 2.5 26 8 58 71 69 73 53 63 56 53 14,210 6,127 9,667
24 5 2.3 1.6 16 17 71 79 75 82 77 70 60 23 37,470 3,883 3,606
00 42 5.7 2.6 29 6 55 69 67 71 48 61 55 72 8,920 2,029 5,510
19 46 5.8 3.0 32 5 51 67 65 69 46 54 46 63 8,060 1,358 2,884
50 64 5.7 4.3 40 4 44 61 60 62 28 36 30 44 1,970 20 62
39 62 6.7 4.7 41 4 45 59 58 60 40 34 28 37 4,470 188 331
38 67 6.7 5.1 43 3 44 57 56 58 37 29 23 41 3,220 125 193
40 33 6.5 3.4 32 5 52 69 68 71 51 53 47 28 9,600 64 139
28 26 7.6 2.9 28 6 50 71 69 73 73 61 52 16 12,990 21.5 37.7
69 29 5.9 3.5 32 6 52 71 69 72 43 60 58 88 10,850 20.7 58.7
04 14 7.9 2.4 29 5 56 75 73 77 78 42 20 4 28,110 10.0 16.7
18 29 6.7 2.6 28 5 53 71 69 73 59 67 57 75 7,000 6.4 14.3
97 55 6.9 5.2 41 3 52 62 60 64 33 9 — 21 2,370 1.5 3.9
58 16 6.4 2.2 24 7 51 75 73 77 66 63 50 67 10,960 3.6 7.5
68 37 6.6 2.4 27 3 42 68 66 70 82 — — 2 — 0.0 0.0
52 66 6.7 5.4 44 3 41 55 54 55 45 17 11 55 3,930 18 33
55 69 6.8 4.9 43 3 42 59 58 61 45 13 7 91 1,780 0.2 1.5
63 70 6.6 5.9 46 2 39 56 56 57 27 16 15 65 1,560 0.2 0.5
09 24 6.9 2.6 30 5 52 75 71 79 62 61 57 126 6,220 0.0 0.1
56 75 7.9 4.9 41 3 44 51 50 51 53 18 12 65 2,900 1.6 1.7
20 55 6.1 5.6 46 2 38 59 57 60 57 9 8 169 1,620 0.1 0.1
10 53 7.0 4.3 38 5 49 61 60 62 51 35 23 113 3,880 1.1 2.5
90 67 6.2 5.1 42 3 37 56 55 57 36 6 3 47 1,160 0.3 0.3
44 94 6.1 5.0 41 3 44 54 53 56 44 14 10 48 1,240 0.1 0.1
86 54 6.7 4.7 43 3 39 60 59 61 47 20 19 39 790 0.1 0.2
84 58 6.9 6.1 48 3 32 55 55 54 35 10 10 13 1,540 0.1 0.2
10 72 6.8 4.1 40 3 49 62 60 63 41 9 8 4 2,850 0.7 0.6
54 54 7.4 7.6 50 3 36 58 58 58 22 14 8 14 910 0.2 0.4
53 69 6.5 5.6 44 3 41 52 52 53 50 15 9 192 5,600 12.4 22.2
11 43 7.3 5.3 44 3 39 63 62 65 47 18 16 71 2,240 0.9 2.0
97 92 6.7 4.9 42 3 35 45 45 46 41 17 15 88 1,750 0.1 0.2
20 66 7.1 4.7 42 3 47 56 56 57 38 15 13 123 1,180 0.2 0.4
34 57 7.1 4.9 44 3 45 60 59 62 24 39 31 54 1,570 11 17
39 87 7.3 6.1 45 2 44 54 52 56 10 22 18 377 820 0.1 0.1
34 36 7.1 4.3 42 3 48 61 59 61 28 19 13 335 1,560 0.0 0.0
12 55 6.8 3.4 34 4 49 62 60 63 77 19 18 38 — 0.1 0.2
51 42 6.7 4.7 43 2 41 63 60 65 21 8 7 56 1,180 — 0.1
44 50 7.0 4.1 43 3 43 63 62 65 17 42 40 87 1,350 0.8 1.8
98 47 8.1 4.3 42 3 52 62 60 64 24 46 39 74 2,250 1.6 3.5
39 42 7.3 4.4 42 3 45 65 63 66 33 40 33 38 1,350 0.3 0.6
75 66 7.3 5.5 45 3 41 55 55 55 16 46 42 142 760 0.2 0.4
66 12.1 3.8 1.4 21 8 63 74 70 77 42 76 39 618 17,220 0.4 1.2
53 4 7.9 4.1 45 2 62 79 76 82 50 — — 600 — — —
65 85 6.6 5.7 45 3 39 53 51 55 31 12 11 31 1,040 0.3 0.8
53 7 4.8 2.4 24 9 63 80 77 83 94 67 64 339 — 0.4 1.2
36 49 8.2 4.0 41 3 44 65 63 66 17 52 45 421 1,430 0.2 0.2
54 11.4 5.8 2.4 22 8 66 73 69 78 54 — — 198 23,270 0.0 0.2
54 80 7.2 6.6 48 3 41 55 53 57 38 15 1 17 — 0.0 0.2
87 78 6.9 7.0 42 3 36 55 54 56 17 4 1 18 2,190 — —
ASIA
ASIA (Excl. China
WESTERN ASIA
Armenia
Azerbaijan
Bahrain
Cyprus
Georgia
Iraq
Israel
Jordan
Kuwait
Lebanon
Oman
Palestinian Terri
Qatar
Saudi Arabia
Syria
Turkey
United Arab Em
Yemen
SOUTH CENTRA
CENTRAL ASIA
Kazakhstan
Kyrgyzstan
Tajikistan
Turkmenistan
Uzbekistan
SOUTH ASIA
Afghanistan
Bangladesh
Bhutan
India
Iran
Maldives
Nepal
Pakistan
Sri Lanka
SOUTHEAST ASI
Brunei
Cambodia
Indonesia
Laos
Malaysia
Myanmar
Philippines
Singapore
Thailand
Timor-Leste
P O P U L A T I O N R E F E R E N C E BEritrea 6.5 33 7 2.6 2 9.8 14.3 2.2 151 42 6.7 4.7 43
Ethiopia 95.9 28 8 2.1 -0 130.5 165.1 1.7 144 50 7.0 4.1 43
Kenya 43.2 34 9 2.6 -0 60.0 81.3 1.9 98 47 8.1 4.3 42
Madagascar 22.4 34 7 2.7 -0 34.3 52.8 2.4 139 42 7.3 4.4 42
Malawi 16.8 40 12 2.9 0 26.0 41.2 2.4 175 66 7.3 5.5 45
Mauritius 1.3 11 8 0.3 -0 1.3 1.2 1.0 66 12.1 3.8 1.4 21
Mayotte 0.2 31 3 2.8 -5 0.3 0.5 2.1 53 4 7.9 4.1 45
Mozambique 25.1 43 13 2.9 0 38.4 63.5 2.5 165 85 6.6 5.7 45
Reunion 0.9 17 5 1.2 -5 1.0 1.2 1.4 53 7 4.8 2.4 24
Rwanda 11.1 31 8 2.3 -1 15.8 21.0 1.9 136 49 8.2 4.0 41
Seychelles 0.1 19 7 1.1 2 0.1 0.1 1.1 54 11.4 5.8 2.4 22
Somalia 10.8 44 12 3.2 -3 16.9 27.1 2.5 154 80 7.2 6.6 48
South Sudan 11.7 36 12 2.4 16 17.3 39.3 3.3 187 78 6.9 7.0 42
Tanzania 50.8 40 9 3.1 -1 79.4 129.4 2.5 124 49 6.8 5.3 45
Uganda 38.8 43 9 3.4 -1 63.4 104.1 2.7 113 57 7.1 5.9 48
Zambia 15.1 45 11 3.4 -1 26.1 49.2 3.3 112 66 7.4 6.0 47
Zimbabwe 14.7 33 9 2.4 6 21.5 30.2 2.1 86 37 7.4 3.8 40
MIDDLE AFRICA 142 45 15 3.0 -0 225 372 2.6 144 97 6.4 6.1 46
Angola 22.4 46 14 3.2 1 36.4 60.8 2.7 179 96 7.3 6.2 48
Cameroon 22.8 39 12 2.7 -1 34.5 54.3 2.4 127 62 6.2 5.1 43
Central African Republic 4.8 47 15 3.2 0 6.7 9.7 2.0 149 116 6.0 6.2 40
Chad 13.3 48 15 3.3 -2 21.8 37.4 2.8 153 96 6.5 6.6 49
Congo 4.6 38 10 2.8 -2 6.8 10.6 2.3 93 64 6.3 5.0 42
Congo, Dem. Rep. 71.2 46 16 3.0 -0 114.9 193.6 2.7 138 109 6.2 6.6 46
Equatorial Guinea 0.8 36 13 2.2 5 1.1 1.6 2.1 162 89 5.7 4.9 39
Gabon 1.7 32 9 2.3 1 2.4 3.3 1.9 124 43 5.1 4.1 38
Sao Tome and Principe 0.2 36 7 2.9 -2 0.3 0.4 2.2 82 44 6.5 4.3 42
SOUTHERN AFRICA 61 21 11 1.0 3 68 75 1.2 85 44 5.7 2.4 30
Botswana 2.0 24 17 0.7 2 2.3 2.8 1.4 97 32 6.6 2.6 34
Lesotho 1.9 30 21 0.9 -6 2.1 2.7 1.4 127 82 5.8 3.3 36
Namibia 2.3 30 7 2.2 -0 3.0 3.7 1.6 108 39 6.5 3.6 36
South Africa 53.7 20 11 1.0 3 58.7 64.1 1.2 80 42 5.6 2.3 29
Swaziland 1.3 30 14 1.6 -1 1.5 1.8 1.4 133 65 6.9 3.4 38
AMERICAS 972 16 7 0.9 0 1,106 1,217 1.3 68 15 4.0 2.1 24
NORTHERN AMERICA 353 12 8 0.4 3 396 444 1.3 21 5 2.3 1.8 19
Canada 35.5 11 7 0.4 8 41.5 48.4 1.4 19 4.8 2.2 1.6 16
United States 317.7 13 8 0.4 3 354.4 395.3 1.2 20 5.4 2.5 1.9 19
LATIN AMERICA AND THE CARIBBEAN 618 18 6 1.2 -1 710 773 1.3 86 18 5.3 2.2 27
CENTRAL AMERICA 165 21 6 1.5 -2 195 222 1.3 81 16 6.6 2.4 30
Belize 0.4 23 4 1.9 6 0.5 0.6 1.7 64 14 6.3 2.6 36
Costa Rica 4.8 15 4 1.1 2 5.6 6.1 1.3 61 8.7 4.9 1.8 24
El Salvador 6.4 20 7 1.4 -7 6.9 6.9 1.1 104 17 6.2 2.2 30
Guatemala 15.9 31 5 2.6 -1 22.6 31.3 2.0 109 23 6.2 3.8 40
Honduras 8.2 24 5 2.0 -1 10.2 11.7 1.4 112 24 7.3 2.8 35
Mexico 119.7 19 6 1.4 -2 137.5 150.8 1.3 75 13 6.7 2.2 28
Nicaragua 6.2 23 5 1.9 -6 7.5 8.4 1.4 105 17 6.9 2.5 33
Panama 3.9 20 5 1.5 2 4.8 5.6 1.4 53 14 5.2 2.5 28
CARIBBEAN 43 18 8 1.1 -4 47 49 1.1 77 33 4.7 2.3 26
Antigua and Barbuda 0.1 14 5 0.8 5 0.1 0.1 1.4 45 16 3.7 1.8 24
Bahamas 0.4 16 5 1.1 2 0.4 0.5 1.3 36 17 3.5 2.0 26
Barbados 0.3 12 8 0.4 1 0.3 0.3 1.1 46 10 3.1 1.8 20
Cuba 11.2 11 8 0.3 -4 10.7 9.3 0.8 45 4.6 4.0 1.7 17
Curacao 0.2 13 8 0.5 4 0.2 0.2 1.2 31 9.8 3.3 2.2 19
Dominica 0.1 13 8 0.5 -6 0.1 0.1 0.9 — 21 — 2.0 22
Dominican Republic 10.4 21 6 1.5 -3 12.0 13.2 1.3 102 25 6.2 2.5 31
Grenada 0.1 16 7 0.8 -2 0.1 0.1 0.9 49 9 4.6 2.0 27
Guadeloupe 0.4 13 7 0.6 -7 0.4 0.4 1.0 37 8.1 4.9 2.2 21
Haiti 10.8 28 9 1.9 -3 13.5 16.8 1.6 141 59 5.8 3.4 35
Jamaica 2.7 18 7 1.1 -5 2.9 2.7 1.0 48 21 5.5 2.3 27
51 42 6.7 4.7 43 2 41 63 60 65 21 8 7 56 1,180 — 0.1
44 50 7.0 4.1 43 3 43 63 62 65 17 42 40 87 1,350 0.8 1.8
98 47 8.1 4.3 42 3 52 62 60 64 24 46 39 74 2,250 1.6 3.5
39 42 7.3 4.4 42 3 45 65 63 66 33 40 33 38 1,350 0.3 0.6
75 66 7.3 5.5 45 3 41 55 55 55 16 46 42 142 760 0.2 0.4
66 12.1 3.8 1.4 21 8 63 74 70 77 42 76 39 618 17,220 0.4 1.2
53 4 7.9 4.1 45 2 62 79 76 82 50 — — 600 — — —
65 85 6.6 5.7 45 3 39 53 51 55 31 12 11 31 1,040 0.3 0.8
53 7 4.8 2.4 24 9 63 80 77 83 94 67 64 339 — 0.4 1.2
36 49 8.2 4.0 41 3 44 65 63 66 17 52 45 421 1,430 0.2 0.2
54 11.4 5.8 2.4 22 8 66 73 69 78 54 — — 198 23,270 0.0 0.2
54 80 7.2 6.6 48 3 41 55 53 57 38 15 1 17 — 0.0 0.2
87 78 6.9 7.0 42 3 36 55 54 56 17 4 1 18 2,190 — —
24 49 6.8 5.3 45 3 47 61 60 63 30 34 26 54 1,750 1.0 2.0
13 57 7.1 5.9 48 2 49 59 58 60 18 30 26 161 1,370 0.2 1.1
12 66 7.4 6.0 47 3 49 58 56 60 40 41 27 20 3,070 1.0 1.0
86 37 7.4 3.8 40 3 55 60 59 61 33 59 57 38 1,560 4.0 3.0
44 97 6.4 6.1 46 3 43 52 50 53 42 18 8 21 2,540 5 14
79 96 7.3 6.2 48 2 37 52 50 53 59 18 12 18 6,770 1.2 8.4
27 62 6.2 5.1 43 3 46 55 54 56 52 23 14 48 2,660 0.5 2.0
49 116 6.0 6.2 40 4 42 50 48 51 39 15 9 8 600 0.1 0.1
53 96 6.5 6.6 49 2 41 51 50 52 22 5 2 10 2,000 0.0 0.1
93 64 6.3 5.0 42 3 53 59 57 60 64 45 20 13 4,720 0.3 0.6
38 109 6.2 6.6 46 3 44 50 48 52 34 18 5 30 680 1.1 0.9
62 89 5.7 4.9 39 3 40 53 52 55 39 13 10 28 23,240 0.0 1.4
24 43 5.1 4.1 38 5 47 63 62 64 86 31 19 6 17,220 1.3 0.7
82 44 6.5 4.3 42 4 56 66 64 68 67 38 34 197 2,950 0.0 0.0
85 44 5.7 2.4 30 5 53 59 57 60 59 59 59 23 11,840 92 128
97 32 6.6 2.6 34 4 55 47 48 47 62 53 51 4 15,500 0.6 1.5
27 82 5.8 3.3 36 6 49 44 42 45 26 51 49 63 3,320 — 0.0
08 39 6.5 3.6 36 4 53 64 62 67 38 55 53 3 9,590 0.0 0.9
80 42 5.6 2.3 29 5 53 60 58 61 62 60 60 44 12,240 91.0 125.7
33 65 6.9 3.4 38 3 48 49 50 49 21 65 63 73 6,220 0.1 0.3
68 15 4.0 2.1 24 10 65 76 73 79 79 74 67 23 27,420 1,698 2,032
21 5 2.3 1.8 19 14 71 79 77 81 81 77 69 16 52,810 1,423 1,535
19 4.8 2.2 1.6 16 15 72 81 79 84 80 74 72 4 42,590 122.7 137.8
20 5.4 2.5 1.9 19 14 71 79 76 81 81 77 68 33 53,960 1,300.0 1,397.0
86 18 5.3 2.2 27 7 60 75 71 78 78 73 67 30 12,900 275 496
81 16 6.6 2.4 30 6 60 74 71 77 72 71 64 67 13,880 91 143
64 14 6.3 2.6 36 4 66 74 71 77 45 55 52 16 8,160 0.1 0.1
61 8.7 4.9 1.8 24 7 67 80 77 82 73 76 75 93 13,570 0.8 2.2
04 17 6.2 2.2 30 7 57 73 68 77 65 73 66 303 7,490 0.7 1.7
09 23 6.2 3.8 40 5 52 72 68 76 50 54 44 146 7,130 1.4 3.1
12 24 7.3 2.8 35 4 53 74 71 76 52 73 64 73 4,270 0.7 2.2
75 13 6.7 2.2 28 6 61 74 71 77 78 73 66 61 16,110 85.7 129.9
05 17 6.9 2.5 33 5 54 75 72 78 56 80 77 48 4,440 0.7 1.3
53 14 5.2 2.5 28 7 66 76 74 79 75 52 49 52 19,290 0.8 2.7
77 33 4.7 2.3 26 9 62 73 70 75 66 61 59 182 11,740 23 37
45 16 3.7 1.8 24 7 66 77 74 80 30 — — 201 20,070 0.1 0.1
36 17 3.5 2.0 26 6 66 75 72 77 84 — — 27 21,540 0.5 0.7
46 10 3.1 1.8 20 13 65 75 73 78 44 — — 660 15,080 0.3 0.4
45 4.6 4.0 1.7 17 13 70 78 76 80 77 74 73 101 18,520 9.1 10.9
31 9.8 3.3 2.2 19 15 69 78 74 81 — — — 348 — — —
— 21 — 2.0 22 10 — 73 71 76 67 — — 94 9,800 0.0 0.0
02 25 6.2 2.5 31 6 58 73 70 76 67 72 69 213 11,150 2.6 6.0
49 9 4.6 2.0 27 7 64 70 67 73 39 54 52 324 11,120 0.0 0.1
37 8.1 4.9 2.2 21 15 65 81 77 84 98 — — 238 — 0.4 0.5
41 59 5.8 3.4 35 4 47 63 61 65 53 35 31 387 1,710 0.3 0.6
48 21 5.5 2.3 27 8 68 74 71 76 54 73 68 248 8,480 2.2 2.0
Pakistan
Sri Lanka
SOUTHEAST ASI
Brunei
Cambodia
Indonesia
Laos
Malaysia
Myanmar
Philippines
Singapore
Thailand
Timor-Leste
Vietnam
EAST ASIA
China
China, Hong Ko
China, Macao S
Japan
Korea, North
Korea, South
Mongolia
Taiwan
EUROPE
EUROPEAN UN
NORTHERN EU
Channel Islands
Denmark
Estonia
Finland
Iceland
Ireland
Latvia
Lithuania
Norway
Sweden
United Kingdom
WESTERN EURO
Austria
Belgium
France
Germany
Liechtenstein
Luxembourg
Monaco
Netherlands
Switzerland
EASTERN EUROP
Belarus
Bulgaria
Czech Republic
Hungary
Moldova
Poland
Romania
Russiag
Slovakia
Ukraineg
SOUTHERN EUR
POPULATION, HEALTH, AND ENVIRONMENT DATA AND ESTIMATES FOR THE COUNTRIES AND REGIONS OF THE WORLD
© 2014 Population Reference Bureau See notes on page 18 2014 WORLD POPULATION DATA SHEET 15
ENVIRONMENT DATA AND ESTIMATES FOR THE COUNTRIES AND REGIONS OF THE WORLD
Infant
Mortality Ratea
Total
Fertility Rateb Percent of Population
Life Expectancy at Birth (years)
Percent
Urban
Percent of Married Women
15-49 Using Contraceptionc
Population
per Square
Kilometer
GNI PPP
per Capita
($US)
2013d
Carbon Emissions
(million tons)
1990 2012970 2013* 1970 2013* Ages 15 Ages 65+
Both Sexes
1970
Both Sexes
2013*
Males
2013*
Females
2013*
All
Methods
Modern
Methods
89 38 4.7 2.5 26 8 58 71 69 73 53 63 56 53 14,210 6,127 9,667
24 5 2.3 1.6 16 17 71 79 75 82 77 70 60 23 37,470 3,883 3,606
00 42 5.7 2.6 29 6 55 69 67 71 48 61 55 72 8,920 2,029 5,510
19 46 5.8 3.0 32 5 51 67 65 69 46 54 46 63 8,060 1,358 2,884
50 64 5.7 4.3 40 4 44 61 60 62 28 36 30 44 1,970 20 62
39 62 6.7 4.7 41 4 45 59 58 60 40 34 28 37 4,470 188 331
38 67 6.7 5.1 43 3 44 57 56 58 37 29 23 41 3,220 125 193
40 33 6.5 3.4 32 5 52 69 68 71 51 53 47 28 9,600 64 139
28 26 7.6 2.9 28 6 50 71 69 73 73 61 52 16 12,990 21.5 37.7
69 29 5.9 3.5 32 6 52 71 69 72 43 60 58 88 10,850 20.7 58.7
04 14 7.9 2.4 29 5 56 75 73 77 78 42 20 4 28,110 10.0 16.7
18 29 6.7 2.6 28 5 53 71 69 73 59 67 57 75 7,000 6.4 14.3
97 55 6.9 5.2 41 3 52 62 60 64 33 9 — 21 2,370 1.5 3.9
58 16 6.4 2.2 24 7 51 75 73 77 66 63 50 67 10,960 3.6 7.5
68 37 6.6 2.4 27 3 42 68 66 70 82 — — 2 — 0.0 0.0
52 66 6.7 5.4 44 3 41 55 54 55 45 17 11 55 3,930 18 33
55 69 6.8 4.9 43 3 42 59 58 61 45 13 7 91 1,780 0.2 1.5
63 70 6.6 5.9 46 2 39 56 56 57 27 16 15 65 1,560 0.2 0.5
09 24 6.9 2.6 30 5 52 75 71 79 62 61 57 126 6,220 0.0 0.1
56 75 7.9 4.9 41 3 44 51 50 51 53 18 12 65 2,900 1.6 1.7
20 55 6.1 5.6 46 2 38 59 57 60 57 9 8 169 1,620 0.1 0.1
10 53 7.0 4.3 38 5 49 61 60 62 51 35 23 113 3,880 1.1 2.5
90 67 6.2 5.1 42 3 37 56 55 57 36 6 3 47 1,160 0.3 0.3
44 94 6.1 5.0 41 3 44 54 53 56 44 14 10 48 1,240 0.1 0.1
86 54 6.7 4.7 43 3 39 60 59 61 47 20 19 39 790 0.1 0.2
84 58 6.9 6.1 48 3 32 55 55 54 35 10 10 13 1,540 0.1 0.2
10 72 6.8 4.1 40 3 49 62 60 63 41 9 8 4 2,850 0.7 0.6
54 54 7.4 7.6 50 3 36 58 58 58 22 14 8 14 910 0.2 0.4
53 69 6.5 5.6 44 3 41 52 52 53 50 15 9 192 5,600 12.4 22.2
11 43 7.3 5.3 44 3 39 63 62 65 47 18 16 71 2,240 0.9 2.0
97 92 6.7 4.9 42 3 35 45 45 46 41 17 15 88 1,750 0.1 0.2
20 66 7.1 4.7 42 3 47 56 56 57 38 15 13 123 1,180 0.2 0.4
34 57 7.1 4.9 44 3 45 60 59 62 24 39 31 54 1,570 11 17
39 87 7.3 6.1 45 2 44 54 52 56 10 22 18 377 820 0.1 0.1
34 36 7.1 4.3 42 3 48 61 59 61 28 19 13 335 1,560 0.0 0.0
12 55 6.8 3.4 34 4 49 62 60 63 77 19 18 38 — 0.1 0.2
51 42 6.7 4.7 43 2 41 63 60 65 21 8 7 56 1,180 — 0.1
44 50 7.0 4.1 43 3 43 63 62 65 17 42 40 87 1,350 0.8 1.8
98 47 8.1 4.3 42 3 52 62 60 64 24 46 39 74 2,250 1.6 3.5
39 42 7.3 4.4 42 3 45 65 63 66 33 40 33 38 1,350 0.3 0.6
75 66 7.3 5.5 45 3 41 55 55 55 16 46 42 142 760 0.2 0.4
66 12.1 3.8 1.4 21 8 63 74 70 77 42 76 39 618 17,220 0.4 1.2
53 4 7.9 4.1 45 2 62 79 76 82 50 — — 600 — — —
65 85 6.6 5.7 45 3 39 53 51 55 31 12 11 31 1,040 0.3 0.8
53 7 4.8 2.4 24 9 63 80 77 83 94 67 64 339 — 0.4 1.2
36 49 8.2 4.0 41 3 44 65 63 66 17 52 45 421 1,430 0.2 0.2
54 11.4 5.8 2.4 22 8 66 73 69 78 54 — — 198 23,270 0.0 0.2
54 80 7.2 6.6 48 3 41 55 53 57 38 15 1 17 — 0.0 0.2
87 78 6.9 7.0 42 3 36 55 54 56 17 4 1 18 2,190 — —
ASIA
ASIA (Excl. China
WESTERN ASIA
Armenia
Azerbaijan
Bahrain
Cyprus
Georgia
Iraq
Israel
Jordan
Kuwait
Lebanon
Oman
Palestinian Terri
Qatar
Saudi Arabia
Syria
Turkey
United Arab Em
Yemen
SOUTH CENTRA
CENTRAL ASIA
Kazakhstan
Kyrgyzstan
Tajikistan
Turkmenistan
Uzbekistan
SOUTH ASIA
Afghanistan
Bangladesh
Bhutan
India
Iran
Maldives
Nepal
Pakistan
Sri Lanka
SOUTHEAST ASI
Brunei
Cambodia
Indonesia
Laos
Malaysia
Myanmar
Philippines
Singapore
Thailand
Timor-Leste
P O P U L A T I O N R E F E R E N C E BPanama 3.9 20 5 1.5 2 4.8 5.6 1.4 53 14 5.2 2.5 28
CARIBBEAN 43 18 8 1.1 -4 47 49 1.1 77 33 4.7 2.3 26
Antigua and Barbuda 0.1 14 5 0.8 5 0.1 0.1 1.4 45 16 3.7 1.8 24
Bahamas 0.4 16 5 1.1 2 0.4 0.5 1.3 36 17 3.5 2.0 26
Barbados 0.3 12 8 0.4 1 0.3 0.3 1.1 46 10 3.1 1.8 20
Cuba 11.2 11 8 0.3 -4 10.7 9.3 0.8 45 4.6 4.0 1.7 17
Curacao 0.2 13 8 0.5 4 0.2 0.2 1.2 31 9.8 3.3 2.2 19
Dominica 0.1 13 8 0.5 -6 0.1 0.1 0.9 — 21 — 2.0 22
Dominican Republic 10.4 21 6 1.5 -3 12.0 13.2 1.3 102 25 6.2 2.5 31
Grenada 0.1 16 7 0.8 -2 0.1 0.1 0.9 49 9 4.6 2.0 27
Guadeloupe 0.4 13 7 0.6 -7 0.4 0.4 1.0 37 8.1 4.9 2.2 21
Haiti 10.8 28 9 1.9 -3 13.5 16.8 1.6 141 59 5.8 3.4 35
Jamaica 2.7 18 7 1.1 -5 2.9 2.7 1.0 48 21 5.5 2.3 27
Martinique 0.4 12 7 0.4 -10 0.4 0.4 1.1 40 8 4.6 1.9 19
Puerto Rico 3.6 11 8 0.3 -13 3.4 3.0 0.8 29 8.1 3.2 1.6 19
St. Kitts-Nevis 0.1 13 7 0.6 7 0.1 0.1 1.2 — 17 — 1.6 22
St. Lucia 0.2 13 8 0.6 0 0.2 0.2 1.0 50 20 6.1 1.5 23
St. Vincent and the Grenadines 0.1 17 8 0.9 -9 0.1 0.1 1.0 64 20 6.0 2.2 25
Trinidad and Tobago 1.3 13 10 0.3 -3 1.2 1.0 0.7 46 24 3.6 1.6 20
SOUTH AMERICA 410 17 6 1.1 -0 467 503 1.2 89 18 4.9 2.1 26
Argentina 42.7 19 7 1.1 -0 50.2 59.4 1.4 53 11.7 3.1 2.3 25
Bolivia 10.3 26 7 1.9 0 13.0 15.8 1.5 156 39 6.6 3.2 35
Brazil 202.8 15 6 0.9 0 223.1 226.3 1.1 96 20 5.0 1.8 24
Chile 17.7 14 6 0.9 0 19.6 20.2 1.1 79 7.7 4.0 1.9 22
Colombia 47.7 19 6 1.3 -2 55.7 61.3 1.3 78 18 5.6 2.3 28
Ecuador 16.0 23 5 1.8 -0 19.8 23.4 1.5 101 17 6.1 2.8 31
French Guiana 0.3 27 3 2.4 2 0.4 0.6 2.4 47 10 4.7 3.5 34
Guyana 0.7 20 7 1.3 -15 0.8 0.8 1.0 60 29 5.1 2.5 36
Paraguay 6.9 23 6 1.7 -1 8.6 10.1 1.5 56 29 5.7 2.8 33
Peru 30.8 20 5 1.5 -3 35.9 40.1 1.3 118 16 6.3 2.4 29
Suriname 0.6 20 7 1.3 -2 0.7 0.7 1.3 46 20 5.7 2.6 28
Uruguay 3.4 14 9 0.5 -2 3.6 3.6 1.1 47 9.3 2.9 2.0 22
Venezuela 30.2 20 5 1.5 0 36.1 40.5 1.3 54 14.4 5.4 2.4 29
Population
(millions)
Birth Rate Death Rate Natural Increase
(%)
Migration Rate mid-2030 mid-2050 Population
Change
1970 2013* 1970 2013* 15
Population (millions) Infant Mortality Total Fertility Rate % of Population
NOTES
(—) Indicates data unavailable or inapplicable.
* Denotes 2013 or most recent year for which data are available.
a Infant deaths per 1,000 live births. Rates shown with decimals indicate national statistics
reported as completely registered, while those without are estimates from the sources
cited on the reverse. Rates shown in italics are based upon fewer than 50 annual infant
deaths and, as a result, are subject to considerable yearly variability.
b Average number of children born t
c Data prior to 2008 are shown in ita
d Data prior to 2013 are shown in ita
e The status of Western Sahara is dis
f Special Administrative Region.
g Does not include the population o
1875 Connecticut Ave., NW, Washington, DC 20009 USA
tel. 202-483-1100 | fax 202-328-3937
e-mail: popref@prb.org | website: www.prb.org
53 14 5.2 2.5 28 7 66 76 74 79 75 52 49 52 19,290 0.8 2.7
77 33 4.7 2.3 26 9 62 73 70 75 66 61 59 182 11,740 23 37
45 16 3.7 1.8 24 7 66 77 74 80 30 — — 201 20,070 0.1 0.1
36 17 3.5 2.0 26 6 66 75 72 77 84 — — 27 21,540 0.5 0.7
46 10 3.1 1.8 20 13 65 75 73 78 44 — — 660 15,080 0.3 0.4
45 4.6 4.0 1.7 17 13 70 78 76 80 77 74 73 101 18,520 9.1 10.9
31 9.8 3.3 2.2 19 15 69 78 74 81 — — — 348 — — —
— 21 — 2.0 22 10 — 73 71 76 67 — — 94 9,800 0.0 0.0
02 25 6.2 2.5 31 6 58 73 70 76 67 72 69 213 11,150 2.6 6.0
49 9 4.6 2.0 27 7 64 70 67 73 39 54 52 324 11,120 0.0 0.1
37 8.1 4.9 2.2 21 15 65 81 77 84 98 — — 238 — 0.4 0.5
41 59 5.8 3.4 35 4 47 63 61 65 53 35 31 387 1,710 0.3 0.6
48 21 5.5 2.3 27 8 68 74 71 76 54 73 68 248 8,480 2.2 2.0
40 8 4.6 1.9 19 17 66 82 79 85 89 — — 348 — 0.6 0.6
29 8.1 3.2 1.6 19 16 72 79 75 83 99 84 72 403 22,730 — —
— 17 — 1.6 22 8 — 75 73 78 32 — — 210 20,400 0.0 0.1
50 20 6.1 1.5 23 9 63 75 72 77 18 — — 321 10,350 0.1 0.1
64 20 6.0 2.2 25 7 65 71 70 74 49 — — 273 10,610 0.0 0.1
46 24 3.6 1.6 20 9 65 70 66 74 14 43 38 262 26,210 4.6 12.8
89 18 4.9 2.1 26 8 60 75 72 78 82 75 68 23 12,620 161 316
53 11.7 3.1 2.3 25 10 66 77 73 80 92 55 53 15 — 30.7 53.6
56 39 6.6 3.2 35 5 46 67 65 69 67 61 34 9 5,750 1.5 5.0
96 20 5.0 1.8 24 7 59 75 71 79 85 80 77 24 14,750 57.0 122.1
79 7.7 4.0 1.9 22 10 62 79 76 82 87 64 — 23 21,030 9.3 24.8
78 18 5.6 2.3 28 7 61 75 72 79 76 79 73 42 11,890 15.6 22.0
01 17 6.1 2.8 31 7 58 75 72 78 63 73 59 57 10,310 4.6 9.5
47 10 4.7 3.5 34 5 65 79 76 83 76 — — 3 — 0.2 0.2
60 29 5.1 2.5 36 3 59 66 64 69 28 43 40 3 6,550 0.3 0.5
56 29 5.7 2.8 33 5 65 73 71 75 59 79 70 17 7,640 0.6 1.4
18 16 6.3 2.4 29 6 53 75 72 77 75 74 51 24 11,360 5.8 17.8
46 20 5.7 2.6 28 6 63 71 69 74 70 48 47 3 15,860 0.5 0.7
47 9.3 2.9 2.0 22 14 69 77 74 81 94 77 75 20 18,930 1.0 2.0
54 14.4 5.4 2.4 29 6 65 75 72 78 89 70 62 33 17,890 33.0 57.0
Switzerland
EASTERN EUROP
Belarus
Bulgaria
Czech Republic
Hungary
Moldova
Poland
Romania
Russiag
Slovakia
Ukraineg
SOUTHERN EUR
Albania
Andorra
Bosnia-Herzego
Croatia
Greece
Italy
Kosovoh
Macedoniai
Malta
Montenegro
Portugal
San Marino
Serbia
Slovenia
Spain
OCEANIA
Australia
Federated State
Fiji
French Polynesi
Guam
Kiribati
Marshall Islands
Nauru
New Caledonia
New Zealand
Palau
Papua New Gui
Samoa
Solomon Island
Tonga
Tuvalu
Vanuatu
970 2013* 1970 2013* 15 65+ Both, 1970 Both, 2013* Males, 2013* Females, 2013* Percent Urban All Methods Modern Methods Population
Density
GNI PPP per
Capita ($US)
2013
1990 2012
Infant Mortality Total Fertility Rate % of Population Life Expectancy % Using Contraception Carbon Emissions (million tons)
cate national statistics
tes from the sources
than 50 annual infant
ty.
b Average number of children born to a woman during her lifetime.
c Data prior to 2008 are shown in italics.
d Data prior to 2013 are shown in italics.
e The status of Western Sahara is disputed by Morocco.
f Special Administrative Region.
g Does not include the population of Crimea, estimated at 2.3 million.
h Kosovo declared independence from Serbia on Feb. 17, 2008.
Serbia has not recognized Kosovo’s independence.
i The former Yugoslav Republic.
For additional notes and sources, see reverse side.
Data prepared by PRB demographers Carl Haub and Toshiko Kaneda.
© August 2014. Population Reference Bureau. All rights reserved.
ENVIRONMENT DATA AND ESTIMATES FOR THE COUNTRIES AND REGIONS OF THE WORLD
Infant
Mortality Ratea
Total
Fertility Rateb Percent of Population
Life Expectancy at Birth (years)
Percent
Urban
Percent of Married Women
15-49 Using Contraceptionc
Population
per Square
Kilometer
GNI PPP
per Capita
($US)
2013d
Carbon Emissions
(million tons)
1990 2012970 2013* 1970 2013* Ages 15 Ages 65+
Both Sexes
1970
Both Sexes
2013*
Males
2013*
Females
2013*
All
Methods
Modern
Methods
91 34 5.4 2.2 25 7 57 71 69 73 46 66 60 136 10,380 1,863 5,023
14 40 5.9 2.5 29 6 53 69 67 71 43 57 48 134 9,700 1,192 2,397
22 25 5.8 2.9 30 5 56 73 71 76 70 54 37 53 22,920 202 453
66 10 3.2 1.6 19 11 70 74 71 78 63 55 26 101 8,140 1.2 1.2
03 11 4.6 2.2 22 6 65 74 71 77 53 51 13 110 16,180 17.3 13.9
58 8 6.5 2.1 21 2 63 76 75 78 100 62 31 1,901 36,140 3.2 6.7
26 6 2.5 1.5 17 12 73 79 77 81 67 — — 125 29,570 1.3 2.1
55 11 2.6 1.7 17 14 67 75 70 79 54 53 35 69 7,040 4.6 1.8
80 29 7.4 4.1 40 3 58 69 66 73 71 53 33 80 15,220 14.3 33.3
23 3.0 3.8 3.0 28 10 72 82 80 84 91 — — 371 32,140 9.2 20.9
71 17 7.9 3.5 34 4 60 73 72 74 83 61 41 85 11,660 2.8 6.1
47 8 7.2 2.4 23 2 66 74 73 75 98 52 39 205 88,170 13.2 26.4
44 9 5.0 1.5 20 9 66 80 78 82 87 58 34 478 17,390 2.5 5.8
20 9 7.3 2.8 22 3 50 76 75 78 75 32 25 13 52,170 3.1 16.1
99 20 7.9 4.1 40 3 56 73 71 74 83 53 41 731 4,900 — 0.7
43 7 6.9 2.1 14 1 68 78 78 79 100 38 — 206 123,860 3.2 24.7
22 16 7.3 2.9 30 3 53 74 73 75 81 24 — 14 53,780 59.4 137.9
81 17 7.6 3.0 35 4 59 74 72 78 54 54 38 119 — 10.2 17.9
45 10 5.7 2.1 25 8 52 75 71 78 77 73 46 99 18,760 39.8 84.9
67 6 6.6 1.8 16 0 62 77 76 78 83 28 24 113 58,090 14.2 46.7
96 68 7.5 4.4 42 3 41 63 62 64 29 34 29 49 3,820 2.0 6.0
33 47 5.7 2.5 31 5 49 67 65 68 33 54 46 174 5,600 397 973
95 41 5.1 2.7 29 5 62 68 65 72 47 53 49 17 9,300 126 127
81 28 3.5 2.7 25 7 63 70 65 74 55 51 50 6 20,570 78.5 79.6
05 27 4.9 3.2 31 4 61 70 66 74 34 36 34 29 3,070 3.3 1.8
29 57 6.9 3.8 36 3 60 67 64 71 26 28 26 58 2,500 2.2 0.8
$
53,960Gross national
income per capita
in the United States.
2.4BILLION
By 2050, Africa’s population is
estimated to increase to 2.4
billion, from 1.1 billion in 2014.
40%Percentage of Iraq’s
population under age 15.
9.7Billion tons of carbon
emissions worldwide in
2012. Up from 6.1 billion
tons in 1990.
et
POPULATION, HEALTH, AND ENVIRONMENT DATA AND ESTIMATES
bon Emissions
million tons)
90 2012
27 9,667
83 3,606
29 5,510
58 2,884
20 62
88 331
25 193
64 139
21.5 37.7
20.7 58.7
10.0 16.7
6.4 14.3
1.5 3.9
3.6 7.5
0.0 0.0
18 33
0.2 1.5
0.2 0.5
0.0 0.1
1.6 1.7
0.1 0.1
1.1 2.5
0.3 0.3
0.1 0.1
0.1 0.2
0.1 0.2
Population
mid-2014
(millions)
Births
per 1,000
Population
Deaths
per 1,000
Population
Rate of
Natural
Increase
(%)
Net
Migration
Rate
per 1,000
Population
Projected
Population (millions)
2050
Population
as a
Multiple of
2014
Infant
Mortality Ratea
Total
Fertility Rateb Percent of Popu
mid-2030 mid-2050 1970 2013* 1970 2013* Ages 15 Ag
ASIA 4,351 18 7 1.1 -0 4,907 5,252 1.2 91 34 5.4 2.2 25
ASIA (Excl. China) 2,987 21 7 1.4 -0 3,507 3,941 1.3 114 40 5.9 2.5 29
WESTERN ASIA 255 22 5 1.7 2 322 387 1.5 122 25 5.8 2.9 30
Armenia 3.0 14 9 0.5 -8 3.0 2.8 0.9 66 10 3.2 1.6 19
Azerbaijan 9.5 18 6 1.3 0 11.1 12.1 1.3 103 11 4.6 2.2 22
Bahrain 1.3 15 2 1.3 20 1.6 1.8 1.4 58 8 6.5 2.1 21
Cyprus 1.2 13 7 0.6 -2 1.3 1.4 1.2 26 6 2.5 1.5 17
Georgia 4.8 13 11 0.2 -1 4.8 4.6 1.0 55 11 2.6 1.7 17
Iraq 35.1 31 5 2.6 1 53.8 80.5 2.3 80 29 7.4 4.1 40
Israel 8.2 21 5 1.6 3 10.5 13.9 1.7 23 3.0 3.8 3.0 28
Jordan 7.6 28 4 2.4 -8 9.9 13.1 1.7 71 17 7.9 3.5 34
Kuwait 3.7 18 2 1.7 35 5.1 6.6 1.8 47 8 7.2 2.4 23
Lebanon 5.0 13 4 0.9 20 5.2 5.3 1.1 44 9 5.0 1.5 20
Oman 4.1 20 2 1.8 39 5.4 6.3 1.6 120 9 7.3 2.8 22
Palestinian Territory 4.4 31 4 2.7 -1 6.6 9.1 2.1 99 20 7.9 4.1 40
Qatar 2.3 11 1 1.0 2 2.8 3.0 1.3 43 7 6.9 2.1 14
Saudi Arabia 30.8 22 4 1.8 2 37.4 42.4 1.4 122 16 7.3 2.9 30
Syria 22.0 24 4 2.1 -11 29.9 36.7 1.7 81 17 7.6 3.0 35
Turkey 77.2 16 5 1.1 0 88.3 93.3 1.2 145 10 5.7 2.1 25
United Arab Emirates 9.4 15 1 1.4 22 12.3 15.5 1.6 67 6 6.6 1.8 16
Yemen 26.0 36 8 2.8 -1 33.6 38.8 1.5 196 68 7.5 4.4 42
SOUTH CENTRAL ASIA 1,874 22 7 1.6 -1 2,220 2,516 1.3 133 47 5.7 2.5 31
CENTRAL ASIA 67 24 6 1.8 -1 81 93 1.4 95 41 5.1 2.7 29
Kazakhstan 17.3 23 8 1.5 -0 20.3 24.5 1.4 81 28 3.5 2.7 25
Kyrgyzstan 5.8 28 7 2.1 -1 7.5 9.4 1.6 105 27 4.9 3.2 31
Tajikistan 8.3 34 7 2.7 -5 11.2 14.8 1.8 129 57 6.9 3.8 36
OPULATION Data Sheet
E N C E B U R E A U
POPULATION, HEALTH, AND ENVIRONMENT DATA AND ESTIMATES FOR THE COUNTRIES AND REGIONS OF THE WORLD
© 2014 Population Reference Bureau See notes on page 18 2014 WORLD POPULATION DATA SHEET 16
ENVIRONMENT DATA AND ESTIMATES FOR THE COUNTRIES AND REGIONS OF THE WORLD
Infant
Mortality Ratea
Total
Fertility Rateb Percent of Population
Life Expectancy at Birth (years)
Percent
Urban
Percent of Married Women
15-49 Using Contraceptionc
Population
per Square
Kilometer
GNI PPP
per Capita
($US)
2013d
Carbon Emissions
(million tons)
1990 2012970 2013* 1970 2013* Ages 15 Ages 65+
Both Sexes
1970
Both Sexes
2013*
Males
2013*
Females
2013*
All
Methods
Modern
Methods
89 38 4.7 2.5 26 8 58 71 69 73 53 63 56 53 14,210 6,127 9,667
24 5 2.3 1.6 16 17 71 79 75 82 77 70 60 23 37,470 3,883 3,606
00 42 5.7 2.6 29 6 55 69 67 71 48 61 55 72 8,920 2,029 5,510
19 46 5.8 3.0 32 5 51 67 65 69 46 54 46 63 8,060 1,358 2,884
50 64 5.7 4.3 40 4 44 61 60 62 28 36 30 44 1,970 20 62
39 62 6.7 4.7 41 4 45 59 58 60 40 34 28 37 4,470 188 331
38 67 6.7 5.1 43 3 44 57 56 58 37 29 23 41 3,220 125 193
40 33 6.5 3.4 32 5 52 69 68 71 51 53 47 28 9,600 64 139
28 26 7.6 2.9 28 6 50 71 69 73 73 61 52 16 12,990 21.5 37.7
69 29 5.9 3.5 32 6 52 71 69 72 43 60 58 88 10,850 20.7 58.7
04 14 7.9 2.4 29 5 56 75 73 77 78 42 20 4 28,110 10.0 16.7
18 29 6.7 2.6 28 5 53 71 69 73 59 67 57 75 7,000 6.4 14.3
97 55 6.9 5.2 41 3 52 62 60 64 33 9 — 21 2,370 1.5 3.9
58 16 6.4 2.2 24 7 51 75 73 77 66 63 50 67 10,960 3.6 7.5
68 37 6.6 2.4 27 3 42 68 66 70 82 — — 2 — 0.0 0.0
52 66 6.7 5.4 44 3 41 55 54 55 45 17 11 55 3,930 18 33
55 69 6.8 4.9 43 3 42 59 58 61 45 13 7 91 1,780 0.2 1.5
63 70 6.6 5.9 46 2 39 56 56 57 27 16 15 65 1,560 0.2 0.5
09 24 6.9 2.6 30 5 52 75 71 79 62 61 57 126 6,220 0.0 0.1
56 75 7.9 4.9 41 3 44 51 50 51 53 18 12 65 2,900 1.6 1.7
20 55 6.1 5.6 46 2 38 59 57 60 57 9 8 169 1,620 0.1 0.1
10 53 7.0 4.3 38 5 49 61 60 62 51 35 23 113 3,880 1.1 2.5
90 67 6.2 5.1 42 3 37 56 55 57 36 6 3 47 1,160 0.3 0.3
44 94 6.1 5.0 41 3 44 54 53 56 44 14 10 48 1,240 0.1 0.1
86 54 6.7 4.7 43 3 39 60 59 61 47 20 19 39 790 0.1 0.2
84 58 6.9 6.1 48 3 32 55 55 54 35 10 10 13 1,540 0.1 0.2
10 72 6.8 4.1 40 3 49 62 60 63 41 9 8 4 2,850 0.7 0.6
54 54 7.4 7.6 50 3 36 58 58 58 22 14 8 14 910 0.2 0.4
53 69 6.5 5.6 44 3 41 52 52 53 50 15 9 192 5,600 12.4 22.2
11 43 7.3 5.3 44 3 39 63 62 65 47 18 16 71 2,240 0.9 2.0
97 92 6.7 4.9 42 3 35 45 45 46 41 17 15 88 1,750 0.1 0.2
20 66 7.1 4.7 42 3 47 56 56 57 38 15 13 123 1,180 0.2 0.4
34 57 7.1 4.9 44 3 45 60 59 62 24 39 31 54 1,570 11 17
39 87 7.3 6.1 45 2 44 54 52 56 10 22 18 377 820 0.1 0.1
34 36 7.1 4.3 42 3 48 61 59 61 28 19 13 335 1,560 0.0 0.0
12 55 6.8 3.4 34 4 49 62 60 63 77 19 18 38 — 0.1 0.2
51 42 6.7 4.7 43 2 41 63 60 65 21 8 7 56 1,180 — 0.1
44 50 7.0 4.1 43 3 43 63 62 65 17 42 40 87 1,350 0.8 1.8
98 47 8.1 4.3 42 3 52 62 60 64 24 46 39 74 2,250 1.6 3.5
39 42 7.3 4.4 42 3 45 65 63 66 33 40 33 38 1,350 0.3 0.6
75 66 7.3 5.5 45 3 41 55 55 55 16 46 42 142 760 0.2 0.4
66 12.1 3.8 1.4 21 8 63 74 70 77 42 76 39 618 17,220 0.4 1.2
53 4 7.9 4.1 45 2 62 79 76 82 50 — — 600 — — —
65 85 6.6 5.7 45 3 39 53 51 55 31 12 11 31 1,040 0.3 0.8
53 7 4.8 2.4 24 9 63 80 77 83 94 67 64 339 — 0.4 1.2
36 49 8.2 4.0 41 3 44 65 63 66 17 52 45 421 1,430 0.2 0.2
54 11.4 5.8 2.4 22 8 66 73 69 78 54 — — 198 23,270 0.0 0.2
54 80 7.2 6.6 48 3 41 55 53 57 38 15 1 17 — 0.0 0.2
87 78 6.9 7.0 42 3 36 55 54 56 17 4 1 18 2,190 — —
ASIA
ASIA (Excl. China
WESTERN ASIA
Armenia
Azerbaijan
Bahrain
Cyprus
Georgia
Iraq
Israel
Jordan
Kuwait
Lebanon
Oman
Palestinian Terri
Qatar
Saudi Arabia
Syria
Turkey
United Arab Em
Yemen
SOUTH CENTRA
CENTRAL ASIA
Kazakhstan
Kyrgyzstan
Tajikistan
Turkmenistan
Uzbekistan
SOUTH ASIA
Afghanistan
Bangladesh
Bhutan
India
Iran
Maldives
Nepal
Pakistan
Sri Lanka
SOUTHEAST ASI
Brunei
Cambodia
Indonesia
Laos
Malaysia
Myanmar
Philippines
Singapore
Thailand
Timor-Leste
P O P U L A T I O N R E F E R E N C E B47 8 7.2 2.4 23 2 66 74 73 75 98 52 39 205 88,170 13.2 26.4
44 9 5.0 1.5 20 9 66 80 78 82 87 58 34 478 17,390 2.5 5.8
20 9 7.3 2.8 22 3 50 76 75 78 75 32 25 13 52,170 3.1 16.1
99 20 7.9 4.1 40 3 56 73 71 74 83 53 41 731 4,900 — 0.7
43 7 6.9 2.1 14 1 68 78 78 79 100 38 — 206 123,860 3.2 24.7
22 16 7.3 2.9 30 3 53 74 73 75 81 24 — 14 53,780 59.4 137.9
81 17 7.6 3.0 35 4 59 74 72 78 54 54 38 119 — 10.2 17.9
45 10 5.7 2.1 25 8 52 75 71 78 77 73 46 99 18,760 39.8 84.9
67 6 6.6 1.8 16 0 62 77 76 78 83 28 24 113 58,090 14.2 46.7
96 68 7.5 4.4 42 3 41 63 62 64 29 34 29 49 3,820 2.0 6.0
33 47 5.7 2.5 31 5 49 67 65 68 33 54 46 174 5,600 397 973
95 41 5.1 2.7 29 5 62 68 65 72 47 53 49 17 9,300 126 127
81 28 3.5 2.7 25 7 63 70 65 74 55 51 50 6 20,570 78.5 79.6
05 27 4.9 3.2 31 4 61 70 66 74 34 36 34 29 3,070 3.3 1.8
29 57 6.9 3.8 36 3 60 67 64 71 26 28 26 58 2,500 2.2 0.8
16 47 6.3 2.4 28 4 58 65 61 70 47 48 46 11 12,920 8.4 15.1
89 44 6.5 2.4 28 4 63 68 65 72 51 65 59 69 5,340 34.0 30.0
34 47 5.8 2.5 31 5 49 67 65 68 32 54 46 266 5,460 271 845
08 74 7.7 5.1 46 2 37 61 59 62 24 21 20 48 2,000 0.7 2.4
65 33 7.0 2.2 29 5 48 70 70 71 26 61 52 1,101 2,810 4.2 17.7
74 47 6.7 2.5 30 5 37 68 67 68 36 66 65 16 7,210 0.0 0.1
29 44 5.5 2.4 31 5 49 66 65 68 31 55 48 394 5,350 188.3 611.2
39 16 6.4 1.8 24 5 51 74 72 76 71 82 60 47 15,600 57.6 164.5
61 9 7.2 2.3 26 5 44 74 73 75 41 35 27 1,241 9,890 0.0 0.3
66 46 6.0 2.4 34 5 42 68 67 69 17 50 43 184 2,260 0.2 1.1
23 74 6.6 3.8 38 4 53 65 63 66 35 35 25 244 4,920 18.7 44.1
49 9 4.3 2.1 26 8 64 74 71 77 15 68 53 315 9,470 1.0 3.8
89 28 5.7 2.4 27 6 55 71 68 73 48 62 55 138 9,130 116 356
34 4 5.8 1.6 25 5 67 78 77 80 76 — — 73 68,090 1.8 2.7
23 45 6.5 2.8 31 6 42 63 61 66 20 51 35 82 2,890 0.1 1.2
09 32 5.5 2.6 29 5 52 71 69 73 50 62 58 132 9,260 40.8 130.0
43 68 6.0 3.2 35 4 46 68 66 69 34 50 42 29 4,570 0.1 0.5
42 7 4.9 2.1 26 6 64 75 73 77 71 49 32 91 22,460 15.4 59.0
16 49 6.0 2.0 25 5 51 65 63 67 31 46 46 79 — 1.2 2.7
63 23 6.3 3.0 34 4 61 69 65 72 63 55 37 334 7,820 11.4 23.6
22 2.0 3.2 1.2 16 11 68 83 80 85 100 62 55 8,034 76,850 12.8 3.6
69 11 5.6 1.8 18 10 60 75 71 78 47 79 77 129 13,510 26.1 88.1
86 63 5.9 5.7 42 5 40 62 61 62 30 22 21 81 6,410 — 0.1
55 15 6.5 2.1 24 7 60 73 70 76 32 76 67 273 5,030 6.0 45.0
49 14 4.9 1.5 16 11 64 76 75 78 58 82 81 136 14,440 1,149 3,241
51 15 5.5 1.6 16 10 63 75 74 77 54 85 84 143 11,850 671.1 2,625.7
21 1.6 3.3 1.1 11 15 72 84 81 87 100 80 75 6,589 54,260 7.5 10.5
31 3 2.2 1.2 11 8 69 82 79 86 100 — — 23,872 112,180 0.3 0.3
14 1.9 2.1 1.4 13 26 72 83 80 86 91 54 44 336 37,630 298.6 342.3
51 26 4.3 2.0 22 9 60 69 65 73 60 71 65 206 — 66.8 20.5
50 2.9 4.5 1.2 15 12 61 81 78 85 81 80 70 507 33,440 67.3 166.7
12 26 7.6 2.9 28 4 55 67 64 72 68 55 50 2 8,810 2.7 3.3
27 3.7 3.9 1.1 14 12 68 80 76 83 73 71 — 650 — 34.3 71.6
27 6 2.3 1.6 16 17 70 78 74 81 72 70 57 32 30,010 2,077 1,619
25 4 2.4 1.5 16 18 71 80 77 83 72 72 61 116 34,220 1,161 967
17 3 2.3 1.8 18 17 72 80 78 83 79 80 78 56 37,860 233 201
24 2.9 2.1 1.7 15 16 72 82 79 84 31 — — 835 — — —
14 3.0 2.0 1.7 17 18 73 80 78 82 87 77 — 131 44,440 13.6 10.0
22 2.1 2.2 1.5 16 18 70 76 71 81 68 63 58 29 24,230 6.9 5.3
13 1.8 1.8 1.8 16 19 70 81 78 84 85 77 75 16 38,480 14.1 13.1
13 1.8 2.8 1.9 21 13 74 82 81 84 95 — — 3 38,870 0.5 0.5
20 3.3 3.9 2.0 22 12 71 81 78 83 60 65 61 66 35,090 8.6 9.9
20 3.6 2.0 1.5 14 19 70 74 69 79 68 68 56 31 21,390 4.1 2.1
23 3.6 2.4 1.6 15 18 71 74 68 79 67 63 50 45 23,080 6.7 3.7
6.4 14.3
1.5 3.9
3.6 7.5
0.0 0.0
18 33
0.2 1.5
0.2 0.5
0.0 0.1
1.6 1.7
0.1 0.1
1.1 2.5
0.3 0.3
0.1 0.1
0.1 0.2
0.1 0.2
0.7 0.6
0.2 0.4
12.4 22.2
0.9 2.0
0.1 0.2
0.2 0.4
11 17
0.1 0.1
0.0 0.0
0.1 0.2
— 0.1
0.8 1.8
1.6 3.5
0.3 0.6
0.2 0.4
0.4 1.2
— —
0.3 0.8
0.4 1.2
0.2 0.2
0.0 0.2
0.0 0.2
— —
1.0 2.0
0.2 1.1
1.0 1.0
4.0 3.0
5 14
1.2 8.4
0.5 2.0
0.1 0.1
0.0 0.1
0.3 0.6
1.1 0.9
0.0 1.4
1.3 0.7
0.0 0.0
92 128
0.6 1.5
— 0.0
0.0 0.9
91.0 125.7
0.1 0.3
98 2,032
Kuwait 3.7 18 2 1.7 35 5.1 6.6 1.8 47 8 7.2 2.4 23
Lebanon 5.0 13 4 0.9 20 5.2 5.3 1.1 44 9 5.0 1.5 20
Oman 4.1 20 2 1.8 39 5.4 6.3 1.6 120 9 7.3 2.8 22
Palestinian Territory 4.4 31 4 2.7 -1 6.6 9.1 2.1 99 20 7.9 4.1 40
Qatar 2.3 11 1 1.0 2 2.8 3.0 1.3 43 7 6.9 2.1 14
Saudi Arabia 30.8 22 4 1.8 2 37.4 42.4 1.4 122 16 7.3 2.9 30
Syria 22.0 24 4 2.1 -11 29.9 36.7 1.7 81 17 7.6 3.0 35
Turkey 77.2 16 5 1.1 0 88.3 93.3 1.2 145 10 5.7 2.1 25
United Arab Emirates 9.4 15 1 1.4 22 12.3 15.5 1.6 67 6 6.6 1.8 16
Yemen 26.0 36 8 2.8 -1 33.6 38.8 1.5 196 68 7.5 4.4 42
SOUTH CENTRAL ASIA 1,874 22 7 1.6 -1 2,220 2,516 1.3 133 47 5.7 2.5 31
CENTRAL ASIA 67 24 6 1.8 -1 81 93 1.4 95 41 5.1 2.7 29
Kazakhstan 17.3 23 8 1.5 -0 20.3 24.5 1.4 81 28 3.5 2.7 25
Kyrgyzstan 5.8 28 7 2.1 -1 7.5 9.4 1.6 105 27 4.9 3.2 31
Tajikistan 8.3 34 7 2.7 -5 11.2 14.8 1.8 129 57 6.9 3.8 36
Turkmenistan 5.3 22 8 1.4 -1 6.2 6.6 1.2 116 47 6.3 2.4 28
Uzbekistan 30.7 22 5 1.8 -1 35.8 38.1 1.2 89 44 6.5 2.4 28
SOUTH ASIA 1,806 22 7 1.5 -1 2,139 2,422 1.3 134 47 5.8 2.5 31
Afghanistan 31.3 35 8 2.7 -3 43.5 56.5 1.8 208 74 7.7 5.1 46
Bangladesh 158.5 20 6 1.5 -3 185.1 201.9 1.3 165 33 7.0 2.2 29
Bhutan 0.7 22 6 1.5 0 0.9 1.1 1.5 174 47 6.7 2.5 30
India 1,296.2 22 7 1.5 -0 1,510.0 1,656.9 1.3 129 44 5.5 2.4 31
Iran 77.4 19 5 1.4 -0 90.0 99.2 1.3 139 16 6.4 1.8 24
Maldives 0.4 23 3 1.9 -0 0.5 0.5 1.4 161 9 7.2 2.3 26
Nepal 27.1 22 7 1.5 -3 31.7 35.2 1.3 166 46 6.0 2.4 34
Pakistan 194.0 28 8 2.0 -3 254.7 348.0 1.8 123 74 6.6 3.8 38
Sri Lanka 20.7 18 6 1.2 -3 22.5 23.0 1.1 49 9 4.3 2.1 26
SOUTHEAST ASIA 621 19 7 1.3 -0 733 831 1.3 89 28 5.7 2.4 27
Brunei 0.4 16 3 1.3 1 0.5 0.5 1.3 34 4 5.8 1.6 25
Cambodia 14.8 24 6 1.8 -2 18.4 21.7 1.5 123 45 6.5 2.8 31
Indonesia 251.5 20 6 1.4 -1 306.7 365.3 1.5 109 32 5.5 2.6 29
Laos 6.8 26 6 2.0 -2 8.3 9.1 1.3 143 68 6.0 3.2 35
Malaysia 30.1 17 5 1.3 3 36.0 41.1 1.4 42 7 4.9 2.1 26
Myanmar 53.7 17 9 0.9 -1 58.7 58.6 1.1 116 49 6.0 2.0 25
Philippines 100.1 24 6 1.8 -1 127.8 157.1 1.6 63 23 6.3 3.0 34
Singapore 5.5 9 5 0.5 12 6.5 7.0 1.3 22 2.0 3.2 1.2 16
Thailand 66.4 12 8 0.4 0 66.8 61.0 0.9 69 11 5.6 1.8 18
Timor-Leste 1.2 37 10 2.7 0 1.8 2.9 2.4 186 63 5.9 5.7 42
Vietnam 90.7 17 7 1.0 -0 102.0 106.3 1.2 55 15 6.5 2.1 24
EAST ASIA 1,601 12 7 0.4 0 1,631 1,519 0.9 49 14 4.9 1.5 16
China 1,364.1 12 7 0.5 -0 1,400.1 1,311.8 1.0 51 15 5.5 1.6 16
China, Hong Kong SARf 7.2 8 6 0.2 4 8.1 8.6 1.2 21 1.6 3.3 1.1 11
China, Macao SARf 0.6 11 3 0.8 35 0.7 0.8 1.3 31 3 2.2 1.2 11
Japan 127.1 8 10 -0.2 1 116.6 97.1 0.8 14 1.9 2.1 1.4 13
Korea, North 24.9 15 9 0.5 -0 26.7 27.0 1.1 51 26 4.3 2.0 22
Korea, South 50.4 9 5 0.3 0 52.2 48.1 1.0 50 2.9 4.5 1.2 15
Mongolia 2.9 28 6 2.3 -0 3.5 4.3 1.5 112 26 7.6 2.9 28
Taiwan 23.4 8 7 0.1 1 23.5 21.0 0.9 27 3.7 3.9 1.1 14
EUROPE 741 11 11 0.0 2 746 726 1.0 27 6 2.3 1.6 16
EUROPEAN UNION 507 10 10 0.0 1 517 514 1.0 25 4 2.4 1.5 16
NORTHERN EUROPE 102 12 9 0.3 2 111 119 1.2 17 3 2.3 1.8 18
Channel Islands 0.2 11 8 0.3 0 0.2 0.2 1.1 24 2.9 2.1 1.7 15
Denmark 5.6 10 9 0.1 5 5.9 6.1 1.1 14 3.0 2.0 1.7 17
Estonia 1.3 11 12 -0.1 -5 1.2 1.2 0.9 22 2.1 2.2 1.5 16
Finland 5.5 11 9 0.1 3 5.8 6.1 1.1 13 1.8 1.8 1.8 16
Iceland 0.3 13 7 0.7 5 0.4 0.4 1.3 13 1.8 2.8 1.9 21
Ireland 4.6 15 7 0.9 -7 5.2 5.7 1.2 20 3.3 3.9 2.0 22
Latvia 2.0 10 14 -0.4 -12 1.6 1.4 0.7 20 3.6 2.0 1.5 14
Lithuania 2.9 10 14 -0.4 -6 2.7 2.5 0.9 23 3.6 2.4 1.6 15
POPULATION, HEALTH, AND ENVIRONMENT DATA AND ESTIMATES FOR THE COUNTRIES AND REGIONS OF THE WORLD
World Population Data 2014

Contenu connexe

Tendances

Indian population history and profile
Indian population history and profileIndian population history and profile
Indian population history and profileTR Dilip
 
Population Of India
Population Of IndiaPopulation Of India
Population Of IndiaANUJ JAIN
 
Global population
Global populationGlobal population
Global populationpreeom1234
 
Demography of india
Demography of indiaDemography of india
Demography of indiaDeepa M K
 
Population and Economic Development
Population and Economic Development Population and Economic Development
Population and Economic Development Nithin Kumar
 
Population growth and
Population growth andPopulation growth and
Population growth andAnas Vj
 
Demographic Characteristics
Demographic CharacteristicsDemographic Characteristics
Demographic CharacteristicsRob Marchetto
 
Characteristics of Population
Characteristics of PopulationCharacteristics of Population
Characteristics of PopulationShahzad Musawwir
 
Population: A boon or a bane
Population: A boon or a banePopulation: A boon or a bane
Population: A boon or a baneviviandabu
 
Population growth & economics development in pakistan
Population growth & economics development in pakistanPopulation growth & economics development in pakistan
Population growth & economics development in pakistanzaibigrewal
 
Presentation on growing population of india
Presentation on growing population of indiaPresentation on growing population of india
Presentation on growing population of indiaBharateche15
 
Demography of india 2011(ppt)
Demography of india 2011(ppt)Demography of india 2011(ppt)
Demography of india 2011(ppt)Sk. Chand
 

Tendances (20)

Overpopulation in india
Overpopulation in indiaOverpopulation in india
Overpopulation in india
 
Indian population history and profile
Indian population history and profileIndian population history and profile
Indian population history and profile
 
Population Of India
Population Of IndiaPopulation Of India
Population Of India
 
Global population
Global populationGlobal population
Global population
 
Demography of india
Demography of indiaDemography of india
Demography of india
 
Demography
DemographyDemography
Demography
 
Population and Economic Development
Population and Economic Development Population and Economic Development
Population and Economic Development
 
Population growth and
Population growth andPopulation growth and
Population growth and
 
DEMOGRAPHY - INDIA
DEMOGRAPHY - INDIADEMOGRAPHY - INDIA
DEMOGRAPHY - INDIA
 
DEMOGRAPHY
DEMOGRAPHYDEMOGRAPHY
DEMOGRAPHY
 
Unit 4 e) Population and Development
Unit 4 e) Population and DevelopmentUnit 4 e) Population and Development
Unit 4 e) Population and Development
 
Demographic Characteristics
Demographic CharacteristicsDemographic Characteristics
Demographic Characteristics
 
Characteristics of Population
Characteristics of PopulationCharacteristics of Population
Characteristics of Population
 
Population of class 9
Population of class 9Population of class 9
Population of class 9
 
Population: A boon or a bane
Population: A boon or a banePopulation: A boon or a bane
Population: A boon or a bane
 
Population growth & economics development in pakistan
Population growth & economics development in pakistanPopulation growth & economics development in pakistan
Population growth & economics development in pakistan
 
Population
PopulationPopulation
Population
 
Presentation on growing population of india
Presentation on growing population of indiaPresentation on growing population of india
Presentation on growing population of india
 
Population ( class 9 )
Population ( class 9 )    Population ( class 9 )
Population ( class 9 )
 
Demography of india 2011(ppt)
Demography of india 2011(ppt)Demography of india 2011(ppt)
Demography of india 2011(ppt)
 

En vedette

Population ppt
Population ppt Population ppt
Population ppt SBrooker
 
3. Les avancées de la recherche sur l'atténuation des émissions de gaz à effe...
3. Les avancées de la recherche sur l'atténuation des émissions de gaz à effe...3. Les avancées de la recherche sur l'atténuation des émissions de gaz à effe...
3. Les avancées de la recherche sur l'atténuation des émissions de gaz à effe...Institut de l'Elevage - Idele
 
Solent NHS Trust Vision 2016 v2_2
Solent NHS Trust Vision 2016 v2_2Solent NHS Trust Vision 2016 v2_2
Solent NHS Trust Vision 2016 v2_2John Ashton
 
Sec 2 Ozone Depletion
Sec 2 Ozone DepletionSec 2 Ozone Depletion
Sec 2 Ozone Depletionchua.geog
 
Yemen – Impact of the protracted crisis on food and nutrition security and th...
Yemen – Impact of the protracted crisis on food and nutrition security and th...Yemen – Impact of the protracted crisis on food and nutrition security and th...
Yemen – Impact of the protracted crisis on food and nutrition security and th...FAO
 
Confronting the Food Security Threats from Climate Change -- Grand Junction
Confronting the Food Security Threats from Climate Change -- Grand JunctionConfronting the Food Security Threats from Climate Change -- Grand Junction
Confronting the Food Security Threats from Climate Change -- Grand JunctionConservationColorado
 
Social Betting, The Biggest Threat to Corporate Bookmakers
Social Betting, The Biggest Threat to Corporate BookmakersSocial Betting, The Biggest Threat to Corporate Bookmakers
Social Betting, The Biggest Threat to Corporate Bookmakersfavourit
 
Volleyball League Plan
Volleyball League PlanVolleyball League Plan
Volleyball League PlanSierra Gruss
 
Global livestock trends—the past may not always predict the future
Global livestock trends—the past may not always predict the futureGlobal livestock trends—the past may not always predict the future
Global livestock trends—the past may not always predict the futureILRI
 
Types of maps
Types of mapsTypes of maps
Types of mapsrrodri37
 

En vedette (15)

Population ppt
Population ppt Population ppt
Population ppt
 
3. Les avancées de la recherche sur l'atténuation des émissions de gaz à effe...
3. Les avancées de la recherche sur l'atténuation des émissions de gaz à effe...3. Les avancées de la recherche sur l'atténuation des émissions de gaz à effe...
3. Les avancées de la recherche sur l'atténuation des émissions de gaz à effe...
 
Solent NHS Trust Vision 2016 v2_2
Solent NHS Trust Vision 2016 v2_2Solent NHS Trust Vision 2016 v2_2
Solent NHS Trust Vision 2016 v2_2
 
Sec 2 Ozone Depletion
Sec 2 Ozone DepletionSec 2 Ozone Depletion
Sec 2 Ozone Depletion
 
US Grains Council, Food 2040
US Grains Council, Food 2040US Grains Council, Food 2040
US Grains Council, Food 2040
 
Yemen – Impact of the protracted crisis on food and nutrition security and th...
Yemen – Impact of the protracted crisis on food and nutrition security and th...Yemen – Impact of the protracted crisis on food and nutrition security and th...
Yemen – Impact of the protracted crisis on food and nutrition security and th...
 
Confronting the Food Security Threats from Climate Change -- Grand Junction
Confronting the Food Security Threats from Climate Change -- Grand JunctionConfronting the Food Security Threats from Climate Change -- Grand Junction
Confronting the Food Security Threats from Climate Change -- Grand Junction
 
Problema 3.31 mejorado
Problema 3.31 mejoradoProblema 3.31 mejorado
Problema 3.31 mejorado
 
Samyak Veera
Samyak VeeraSamyak Veera
Samyak Veera
 
Presentation_NEW.PPTX
Presentation_NEW.PPTXPresentation_NEW.PPTX
Presentation_NEW.PPTX
 
Social Betting, The Biggest Threat to Corporate Bookmakers
Social Betting, The Biggest Threat to Corporate BookmakersSocial Betting, The Biggest Threat to Corporate Bookmakers
Social Betting, The Biggest Threat to Corporate Bookmakers
 
Volleyball League Plan
Volleyball League PlanVolleyball League Plan
Volleyball League Plan
 
Diploma
DiplomaDiploma
Diploma
 
Global livestock trends—the past may not always predict the future
Global livestock trends—the past may not always predict the futureGlobal livestock trends—the past may not always predict the future
Global livestock trends—the past may not always predict the future
 
Types of maps
Types of mapsTypes of maps
Types of maps
 

Similaire à World Population Data 2014

The Shock of the New? Britain in 2015
The Shock of the New? Britain in 2015The Shock of the New? Britain in 2015
The Shock of the New? Britain in 2015Ipsos UK
 
Population statistics
Population statisticsPopulation statistics
Population statisticsmrbruns
 
Population statistics
Population statisticsPopulation statistics
Population statisticsmrbruns
 
World Health Statistics 2014 - A Wealth of Information on Global Public Healt...
World Health Statistics 2014 - A Wealth of Information on Global Public Healt...World Health Statistics 2014 - A Wealth of Information on Global Public Healt...
World Health Statistics 2014 - A Wealth of Information on Global Public Healt...MedicReS
 
populacion de el mundo
populacion de el mundopopulacion de el mundo
populacion de el mundoPeio10
 
Index-2015-low-res-final 11 August 2015
Index-2015-low-res-final 11 August 2015Index-2015-low-res-final 11 August 2015
Index-2015-low-res-final 11 August 2015Jane Scobie
 
Datos de la población mundial 2015. (Population Reference Bureau) 2015 worl...
Datos de la población mundial 2015. (Population Reference Bureau)   2015 worl...Datos de la población mundial 2015. (Population Reference Bureau)   2015 worl...
Datos de la población mundial 2015. (Population Reference Bureau) 2015 worl...Juan Martín Martín
 
Body Code Animation Visualizing the Code of LifeBya.docx
Body Code Animation Visualizing the Code of LifeBya.docxBody Code Animation Visualizing the Code of LifeBya.docx
Body Code Animation Visualizing the Code of LifeBya.docxjasoninnes20
 
2. MDG and marginal budget in sudan health
2. MDG and marginal budget in sudan health2. MDG and marginal budget in sudan health
2. MDG and marginal budget in sudan healthMafaxPharma
 
Population growth and linkage with poverty and Infectious diseases.
Population growth and linkage with poverty and Infectious diseases.Population growth and linkage with poverty and Infectious diseases.
Population growth and linkage with poverty and Infectious diseases.prakashtu
 
Analysis of Population and Food Growth
Analysis of Population and Food GrowthAnalysis of Population and Food Growth
Analysis of Population and Food GrowthKarl Obispo
 
The Millennium Development Goals Report 2014
The Millennium Development Goals Report 2014The Millennium Development Goals Report 2014
The Millennium Development Goals Report 2014Dr Lendy Spires
 
5638GEOGRAPHY-OF-INDIA-POPULATION-GROWTH-CC7-UNIT-1-3-09-09-2020.pptx
5638GEOGRAPHY-OF-INDIA-POPULATION-GROWTH-CC7-UNIT-1-3-09-09-2020.pptx5638GEOGRAPHY-OF-INDIA-POPULATION-GROWTH-CC7-UNIT-1-3-09-09-2020.pptx
5638GEOGRAPHY-OF-INDIA-POPULATION-GROWTH-CC7-UNIT-1-3-09-09-2020.pptxRachnaKotiyal1
 
CAMBRIDGE AS GEOGRAPHY REVISION: POPULATION - 4.2 DEMOGRAPHIC TRANSITION
CAMBRIDGE AS GEOGRAPHY REVISION: POPULATION - 4.2 DEMOGRAPHIC TRANSITIONCAMBRIDGE AS GEOGRAPHY REVISION: POPULATION - 4.2 DEMOGRAPHIC TRANSITION
CAMBRIDGE AS GEOGRAPHY REVISION: POPULATION - 4.2 DEMOGRAPHIC TRANSITIONGeorge Dumitrache
 
0921 105版人口推估報告 英文版
0921 105版人口推估報告 英文版0921 105版人口推估報告 英文版
0921 105版人口推估報告 英文版Maulik Patel
 
Millennium Development Goals, Targets and Indicators
Millennium Development Goals, Targets and IndicatorsMillennium Development Goals, Targets and Indicators
Millennium Development Goals, Targets and IndicatorsTejaswi Subramanian
 

Similaire à World Population Data 2014 (20)

Aging Demographics
Aging DemographicsAging Demographics
Aging Demographics
 
The Shock of the New? Britain in 2015
The Shock of the New? Britain in 2015The Shock of the New? Britain in 2015
The Shock of the New? Britain in 2015
 
Population statistics
Population statisticsPopulation statistics
Population statistics
 
Population statistics
Population statisticsPopulation statistics
Population statistics
 
World Health Statistics 2014 - A Wealth of Information on Global Public Healt...
World Health Statistics 2014 - A Wealth of Information on Global Public Healt...World Health Statistics 2014 - A Wealth of Information on Global Public Healt...
World Health Statistics 2014 - A Wealth of Information on Global Public Healt...
 
populacion de el mundo
populacion de el mundopopulacion de el mundo
populacion de el mundo
 
Index-2015-low-res-final 11 August 2015
Index-2015-low-res-final 11 August 2015Index-2015-low-res-final 11 August 2015
Index-2015-low-res-final 11 August 2015
 
Datos de la población mundial 2015. (Population Reference Bureau) 2015 worl...
Datos de la población mundial 2015. (Population Reference Bureau)   2015 worl...Datos de la población mundial 2015. (Population Reference Bureau)   2015 worl...
Datos de la población mundial 2015. (Population Reference Bureau) 2015 worl...
 
Child Protection Safety Net Project. Albania
Child Protection Safety Net Project. AlbaniaChild Protection Safety Net Project. Albania
Child Protection Safety Net Project. Albania
 
Body Code Animation Visualizing the Code of LifeBya.docx
Body Code Animation Visualizing the Code of LifeBya.docxBody Code Animation Visualizing the Code of LifeBya.docx
Body Code Animation Visualizing the Code of LifeBya.docx
 
2. MDG and marginal budget in sudan health
2. MDG and marginal budget in sudan health2. MDG and marginal budget in sudan health
2. MDG and marginal budget in sudan health
 
Population growth and linkage with poverty and Infectious diseases.
Population growth and linkage with poverty and Infectious diseases.Population growth and linkage with poverty and Infectious diseases.
Population growth and linkage with poverty and Infectious diseases.
 
Analysis of Population and Food Growth
Analysis of Population and Food GrowthAnalysis of Population and Food Growth
Analysis of Population and Food Growth
 
The Millennium Development Goals Report 2014
The Millennium Development Goals Report 2014The Millennium Development Goals Report 2014
The Millennium Development Goals Report 2014
 
MDG Rport 2014
MDG Rport 2014MDG Rport 2014
MDG Rport 2014
 
Levels & Trends in Child Mortality
Levels & Trends in Child MortalityLevels & Trends in Child Mortality
Levels & Trends in Child Mortality
 
5638GEOGRAPHY-OF-INDIA-POPULATION-GROWTH-CC7-UNIT-1-3-09-09-2020.pptx
5638GEOGRAPHY-OF-INDIA-POPULATION-GROWTH-CC7-UNIT-1-3-09-09-2020.pptx5638GEOGRAPHY-OF-INDIA-POPULATION-GROWTH-CC7-UNIT-1-3-09-09-2020.pptx
5638GEOGRAPHY-OF-INDIA-POPULATION-GROWTH-CC7-UNIT-1-3-09-09-2020.pptx
 
CAMBRIDGE AS GEOGRAPHY REVISION: POPULATION - 4.2 DEMOGRAPHIC TRANSITION
CAMBRIDGE AS GEOGRAPHY REVISION: POPULATION - 4.2 DEMOGRAPHIC TRANSITIONCAMBRIDGE AS GEOGRAPHY REVISION: POPULATION - 4.2 DEMOGRAPHIC TRANSITION
CAMBRIDGE AS GEOGRAPHY REVISION: POPULATION - 4.2 DEMOGRAPHIC TRANSITION
 
0921 105版人口推估報告 英文版
0921 105版人口推估報告 英文版0921 105版人口推估報告 英文版
0921 105版人口推估報告 英文版
 
Millennium Development Goals, Targets and Indicators
Millennium Development Goals, Targets and IndicatorsMillennium Development Goals, Targets and Indicators
Millennium Development Goals, Targets and Indicators
 

Plus de Oliver Grave

List of-approved-philippine-offshore-gaming-operators
List of-approved-philippine-offshore-gaming-operatorsList of-approved-philippine-offshore-gaming-operators
List of-approved-philippine-offshore-gaming-operatorsOliver Grave
 
Global Powers of Retailing Deloitte 2018
Global Powers of Retailing Deloitte 2018Global Powers of Retailing Deloitte 2018
Global Powers of Retailing Deloitte 2018Oliver Grave
 
Gaming For Africa August / September 2017
Gaming For Africa August / September 2017Gaming For Africa August / September 2017
Gaming For Africa August / September 2017Oliver Grave
 
2017 Global Retail Development Index - ATKearney
2017 Global Retail Development Index - ATKearney2017 Global Retail Development Index - ATKearney
2017 Global Retail Development Index - ATKearneyOliver Grave
 
Major Gaming Operations - AMERCIAS
Major Gaming Operations - AMERCIASMajor Gaming Operations - AMERCIAS
Major Gaming Operations - AMERCIASOliver Grave
 
Major Gaming Operations - ASIA / EURASIA
Major Gaming Operations - ASIA / EURASIAMajor Gaming Operations - ASIA / EURASIA
Major Gaming Operations - ASIA / EURASIAOliver Grave
 
Major Gaming Operations - EUROPE
Major Gaming Operations - EUROPEMajor Gaming Operations - EUROPE
Major Gaming Operations - EUROPEOliver Grave
 
Major Gaming Operations - AFRICA
Major Gaming Operations - AFRICAMajor Gaming Operations - AFRICA
Major Gaming Operations - AFRICAOliver Grave
 
Deloitte Global-Powers-of-Retailing 2017
Deloitte Global-Powers-of-Retailing 2017Deloitte Global-Powers-of-Retailing 2017
Deloitte Global-Powers-of-Retailing 2017Oliver Grave
 
Payments & Infrastructure - Part II. Verifone
Payments & Infrastructure - Part II. VerifonePayments & Infrastructure - Part II. Verifone
Payments & Infrastructure - Part II. VerifoneOliver Grave
 
Payments & Infrastructure - Part I. Verifone
Payments & Infrastructure - Part I. VerifonePayments & Infrastructure - Part I. Verifone
Payments & Infrastructure - Part I. VerifoneOliver Grave
 
eGaming Summit KPMG 2016
eGaming Summit KPMG 2016eGaming Summit KPMG 2016
eGaming Summit KPMG 2016Oliver Grave
 
Off Grid Solar Market Trends 2016 - Bloomberg - World Bank
Off Grid Solar Market Trends 2016 - Bloomberg - World BankOff Grid Solar Market Trends 2016 - Bloomberg - World Bank
Off Grid Solar Market Trends 2016 - Bloomberg - World BankOliver Grave
 
The WLA Global Lottery Data 2015
The WLA Global Lottery Data 2015The WLA Global Lottery Data 2015
The WLA Global Lottery Data 2015Oliver Grave
 
Shopping in America - Between Bentonville and Bezos - The Economist
Shopping in America - Between Bentonville and Bezos - The EconomistShopping in America - Between Bentonville and Bezos - The Economist
Shopping in America - Between Bentonville and Bezos - The EconomistOliver Grave
 
iTNERGAMING 04-2016
iTNERGAMING 04-2016iTNERGAMING 04-2016
iTNERGAMING 04-2016Oliver Grave
 
THE ECONOMIST - CREATING GROWTH IN A FLAT WORLD
THE ECONOMIST - CREATING GROWTH IN A FLAT WORLDTHE ECONOMIST - CREATING GROWTH IN A FLAT WORLD
THE ECONOMIST - CREATING GROWTH IN A FLAT WORLDOliver Grave
 
The 2016 Global Retail Development Index - ATKearney 2016
The 2016 Global Retail Development Index - ATKearney 2016The 2016 Global Retail Development Index - ATKearney 2016
The 2016 Global Retail Development Index - ATKearney 2016Oliver Grave
 
State of the Web in 2016 - Mary Meeker
State of the Web in 2016 - Mary MeekerState of the Web in 2016 - Mary Meeker
State of the Web in 2016 - Mary MeekerOliver Grave
 
PwC Consumer Intelligence eSports
PwC Consumer Intelligence eSportsPwC Consumer Intelligence eSports
PwC Consumer Intelligence eSportsOliver Grave
 

Plus de Oliver Grave (20)

List of-approved-philippine-offshore-gaming-operators
List of-approved-philippine-offshore-gaming-operatorsList of-approved-philippine-offshore-gaming-operators
List of-approved-philippine-offshore-gaming-operators
 
Global Powers of Retailing Deloitte 2018
Global Powers of Retailing Deloitte 2018Global Powers of Retailing Deloitte 2018
Global Powers of Retailing Deloitte 2018
 
Gaming For Africa August / September 2017
Gaming For Africa August / September 2017Gaming For Africa August / September 2017
Gaming For Africa August / September 2017
 
2017 Global Retail Development Index - ATKearney
2017 Global Retail Development Index - ATKearney2017 Global Retail Development Index - ATKearney
2017 Global Retail Development Index - ATKearney
 
Major Gaming Operations - AMERCIAS
Major Gaming Operations - AMERCIASMajor Gaming Operations - AMERCIAS
Major Gaming Operations - AMERCIAS
 
Major Gaming Operations - ASIA / EURASIA
Major Gaming Operations - ASIA / EURASIAMajor Gaming Operations - ASIA / EURASIA
Major Gaming Operations - ASIA / EURASIA
 
Major Gaming Operations - EUROPE
Major Gaming Operations - EUROPEMajor Gaming Operations - EUROPE
Major Gaming Operations - EUROPE
 
Major Gaming Operations - AFRICA
Major Gaming Operations - AFRICAMajor Gaming Operations - AFRICA
Major Gaming Operations - AFRICA
 
Deloitte Global-Powers-of-Retailing 2017
Deloitte Global-Powers-of-Retailing 2017Deloitte Global-Powers-of-Retailing 2017
Deloitte Global-Powers-of-Retailing 2017
 
Payments & Infrastructure - Part II. Verifone
Payments & Infrastructure - Part II. VerifonePayments & Infrastructure - Part II. Verifone
Payments & Infrastructure - Part II. Verifone
 
Payments & Infrastructure - Part I. Verifone
Payments & Infrastructure - Part I. VerifonePayments & Infrastructure - Part I. Verifone
Payments & Infrastructure - Part I. Verifone
 
eGaming Summit KPMG 2016
eGaming Summit KPMG 2016eGaming Summit KPMG 2016
eGaming Summit KPMG 2016
 
Off Grid Solar Market Trends 2016 - Bloomberg - World Bank
Off Grid Solar Market Trends 2016 - Bloomberg - World BankOff Grid Solar Market Trends 2016 - Bloomberg - World Bank
Off Grid Solar Market Trends 2016 - Bloomberg - World Bank
 
The WLA Global Lottery Data 2015
The WLA Global Lottery Data 2015The WLA Global Lottery Data 2015
The WLA Global Lottery Data 2015
 
Shopping in America - Between Bentonville and Bezos - The Economist
Shopping in America - Between Bentonville and Bezos - The EconomistShopping in America - Between Bentonville and Bezos - The Economist
Shopping in America - Between Bentonville and Bezos - The Economist
 
iTNERGAMING 04-2016
iTNERGAMING 04-2016iTNERGAMING 04-2016
iTNERGAMING 04-2016
 
THE ECONOMIST - CREATING GROWTH IN A FLAT WORLD
THE ECONOMIST - CREATING GROWTH IN A FLAT WORLDTHE ECONOMIST - CREATING GROWTH IN A FLAT WORLD
THE ECONOMIST - CREATING GROWTH IN A FLAT WORLD
 
The 2016 Global Retail Development Index - ATKearney 2016
The 2016 Global Retail Development Index - ATKearney 2016The 2016 Global Retail Development Index - ATKearney 2016
The 2016 Global Retail Development Index - ATKearney 2016
 
State of the Web in 2016 - Mary Meeker
State of the Web in 2016 - Mary MeekerState of the Web in 2016 - Mary Meeker
State of the Web in 2016 - Mary Meeker
 
PwC Consumer Intelligence eSports
PwC Consumer Intelligence eSportsPwC Consumer Intelligence eSports
PwC Consumer Intelligence eSports
 

Dernier

CebaBaby dropshipping via API with DroFX.pptx
CebaBaby dropshipping via API with DroFX.pptxCebaBaby dropshipping via API with DroFX.pptx
CebaBaby dropshipping via API with DroFX.pptxolyaivanovalion
 
Ravak dropshipping via API with DroFx.pptx
Ravak dropshipping via API with DroFx.pptxRavak dropshipping via API with DroFx.pptx
Ravak dropshipping via API with DroFx.pptxolyaivanovalion
 
Call Girls in Sarai Kale Khan Delhi 💯 Call Us 🔝9205541914 🔝( Delhi) Escorts S...
Call Girls in Sarai Kale Khan Delhi 💯 Call Us 🔝9205541914 🔝( Delhi) Escorts S...Call Girls in Sarai Kale Khan Delhi 💯 Call Us 🔝9205541914 🔝( Delhi) Escorts S...
Call Girls in Sarai Kale Khan Delhi 💯 Call Us 🔝9205541914 🔝( Delhi) Escorts S...Delhi Call girls
 
Accredited-Transport-Cooperatives-Jan-2021-Web.pdf
Accredited-Transport-Cooperatives-Jan-2021-Web.pdfAccredited-Transport-Cooperatives-Jan-2021-Web.pdf
Accredited-Transport-Cooperatives-Jan-2021-Web.pdfadriantubila
 
Generative AI on Enterprise Cloud with NiFi and Milvus
Generative AI on Enterprise Cloud with NiFi and MilvusGenerative AI on Enterprise Cloud with NiFi and Milvus
Generative AI on Enterprise Cloud with NiFi and MilvusTimothy Spann
 
Call me @ 9892124323 Cheap Rate Call Girls in Vashi with Real Photo 100% Secure
Call me @ 9892124323  Cheap Rate Call Girls in Vashi with Real Photo 100% SecureCall me @ 9892124323  Cheap Rate Call Girls in Vashi with Real Photo 100% Secure
Call me @ 9892124323 Cheap Rate Call Girls in Vashi with Real Photo 100% SecurePooja Nehwal
 
Call Girls Bannerghatta Road Just Call 👗 7737669865 👗 Top Class Call Girl Ser...
Call Girls Bannerghatta Road Just Call 👗 7737669865 👗 Top Class Call Girl Ser...Call Girls Bannerghatta Road Just Call 👗 7737669865 👗 Top Class Call Girl Ser...
Call Girls Bannerghatta Road Just Call 👗 7737669865 👗 Top Class Call Girl Ser...amitlee9823
 
Carero dropshipping via API with DroFx.pptx
Carero dropshipping via API with DroFx.pptxCarero dropshipping via API with DroFx.pptx
Carero dropshipping via API with DroFx.pptxolyaivanovalion
 
Edukaciniai dropshipping via API with DroFx
Edukaciniai dropshipping via API with DroFxEdukaciniai dropshipping via API with DroFx
Edukaciniai dropshipping via API with DroFxolyaivanovalion
 
BigBuy dropshipping via API with DroFx.pptx
BigBuy dropshipping via API with DroFx.pptxBigBuy dropshipping via API with DroFx.pptx
BigBuy dropshipping via API with DroFx.pptxolyaivanovalion
 
Week-01-2.ppt BBB human Computer interaction
Week-01-2.ppt BBB human Computer interactionWeek-01-2.ppt BBB human Computer interaction
Week-01-2.ppt BBB human Computer interactionfulawalesam
 
Digital Advertising Lecture for Advanced Digital & Social Media Strategy at U...
Digital Advertising Lecture for Advanced Digital & Social Media Strategy at U...Digital Advertising Lecture for Advanced Digital & Social Media Strategy at U...
Digital Advertising Lecture for Advanced Digital & Social Media Strategy at U...Valters Lauzums
 
Discover Why Less is More in B2B Research
Discover Why Less is More in B2B ResearchDiscover Why Less is More in B2B Research
Discover Why Less is More in B2B Researchmichael115558
 
Vip Model Call Girls (Delhi) Karol Bagh 9711199171✔️Body to body massage wit...
Vip Model  Call Girls (Delhi) Karol Bagh 9711199171✔️Body to body massage wit...Vip Model  Call Girls (Delhi) Karol Bagh 9711199171✔️Body to body massage wit...
Vip Model Call Girls (Delhi) Karol Bagh 9711199171✔️Body to body massage wit...shivangimorya083
 
Call Girls Hsr Layout Just Call 👗 7737669865 👗 Top Class Call Girl Service Ba...
Call Girls Hsr Layout Just Call 👗 7737669865 👗 Top Class Call Girl Service Ba...Call Girls Hsr Layout Just Call 👗 7737669865 👗 Top Class Call Girl Service Ba...
Call Girls Hsr Layout Just Call 👗 7737669865 👗 Top Class Call Girl Service Ba...amitlee9823
 
Midocean dropshipping via API with DroFx
Midocean dropshipping via API with DroFxMidocean dropshipping via API with DroFx
Midocean dropshipping via API with DroFxolyaivanovalion
 
Best VIP Call Girls Noida Sector 39 Call Me: 8448380779
Best VIP Call Girls Noida Sector 39 Call Me: 8448380779Best VIP Call Girls Noida Sector 39 Call Me: 8448380779
Best VIP Call Girls Noida Sector 39 Call Me: 8448380779Delhi Call girls
 

Dernier (20)

CebaBaby dropshipping via API with DroFX.pptx
CebaBaby dropshipping via API with DroFX.pptxCebaBaby dropshipping via API with DroFX.pptx
CebaBaby dropshipping via API with DroFX.pptx
 
Ravak dropshipping via API with DroFx.pptx
Ravak dropshipping via API with DroFx.pptxRavak dropshipping via API with DroFx.pptx
Ravak dropshipping via API with DroFx.pptx
 
Call Girls in Sarai Kale Khan Delhi 💯 Call Us 🔝9205541914 🔝( Delhi) Escorts S...
Call Girls in Sarai Kale Khan Delhi 💯 Call Us 🔝9205541914 🔝( Delhi) Escorts S...Call Girls in Sarai Kale Khan Delhi 💯 Call Us 🔝9205541914 🔝( Delhi) Escorts S...
Call Girls in Sarai Kale Khan Delhi 💯 Call Us 🔝9205541914 🔝( Delhi) Escorts S...
 
Accredited-Transport-Cooperatives-Jan-2021-Web.pdf
Accredited-Transport-Cooperatives-Jan-2021-Web.pdfAccredited-Transport-Cooperatives-Jan-2021-Web.pdf
Accredited-Transport-Cooperatives-Jan-2021-Web.pdf
 
Generative AI on Enterprise Cloud with NiFi and Milvus
Generative AI on Enterprise Cloud with NiFi and MilvusGenerative AI on Enterprise Cloud with NiFi and Milvus
Generative AI on Enterprise Cloud with NiFi and Milvus
 
CHEAP Call Girls in Saket (-DELHI )🔝 9953056974🔝(=)/CALL GIRLS SERVICE
CHEAP Call Girls in Saket (-DELHI )🔝 9953056974🔝(=)/CALL GIRLS SERVICECHEAP Call Girls in Saket (-DELHI )🔝 9953056974🔝(=)/CALL GIRLS SERVICE
CHEAP Call Girls in Saket (-DELHI )🔝 9953056974🔝(=)/CALL GIRLS SERVICE
 
Call me @ 9892124323 Cheap Rate Call Girls in Vashi with Real Photo 100% Secure
Call me @ 9892124323  Cheap Rate Call Girls in Vashi with Real Photo 100% SecureCall me @ 9892124323  Cheap Rate Call Girls in Vashi with Real Photo 100% Secure
Call me @ 9892124323 Cheap Rate Call Girls in Vashi with Real Photo 100% Secure
 
Call Girls Bannerghatta Road Just Call 👗 7737669865 👗 Top Class Call Girl Ser...
Call Girls Bannerghatta Road Just Call 👗 7737669865 👗 Top Class Call Girl Ser...Call Girls Bannerghatta Road Just Call 👗 7737669865 👗 Top Class Call Girl Ser...
Call Girls Bannerghatta Road Just Call 👗 7737669865 👗 Top Class Call Girl Ser...
 
Carero dropshipping via API with DroFx.pptx
Carero dropshipping via API with DroFx.pptxCarero dropshipping via API with DroFx.pptx
Carero dropshipping via API with DroFx.pptx
 
Edukaciniai dropshipping via API with DroFx
Edukaciniai dropshipping via API with DroFxEdukaciniai dropshipping via API with DroFx
Edukaciniai dropshipping via API with DroFx
 
BigBuy dropshipping via API with DroFx.pptx
BigBuy dropshipping via API with DroFx.pptxBigBuy dropshipping via API with DroFx.pptx
BigBuy dropshipping via API with DroFx.pptx
 
Week-01-2.ppt BBB human Computer interaction
Week-01-2.ppt BBB human Computer interactionWeek-01-2.ppt BBB human Computer interaction
Week-01-2.ppt BBB human Computer interaction
 
Digital Advertising Lecture for Advanced Digital & Social Media Strategy at U...
Digital Advertising Lecture for Advanced Digital & Social Media Strategy at U...Digital Advertising Lecture for Advanced Digital & Social Media Strategy at U...
Digital Advertising Lecture for Advanced Digital & Social Media Strategy at U...
 
Discover Why Less is More in B2B Research
Discover Why Less is More in B2B ResearchDiscover Why Less is More in B2B Research
Discover Why Less is More in B2B Research
 
Vip Model Call Girls (Delhi) Karol Bagh 9711199171✔️Body to body massage wit...
Vip Model  Call Girls (Delhi) Karol Bagh 9711199171✔️Body to body massage wit...Vip Model  Call Girls (Delhi) Karol Bagh 9711199171✔️Body to body massage wit...
Vip Model Call Girls (Delhi) Karol Bagh 9711199171✔️Body to body massage wit...
 
Call Girls Hsr Layout Just Call 👗 7737669865 👗 Top Class Call Girl Service Ba...
Call Girls Hsr Layout Just Call 👗 7737669865 👗 Top Class Call Girl Service Ba...Call Girls Hsr Layout Just Call 👗 7737669865 👗 Top Class Call Girl Service Ba...
Call Girls Hsr Layout Just Call 👗 7737669865 👗 Top Class Call Girl Service Ba...
 
Midocean dropshipping via API with DroFx
Midocean dropshipping via API with DroFxMidocean dropshipping via API with DroFx
Midocean dropshipping via API with DroFx
 
Best VIP Call Girls Noida Sector 39 Call Me: 8448380779
Best VIP Call Girls Noida Sector 39 Call Me: 8448380779Best VIP Call Girls Noida Sector 39 Call Me: 8448380779
Best VIP Call Girls Noida Sector 39 Call Me: 8448380779
 
Sampling (random) method and Non random.ppt
Sampling (random) method and Non random.pptSampling (random) method and Non random.ppt
Sampling (random) method and Non random.ppt
 
Call Girls In Shalimar Bagh ( Delhi) 9953330565 Escorts Service
Call Girls In Shalimar Bagh ( Delhi) 9953330565 Escorts ServiceCall Girls In Shalimar Bagh ( Delhi) 9953330565 Escorts Service
Call Girls In Shalimar Bagh ( Delhi) 9953330565 Escorts Service
 

World Population Data 2014

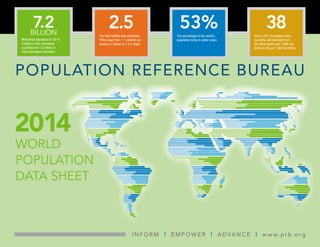
  • 1. POPULATION REFERENCE BUREAU I N F O R M | E M P O W E R | A DVA N C E | w w w. p r b .o r g 7.2BILLION Worldwide population in 2014; 6 billion in less developed countries and 1.2 billion in more developed countries. 2.5The total fertility rate worldwide. TFRs range from 1.1 children per woman in Taiwan to 7.6 in Niger. 38Since 1970, the global infant mortality rate declined from 80 infant deaths per 1,000 live births to 38 per 1,000 live births. 53%The percentage of the world’s population living in urban areas. WORLD POPULATION DATA SHEET 2014
  • 2. © 2014 Population Reference Bureau See notes on page 18 2014 WORLD POPULATION DATA SHEET 2 MOST POPULOUS COUNTRIES, 2014 AND 2050 2014 2050 COUNTRIES WITH THE HIGHEST AND LOWEST TOTAL FERTILITY RATES COUNTRY POPULATION (MILLIONS) India 1,657 China 1,312 Nigeria 396 United States 395 Indonesia 365 Pakistan 348 Brazil 226 Bangladesh 202 Congo, Dem. Rep. 194 Ethiopia 165 COUNTRY POPULATION (MILLIONS) China 1,364 India 1,296 United States 318 Indonesia 251 Brazil 203 Pakistan 194 Nigeria 177 Bangladesh 158 Russia 144 Japan 127 HIGHEST IN 2013 TFR 2013 1970 Niger 7.6 7.4 South Sudan 7.0 6.9 Somalia 6.6 7.2 Chad 6.6 6.5 Congo, Dem. Rep. 6.6 6.2 Central African Republic 6.2 6.0 Angola 6.2 7.3 Mali 6.1 6.9 Burundi 6.1 7.3 Zambia 6.0 7.4 LOWEST IN 2013 TFR 2013 1970 Taiwan 1.1 3.9 Portugal 1.2 3.0 Singapore 1.2 3.2 Korea, South 1.2 4.5 Moldova 1.2 2.6 Poland 1.2 2.3 Bosnia-Herzegovina 1.3 2.7 Spain 1.3 2.9 Greece 1.3 2.4 Hungary 1.3 2.0 Slovakia 1.3 2.4 Romania 1.3 2.9 NOTE: 2013 data refer to latest data available.
  • 3. © 2014 Population Reference Bureau See notes on page 18 2014 WORLD POPULATION DATA SHEET 3 POPULATION CLOCK, 2014 WORLD MORE DEVELOPED COUNTRIES LESS DEVELOPED COUNTRIES Population 7,238,184,000 1,248,958,000 5,989,225,000 Births per Year 143,341,000 13,794,000 129,547,000 Day 392,714 37,792 354,923 Minute 273 26 246 Deaths per Year 56,759,000 12,328,000 44,432,000 Day 155,505 33,775 121,730 Minute 108 23 85 Natural increase per Year 86,581,000 1,466,000 85,115,000 Day 237,209 4,017 233,193 Minute 165 3 162 Infant deaths per Year 5,507,000 72,000 5,435,000 Day 15,087 197 14,890 Minute 10 0.1 10
  • 4. © 2014 Population Reference Bureau See notes on page 18 2014 WORLD POPULATION DATA SHEET 4 W O R L D P O P U L A T I O N H I G H L I G H T S F O C U S O N P R O G R E S S A N D C H A L L E N G E S Extreme Poverty Rate Falls in Many Countries. MDG 1: ERADICATE EXTREME POVERTY AND HUNGER In 2010, five years ahead of the target date of 2015, the world reached the United Nations Millennium Development Goal 1: cutting in half the proportion of people living in extreme poverty. While this global progress is outstanding, progress in particular countries and regions is not as strong. Globally, 1.2 billion people still live on less than $1.25 a day, and disproportionately large numbers of them live in southern Asia and sub-Saharan Africa. While the rate of extreme poverty fell significantly in China and India, their large populations (more than 2.5 billion combined) mean that they are two of the top five countries that have the largest share of the global extreme poor. SOURCE: World Bank, “Poverty Headcount Ratio at $1.25 a Day (PPP),” accessed at http://data.worldbank.org/indicator/SI.POV.DDAY. Child Mortality Rates Decline Steadily Across Much of the World. MDG 4: REDUCE CHILD MORTALITY The child mortality rate is the number of deaths of children under 5 per 1,000 live births. The United Nations set a target for Millennium Development Goal 4: to reduce by two-thirds, between 1990 and 2015, the under-5 mortality rate. Across the globe, many countries have made significant progress in reducing child mortality. For example, child mortality in Bangladesh declined from 144 child deaths per 1,000 live births to 41, a reduction of 72 percent. The global rate in 2012 was almost one-half its 1990 rate, declining from 90 deaths per 1,000 live births to 48 in 2012. Despite these gains, many countries will fall short of the MDG target, and further progress is needed across much of sub-Saharan Africa and South Asia. SOURCE: UN Inter-agency Group for Child Mortality Estimation, “Under-Five Mortality Estimates: Rates” (September 2013), accessed at www.childmortality.org. 1988-1992 2008-2012 47 22 World 62 12 China 37 20 Honduras 54 33 India 54 19 Indonesia 66 30 Senegal 69 38 Uganda Percent of Population Living on Less Than $1.25/Day Congo, Dem. Rep. (15%) Somalia (17%) Angola (23%) Vietnam (54%) Algeria (60%) Uganda (61%) Tanzania (68%) Bangladesh (72%) China (74%) Egypt (75%) Peru (77%) Kenya (26%) Papua New Guinea (29%) Burkina Faso (49%) Yemen (52%) 66% or Greater Reduction 33% – 65% Reduction Less Than 33% Reduction 18 14 41 54 69 20 23 60 102 63 73 164 147 146 21 79 54 144 50 51 171 177 213 98 89 202 125 178 166 86 Deaths of Children Under 5 per 1,000 Live Births (2012 data appear inside bars; 1990 data are italicized)
  • 5. © 2014 Population Reference Bureau See notes on page 18 2014 WORLD POPULATION DATA SHEET 5 1970 Male Female 2014 Male Female Age Structure Has Changed Differently Across Regions Between 1970 and 2014. In 1970, just under one-half (48 percent) of the world’s population was younger than 20, a nearly equal percentage was ages 20 to 64, and only 5 percent was 65 and older. Today, as a result of lower fertility rates and longer life expectancy, the share of global population under age 20 has dropped to about 35 percent, the population between ages 20 and 64 represent 58 percent, and ages 65 and older represent 7 percent. Asia, Latin America, and Oceania all have population age structures similar to the global averages. In 1970, Europe and North America were similar to the world average today, and their slower growth resulted in a current population much older than the global average. Africa’s population is at the other end of the age spectrum—Africa’s current youthful age structure is much like the global average in 1970. SOURCE: United Nations Population Division, World Population Prospects: The 2012 Revision (New York: United Nations, 2013). W O R L D P O P U L A T I O N H I G H L I G H T S F O C U S O N P R O G R E S S A N D C H A L L E N G E S 10% 8% 6% 4% 2% 0% 2% 4% 6% 8% 10% 0-4 5-9 10-14 15-19 20-24 25-29 30-34 35-39 40-44 45-49 50-54 55-59 60-64 65-69 70-74 75-79 80+ Percent of Population Latin America Caribbean 10% 8% 6% 4% 2% 0% 2% 4% 6% 8% 10% 0-4 5-9 10-14 15-19 20-24 25-29 30-34 35-39 40-44 45-49 50-54 55-59 60-64 65-69 70-74 75-79 80+ Percent of Population Africa 10% 8% 6% 4% 2% 0% 2% 4% 6% 8% 10% 0-4 5-9 10-14 15-19 20-24 25-29 30-34 35-39 40-44 45-49 50-54 55-59 60-64 65-69 70-74 75-79 80+ Percent of Population North America 10% 8% 6% 4% 2% 0% 2% 4% 6% 8% 10% 0-4 5-9 10-14 15-19 20-24 25-29 30-34 35-39 40-44 45-49 50-54 55-59 60-64 65-69 70-74 75-79 80+ Percent of Population Asia 10% 8% 6% 4% 2% 0% 2% 4% 6% 8% 10% 0-4 5-9 10-14 15-19 20-24 25-29 30-34 35-39 40-44 45-49 50-54 55-59 60-64 65-69 70-74 75-79 80+ Percent of Population Oceania 10% 8% 6% 4% 2% 0% 2% 4% 6% 8% 10% 0-4 5-9 10-14 15-19 20-24 25-29 30-34 35-39 40-44 45-49 50-54 55-59 60-64 65-69 70-74 75-79 80+ Percent of Population Europe 10% 8% 6% 4% 2% 0% 2% 4% 6% 8% 10% 0-4 5-9 10-14 15-19 20-24 25-29 30-34 35-39 40-44 45-49 50-54 55-59 60-64 65-69 70-74 75-79 80+ Percent of Population World
  • 6. © 2014 Population Reference Bureau See notes on page 18 2014 WORLD POPULATION DATA SHEET 6 Countries Vary in Progress Toward Reducing Still-High Maternal Mortality. MDG 5: IMPROVE MATERNAL HEALTH The maternal mortality ratio is the number of maternal deaths per 100,000 live births. Globally, this ratio dropped from 380 deaths to 210 deaths per 100,000 live births between 1990 and 2013. Some countries have made remarkable progress. For example, maternal mortality in Rwanda declined from 1,400 maternal deaths per 100,000 live births to 320, a reduction of 77 percent. Even with these drops, many countries have not yet met the United Nations target for Millennium Development Goal 5: to reduce by three-quarters, between 1990 and 2015, the maternal mortality ratio. While the ratio has declined rapidly in some countries, many others have made insufficient progress. The ratio for all developing countries is 14 times higher than for developed countries—230 maternal deaths per 100,000 live births vs. 16, and further efforts are needed to end these preventable maternal deaths. SOURCE: World Health Organization, Trends in Maternal Mortality: 1990 to 2013 (Geneva: WHO, 2014). As Life Expectancy Rises in the United States, Gaps Between Whites and Blacks Are Decreasing. Since 1975, life expectancy at birth in the United States has increased by 10 years for black males, by 7 years for white males and black females, and by only 4 years for white females. In addition, the gap in life expectancy between white and black females decreased from 6 years to 3 years between 1975 and 2011; while the gap between white and black males decreased from 7 years to 4 years across this period. However, these remaining gaps between whites and blacks are one factor contributing to lower life expectancy at birth in the United States compared with other developed countries. Japan, Switzerland, Sweden, Norway, and France have life expectancies of 82 years or higher, compared with only 79 years in the United States. And, at 81 years, life expectancy at birth for women in the United States is considerably lower than it is for women in many other developed countries, where it has reached 84 years or higher. Hispanic females in the United States have a higher life expectancy at birth than whites or blacks of either gender. SOURCE: National Center For Health Statistics, “Deaths: Final Data for 2011,” National Vital Statistics Report 63, no. 3 (2014). W O R L D P O P U L A T I O N H I G H L I G H T S F O C U S O N P R O G R E S S A N D C H A L L E N G E S Côte d’Ivoire (3%) South Africa (9%) Kenya (17%) India (66%) Afghanistan (67%) Ethiopia (70%) Nepal (76%) Rwanda (77%) Eritrea (78%) Laos (80%) Cambodia (86%) Cameroon (18%) Congo, Dem. Rep. (27%) Peru (64%) Nigeria (53%) 75% or Greater Reduction 33%–74% Reduction Less Than 33% Reduction 170 1,200 220 1,100 320 1,400 190 790 420 400 190 560 25089 560 730 590 400 140 720 740 150 490 720 1,000 1,200 1,200 1,400 380 1,700 Maternal Deaths per 100,000 Live Births (2013 data appear inside bars; 1990 data are italicized) 86 84 82 80 78 76 74 72 70 68 66 64 62 60 1975 1979 1983 1987 1991 1995 1999 2003 2007 2011 83.7 77.3 71.3 69.5 62.4 White Females Black Females White Males Black Males Hispanic Females 81.3 78.8 78.2 Hispanic Males 76.6 72.2 Life Expectancy at Birth (years)
  • 7. © 2014 Population Reference Bureau See notes on page 18 2014 WORLD POPULATION DATA SHEET 7 POPULATION, HEALTH, AND ENVIRONMENT DATA AND ESTIMATES FOR THE Population mid-2014 (millions) Births per 1,000 Population Deaths per 1,000 Population Rate of Natural Increase (%) Net Migration Rate per 1,000 Population Projected Population (millions) 2050 Population as a Multiple of 2014 Infant Mortality Ratea Total Fertility Rateb Percent of Population mid-2030 mid-2050 1970 2013* 1970 2013* Ages 15 Ages 65+ Both Sex 1970 WORLD 7,238 20 8 1.2 — 8,444 9,683 1.3 89 38 4.7 2.5 26 8 58 MORE DEVELOPED 1,249 11 10 0.1 2 1,292 1,309 1.0 24 5 2.3 1.6 16 17 71 LESS DEVELOPED 5,989 22 7 1.4 0 7,152 8,375 1.4 100 42 5.7 2.6 29 6 55 LESS DEVELOPED (EXCL. CHINA) 4,625 24 7 1.7 -1 5,752 7,063 1.5 119 46 5.8 3.0 32 5 51 LEAST DEVELOPED 916 33 9 2.4 -1 1,290 1,855 2.0 150 64 5.7 4.3 40 4 44 AFRICA 1,136 36 10 2.5 0 1,637 2,428 2.1 139 62 6.7 4.7 41 4 45 SUB-SAHARAN AFRICA 920 37 11 2.6 0 1,360 2,081 2.3 138 67 6.7 5.1 43 3 44 NORTHERN AFRICA 217 28 7 2.2 -2 277 347 1.6 140 33 6.5 3.4 32 5 52 Algeria 39.1 25 6 1.9 -1 49.9 60.3 1.5 128 26 7.6 2.9 28 6 50 Egypt 87.9 32 6 2.6 -1 113.2 146.0 1.7 169 29 5.9 3.5 32 6 52 Libya 6.3 21 4 1.7 -7 7.5 8.4 1.3 104 14 7.9 2.4 29 5 56 Morocco 33.3 22 6 1.5 -3 38.2 41.4 1.2 118 29 6.7 2.6 28 5 53 Sudan 38.8 34 8 2.5 -4 55.1 77.1 2.0 97 55 6.9 5.2 41 3 52 Tunisia 11.0 19 6 1.3 -3 12.4 13.1 1.2 158 16 6.4 2.2 24 7 51 Western Saharae 0.6 21 6 1.5 17 0.8 0.8 1.4 168 37 6.6 2.4 27 3 42 WESTERN AFRICA 339 39 12 2.7 -1 507 784 2.3 152 66 6.7 5.4 44 3 41 Benin 10.3 37 10 2.7 -0 15.0 21.5 2.1 155 69 6.8 4.9 43 3 42 Burkina Faso 17.9 43 11 3.1 -2 28.4 46.6 2.6 163 70 6.6 5.9 46 2 39 Cape Verde 0.5 22 5 1.7 -7 0.6 0.7 1.5 109 24 6.9 2.6 30 5 52 Côte d'Ivoire 20.8 37 14 2.3 1 29.2 42.3 2.0 156 75 7.9 4.9 41 3 44 Gambia 1.9 41 10 3.1 -2 3.1 4.9 2.5 120 55 6.1 5.6 46 2 38 Ghana 27.0 34 9 2.5 -1 37.7 52.6 1.9 110 53 7.0 4.3 38 5 49 Guinea 11.6 38 12 2.7 -0 16.9 23.9 2.1 190 67 6.2 5.1 42 3 37 Guinea-Bissau 1.7 38 13 2.5 -1 2.5 3.5 2.0 144 94 6.1 5.0 41 3 44 Liberia 4.4 35 9 2.6 -1 6.4 9.4 2.1 186 54 6.7 4.7 43 3 39 Mali 15.9 42 13 2.9 -2 26.3 45.6 2.9 184 58 6.9 6.1 48 3 32 Mauritania 4.0 34 9 2.6 -1 5.6 7.9 2.0 110 72 6.8 4.1 40 3 49 Niger 18.2 50 11 3.9 -0 33.8 68.0 3.7 154 54 7.4 7.6 50 3 36 Nigeria 177.5 39 13 2.5 -0 261.7 396.5 2.2 153 69 6.5 5.6 44 3 41 Senegal 13.9 40 8 3.2 -1 21.8 35.1 2.5 111 43 7.3 5.3 44 3 39 Sierra Leone 6.3 38 17 2.1 -1 8.2 10.5 1.7 197 92 6.7 4.9 42 3 35 Togo 7.0 37 11 2.6 -0 10.0 14.5 2.1 120 66 7.1 4.7 42 3 47 EASTERN AFRICA 378 36 9 2.7 0 561 851 2.3 134 57 7.1 4.9 44 3 45 Burundi 10.5 45 13 3.2 -0 16.4 26.7 2.5 139 87 7.3 6.1 45 2 44 Comoros 0.7 34 9 2.5 -3 1.0 1.3 1.8 134 36 7.1 4.3 42 3 48 Djibouti 0.9 28 9 1.9 -4 1.1 1.2 1.4 112 55 6.8 3.4 34 4 49 Eritrea 6.5 33 7 2.6 2 9.8 14.3 2.2 151 42 6.7 4.7 43 2 41 Ethiopia 95.9 28 8 2.1 -0 130.5 165.1 1.7 144 50 7.0 4.1 43 3 43 Kenya 43.2 34 9 2.6 -0 60.0 81.3 1.9 98 47 8.1 4.3 42 3 52 Madagascar 22.4 34 7 2.7 -0 34.3 52.8 2.4 139 42 7.3 4.4 42 3 45 Malawi 16.8 40 12 2.9 0 26.0 41.2 2.4 175 66 7.3 5.5 45 3 41 Mauritius 1.3 11 8 0.3 -0 1.3 1.2 1.0 66 12.1 3.8 1.4 21 8 63 Mayotte 0.2 31 3 2.8 -5 0.3 0.5 2.1 53 4 7.9 4.1 45 2 62 Mozambique 25.1 43 13 2.9 0 38.4 63.5 2.5 165 85 6.6 5.7 45 3 39 Reunion 0.9 17 5 1.2 -5 1.0 1.2 1.4 53 7 4.8 2.4 24 9 63 Rwanda 11.1 31 8 2.3 -1 15.8 21.0 1.9 136 49 8.2 4.0 41 3 44 Seychelles 0.1 19 7 1.1 2 0.1 0.1 1.1 54 11.4 5.8 2.4 22 8 66 Somalia 10.8 44 12 3.2 -3 16.9 27.1 2.5 154 80 7.2 6.6 48 3 41 South Sudan 11.7 36 12 2.4 16 17.3 39.3 3.3 187 78 6.9 7.0 42 3 36 per woman to 2.8.in 2050. contraception. P O P U POPULATION, HEALTH, AND ENVIRONMENT DATA AND ESTIMATES FOR THE COUNTRIES AND REGIONS OF THE WORLD
  • 8. © 2014 Population Reference Bureau See notes on page 18 2014 WORLD POPULATION DATA SHEET 8 Eritrea 6.5 33 7 2.6 2 9.8 14.3 2.2 151 42 6.7 4.7 43 2 41 Ethiopia 95.9 28 8 2.1 -0 130.5 165.1 1.7 144 50 7.0 4.1 43 3 43 Kenya 43.2 34 9 2.6 -0 60.0 81.3 1.9 98 47 8.1 4.3 42 3 52 Madagascar 22.4 34 7 2.7 -0 34.3 52.8 2.4 139 42 7.3 4.4 42 3 45 Malawi 16.8 40 12 2.9 0 26.0 41.2 2.4 175 66 7.3 5.5 45 3 41 Mauritius 1.3 11 8 0.3 -0 1.3 1.2 1.0 66 12.1 3.8 1.4 21 8 63 Mayotte 0.2 31 3 2.8 -5 0.3 0.5 2.1 53 4 7.9 4.1 45 2 62 Mozambique 25.1 43 13 2.9 0 38.4 63.5 2.5 165 85 6.6 5.7 45 3 39 Reunion 0.9 17 5 1.2 -5 1.0 1.2 1.4 53 7 4.8 2.4 24 9 63 Rwanda 11.1 31 8 2.3 -1 15.8 21.0 1.9 136 49 8.2 4.0 41 3 44 Seychelles 0.1 19 7 1.1 2 0.1 0.1 1.1 54 11.4 5.8 2.4 22 8 66 Somalia 10.8 44 12 3.2 -3 16.9 27.1 2.5 154 80 7.2 6.6 48 3 41 South Sudan 11.7 36 12 2.4 16 17.3 39.3 3.3 187 78 6.9 7.0 42 3 36 Tanzania 50.8 40 9 3.1 -1 79.4 129.4 2.5 124 49 6.8 5.3 45 3 47 Uganda 38.8 43 9 3.4 -1 63.4 104.1 2.7 113 57 7.1 5.9 48 2 49 Zambia 15.1 45 11 3.4 -1 26.1 49.2 3.3 112 66 7.4 6.0 47 3 49 Zimbabwe 14.7 33 9 2.4 6 21.5 30.2 2.1 86 37 7.4 3.8 40 3 55 MIDDLE AFRICA 142 45 15 3.0 -0 225 372 2.6 144 97 6.4 6.1 46 3 43 Angola 22.4 46 14 3.2 1 36.4 60.8 2.7 179 96 7.3 6.2 48 2 37 Cameroon 22.8 39 12 2.7 -1 34.5 54.3 2.4 127 62 6.2 5.1 43 3 46 Central African Republic 4.8 47 15 3.2 0 6.7 9.7 2.0 149 116 6.0 6.2 40 4 42 Chad 13.3 48 15 3.3 -2 21.8 37.4 2.8 153 96 6.5 6.6 49 2 41 Congo 4.6 38 10 2.8 -2 6.8 10.6 2.3 93 64 6.3 5.0 42 3 53 Congo, Dem. Rep. 71.2 46 16 3.0 -0 114.9 193.6 2.7 138 109 6.2 6.6 46 3 44 Equatorial Guinea 0.8 36 13 2.2 5 1.1 1.6 2.1 162 89 5.7 4.9 39 3 40 Gabon 1.7 32 9 2.3 1 2.4 3.3 1.9 124 43 5.1 4.1 38 5 47 Sao Tome and Principe 0.2 36 7 2.9 -2 0.3 0.4 2.2 82 44 6.5 4.3 42 4 56 SOUTHERN AFRICA 61 21 11 1.0 3 68 75 1.2 85 44 5.7 2.4 30 5 53 Botswana 2.0 24 17 0.7 2 2.3 2.8 1.4 97 32 6.6 2.6 34 4 55 Lesotho 1.9 30 21 0.9 -6 2.1 2.7 1.4 127 82 5.8 3.3 36 6 49 Namibia 2.3 30 7 2.2 -0 3.0 3.7 1.6 108 39 6.5 3.6 36 4 53 South Africa 53.7 20 11 1.0 3 58.7 64.1 1.2 80 42 5.6 2.3 29 5 53 Swaziland 1.3 30 14 1.6 -1 1.5 1.8 1.4 133 65 6.9 3.4 38 3 48 AMERICAS 972 16 7 0.9 0 1,106 1,217 1.3 68 15 4.0 2.1 24 10 65 NORTHERN AMERICA 353 12 8 0.4 3 396 444 1.3 21 5 2.3 1.8 19 14 71 Canada 35.5 11 7 0.4 8 41.5 48.4 1.4 19 4.8 2.2 1.6 16 15 72 United States 317.7 13 8 0.4 3 354.4 395.3 1.2 20 5.4 2.5 1.9 19 14 71 LATIN AMERICA AND THE CARIBBEAN 618 18 6 1.2 -1 710 773 1.3 86 18 5.3 2.2 27 7 60 CENTRAL AMERICA 165 21 6 1.5 -2 195 222 1.3 81 16 6.6 2.4 30 6 60 Belize 0.4 23 4 1.9 6 0.5 0.6 1.7 64 14 6.3 2.6 36 4 66 Costa Rica 4.8 15 4 1.1 2 5.6 6.1 1.3 61 8.7 4.9 1.8 24 7 67 El Salvador 6.4 20 7 1.4 -7 6.9 6.9 1.1 104 17 6.2 2.2 30 7 57 Guatemala 15.9 31 5 2.6 -1 22.6 31.3 2.0 109 23 6.2 3.8 40 5 52 Honduras 8.2 24 5 2.0 -1 10.2 11.7 1.4 112 24 7.3 2.8 35 4 53 Mexico 119.7 19 6 1.4 -2 137.5 150.8 1.3 75 13 6.7 2.2 28 6 61 Nicaragua 6.2 23 5 1.9 -6 7.5 8.4 1.4 105 17 6.9 2.5 33 5 54 Panama 3.9 20 5 1.5 2 4.8 5.6 1.4 53 14 5.2 2.5 28 7 66 CARIBBEAN 43 18 8 1.1 -4 47 49 1.1 77 33 4.7 2.3 26 9 62 Antigua and Barbuda 0.1 14 5 0.8 5 0.1 0.1 1.4 45 16 3.7 1.8 24 7 66 Bahamas 0.4 16 5 1.1 2 0.4 0.5 1.3 36 17 3.5 2.0 26 6 66 Barbados 0.3 12 8 0.4 1 0.3 0.3 1.1 46 10 3.1 1.8 20 13 65 Cuba 11.2 11 8 0.3 -4 10.7 9.3 0.8 45 4.6 4.0 1.7 17 13 70 Curacao 0.2 13 8 0.5 4 0.2 0.2 1.2 31 9.8 3.3 2.2 19 15 69 Dominica 0.1 13 8 0.5 -6 0.1 0.1 0.9 — 21 — 2.0 22 10 — Dominican Republic 10.4 21 6 1.5 -3 12.0 13.2 1.3 102 25 6.2 2.5 31 6 58 Grenada 0.1 16 7 0.8 -2 0.1 0.1 0.9 49 9 4.6 2.0 27 7 64 Guadeloupe 0.4 13 7 0.6 -7 0.4 0.4 1.0 37 8.1 4.9 2.2 21 15 65 Haiti 10.8 28 9 1.9 -3 13.5 16.8 1.6 141 59 5.8 3.4 35 4 47 Jamaica 2.7 18 7 1.1 -5 2.9 2.7 1.0 48 21 5.5 2.3 27 8 68 POPULATION, HEALTH, AND ENVIRONMENT DATA AND ESTIMATES FOR THE Population mid-2014 (millions) Births per 1,000 Population Deaths per 1,000 Population Rate of Natural Increase (%) Net Migration Rate per 1,000 Population Projected Population (millions) 2050 Population as a Multiple of 2014 Infant Mortality Ratea Total Fertility Rateb Percent of Population mid-2030 mid-2050 1970 2013* 1970 2013* Ages 15 Ages 65+ Both Sex 1970 WORLD 7,238 20 8 1.2 — 8,444 9,683 1.3 89 38 4.7 2.5 26 8 58 MORE DEVELOPED 1,249 11 10 0.1 2 1,292 1,309 1.0 24 5 2.3 1.6 16 17 71 LESS DEVELOPED 5,989 22 7 1.4 0 7,152 8,375 1.4 100 42 5.7 2.6 29 6 55 LESS DEVELOPED (EXCL. CHINA) 4,625 24 7 1.7 -1 5,752 7,063 1.5 119 46 5.8 3.0 32 5 51 LEAST DEVELOPED 916 33 9 2.4 -1 1,290 1,855 2.0 150 64 5.7 4.3 40 4 44 AFRICA 1,136 36 10 2.5 0 1,637 2,428 2.1 139 62 6.7 4.7 41 4 45 SUB-SAHARAN AFRICA 920 37 11 2.6 0 1,360 2,081 2.3 138 67 6.7 5.1 43 3 44 NORTHERN AFRICA 217 28 7 2.2 -2 277 347 1.6 140 33 6.5 3.4 32 5 52 Algeria 39.1 25 6 1.9 -1 49.9 60.3 1.5 128 26 7.6 2.9 28 6 50 Egypt 87.9 32 6 2.6 -1 113.2 146.0 1.7 169 29 5.9 3.5 32 6 52 Libya 6.3 21 4 1.7 -7 7.5 8.4 1.3 104 14 7.9 2.4 29 5 56 Morocco 33.3 22 6 1.5 -3 38.2 41.4 1.2 118 29 6.7 2.6 28 5 53 Sudan 38.8 34 8 2.5 -4 55.1 77.1 2.0 97 55 6.9 5.2 41 3 52 Tunisia 11.0 19 6 1.3 -3 12.4 13.1 1.2 158 16 6.4 2.2 24 7 51 Western Saharae 0.6 21 6 1.5 17 0.8 0.8 1.4 168 37 6.6 2.4 27 3 42 WESTERN AFRICA 339 39 12 2.7 -1 507 784 2.3 152 66 6.7 5.4 44 3 41 Benin 10.3 37 10 2.7 -0 15.0 21.5 2.1 155 69 6.8 4.9 43 3 42 Burkina Faso 17.9 43 11 3.1 -2 28.4 46.6 2.6 163 70 6.6 5.9 46 2 39 Cape Verde 0.5 22 5 1.7 -7 0.6 0.7 1.5 109 24 6.9 2.6 30 5 52 Côte d'Ivoire 20.8 37 14 2.3 1 29.2 42.3 2.0 156 75 7.9 4.9 41 3 44 Gambia 1.9 41 10 3.1 -2 3.1 4.9 2.5 120 55 6.1 5.6 46 2 38 Ghana 27.0 34 9 2.5 -1 37.7 52.6 1.9 110 53 7.0 4.3 38 5 49 Guinea 11.6 38 12 2.7 -0 16.9 23.9 2.1 190 67 6.2 5.1 42 3 37 Guinea-Bissau 1.7 38 13 2.5 -1 2.5 3.5 2.0 144 94 6.1 5.0 41 3 44 Liberia 4.4 35 9 2.6 -1 6.4 9.4 2.1 186 54 6.7 4.7 43 3 39 Mali 15.9 42 13 2.9 -2 26.3 45.6 2.9 184 58 6.9 6.1 48 3 32 Mauritania 4.0 34 9 2.6 -1 5.6 7.9 2.0 110 72 6.8 4.1 40 3 49 Niger 18.2 50 11 3.9 -0 33.8 68.0 3.7 154 54 7.4 7.6 50 3 36 Nigeria 177.5 39 13 2.5 -0 261.7 396.5 2.2 153 69 6.5 5.6 44 3 41 Senegal 13.9 40 8 3.2 -1 21.8 35.1 2.5 111 43 7.3 5.3 44 3 39 Sierra Leone 6.3 38 17 2.1 -1 8.2 10.5 1.7 197 92 6.7 4.9 42 3 35 Togo 7.0 37 11 2.6 -0 10.0 14.5 2.1 120 66 7.1 4.7 42 3 47 EASTERN AFRICA 378 36 9 2.7 0 561 851 2.3 134 57 7.1 4.9 44 3 45 Burundi 10.5 45 13 3.2 -0 16.4 26.7 2.5 139 87 7.3 6.1 45 2 44 Comoros 0.7 34 9 2.5 -3 1.0 1.3 1.8 134 36 7.1 4.3 42 3 48 Djibouti 0.9 28 9 1.9 -4 1.1 1.2 1.4 112 55 6.8 3.4 34 4 49 Eritrea 6.5 33 7 2.6 2 9.8 14.3 2.2 151 42 6.7 4.7 43 2 41 Ethiopia 95.9 28 8 2.1 -0 130.5 165.1 1.7 144 50 7.0 4.1 43 3 43 Kenya 43.2 34 9 2.6 -0 60.0 81.3 1.9 98 47 8.1 4.3 42 3 52 Madagascar 22.4 34 7 2.7 -0 34.3 52.8 2.4 139 42 7.3 4.4 42 3 45 Malawi 16.8 40 12 2.9 0 26.0 41.2 2.4 175 66 7.3 5.5 45 3 41 Mauritius 1.3 11 8 0.3 -0 1.3 1.2 1.0 66 12.1 3.8 1.4 21 8 63 Mayotte 0.2 31 3 2.8 -5 0.3 0.5 2.1 53 4 7.9 4.1 45 2 62 Mozambique 25.1 43 13 2.9 0 38.4 63.5 2.5 165 85 6.6 5.7 45 3 39 Reunion 0.9 17 5 1.2 -5 1.0 1.2 1.4 53 7 4.8 2.4 24 9 63 Rwanda 11.1 31 8 2.3 -1 15.8 21.0 1.9 136 49 8.2 4.0 41 3 44 Seychelles 0.1 19 7 1.1 2 0.1 0.1 1.1 54 11.4 5.8 2.4 22 8 66 Somalia 10.8 44 12 3.2 -3 16.9 27.1 2.5 154 80 7.2 6.6 48 3 41 South Sudan 11.7 36 12 2.4 16 17.3 39.3 3.3 187 78 6.9 7.0 42 3 36 per woman to 2.8.in 2050. contraception. P O P U POPULATION, HEALTH, AND ENVIRONMENT DATA AND ESTIMATES FOR THE COUNTRIES AND REGIONS OF THE WORLD
  • 9. © 2014 Population Reference Bureau See notes on page 18 2014 WORLD POPULATION DATA SHEET 9 POPULATION, HEALTH, AND ENVIRONMENT DATA AND ESTIMATES FOR THE Population mid-2014 (millions) Births per 1,000 Population Deaths per 1,000 Population Rate of Natural Increase (%) Net Migration Rate per 1,000 Population Projected Population (millions) 2050 Population as a Multiple of 2014 Infant Mortality Ratea Total Fertility Rateb Percent of Population mid-2030 mid-2050 1970 2013* 1970 2013* Ages 15 Ages 65+ Both Sex 1970 WORLD 7,238 20 8 1.2 — 8,444 9,683 1.3 89 38 4.7 2.5 26 8 58 MORE DEVELOPED 1,249 11 10 0.1 2 1,292 1,309 1.0 24 5 2.3 1.6 16 17 71 LESS DEVELOPED 5,989 22 7 1.4 0 7,152 8,375 1.4 100 42 5.7 2.6 29 6 55 LESS DEVELOPED (EXCL. CHINA) 4,625 24 7 1.7 -1 5,752 7,063 1.5 119 46 5.8 3.0 32 5 51 LEAST DEVELOPED 916 33 9 2.4 -1 1,290 1,855 2.0 150 64 5.7 4.3 40 4 44 AFRICA 1,136 36 10 2.5 0 1,637 2,428 2.1 139 62 6.7 4.7 41 4 45 SUB-SAHARAN AFRICA 920 37 11 2.6 0 1,360 2,081 2.3 138 67 6.7 5.1 43 3 44 NORTHERN AFRICA 217 28 7 2.2 -2 277 347 1.6 140 33 6.5 3.4 32 5 52 Algeria 39.1 25 6 1.9 -1 49.9 60.3 1.5 128 26 7.6 2.9 28 6 50 Egypt 87.9 32 6 2.6 -1 113.2 146.0 1.7 169 29 5.9 3.5 32 6 52 Libya 6.3 21 4 1.7 -7 7.5 8.4 1.3 104 14 7.9 2.4 29 5 56 Morocco 33.3 22 6 1.5 -3 38.2 41.4 1.2 118 29 6.7 2.6 28 5 53 Sudan 38.8 34 8 2.5 -4 55.1 77.1 2.0 97 55 6.9 5.2 41 3 52 Tunisia 11.0 19 6 1.3 -3 12.4 13.1 1.2 158 16 6.4 2.2 24 7 51 Western Saharae 0.6 21 6 1.5 17 0.8 0.8 1.4 168 37 6.6 2.4 27 3 42 WESTERN AFRICA 339 39 12 2.7 -1 507 784 2.3 152 66 6.7 5.4 44 3 41 Benin 10.3 37 10 2.7 -0 15.0 21.5 2.1 155 69 6.8 4.9 43 3 42 Burkina Faso 17.9 43 11 3.1 -2 28.4 46.6 2.6 163 70 6.6 5.9 46 2 39 Cape Verde 0.5 22 5 1.7 -7 0.6 0.7 1.5 109 24 6.9 2.6 30 5 52 Côte d'Ivoire 20.8 37 14 2.3 1 29.2 42.3 2.0 156 75 7.9 4.9 41 3 44 Gambia 1.9 41 10 3.1 -2 3.1 4.9 2.5 120 55 6.1 5.6 46 2 38 Ghana 27.0 34 9 2.5 -1 37.7 52.6 1.9 110 53 7.0 4.3 38 5 49 Guinea 11.6 38 12 2.7 -0 16.9 23.9 2.1 190 67 6.2 5.1 42 3 37 Guinea-Bissau 1.7 38 13 2.5 -1 2.5 3.5 2.0 144 94 6.1 5.0 41 3 44 Liberia 4.4 35 9 2.6 -1 6.4 9.4 2.1 186 54 6.7 4.7 43 3 39 Mali 15.9 42 13 2.9 -2 26.3 45.6 2.9 184 58 6.9 6.1 48 3 32 Mauritania 4.0 34 9 2.6 -1 5.6 7.9 2.0 110 72 6.8 4.1 40 3 49 Niger 18.2 50 11 3.9 -0 33.8 68.0 3.7 154 54 7.4 7.6 50 3 36 Nigeria 177.5 39 13 2.5 -0 261.7 396.5 2.2 153 69 6.5 5.6 44 3 41 Senegal 13.9 40 8 3.2 -1 21.8 35.1 2.5 111 43 7.3 5.3 44 3 39 Sierra Leone 6.3 38 17 2.1 -1 8.2 10.5 1.7 197 92 6.7 4.9 42 3 35 Togo 7.0 37 11 2.6 -0 10.0 14.5 2.1 120 66 7.1 4.7 42 3 47 EASTERN AFRICA 378 36 9 2.7 0 561 851 2.3 134 57 7.1 4.9 44 3 45 Burundi 10.5 45 13 3.2 -0 16.4 26.7 2.5 139 87 7.3 6.1 45 2 44 Comoros 0.7 34 9 2.5 -3 1.0 1.3 1.8 134 36 7.1 4.3 42 3 48 Djibouti 0.9 28 9 1.9 -4 1.1 1.2 1.4 112 55 6.8 3.4 34 4 49 Eritrea 6.5 33 7 2.6 2 9.8 14.3 2.2 151 42 6.7 4.7 43 2 41 Ethiopia 95.9 28 8 2.1 -0 130.5 165.1 1.7 144 50 7.0 4.1 43 3 43 Kenya 43.2 34 9 2.6 -0 60.0 81.3 1.9 98 47 8.1 4.3 42 3 52 Madagascar 22.4 34 7 2.7 -0 34.3 52.8 2.4 139 42 7.3 4.4 42 3 45 Malawi 16.8 40 12 2.9 0 26.0 41.2 2.4 175 66 7.3 5.5 45 3 41 Mauritius 1.3 11 8 0.3 -0 1.3 1.2 1.0 66 12.1 3.8 1.4 21 8 63 Mayotte 0.2 31 3 2.8 -5 0.3 0.5 2.1 53 4 7.9 4.1 45 2 62 Mozambique 25.1 43 13 2.9 0 38.4 63.5 2.5 165 85 6.6 5.7 45 3 39 Reunion 0.9 17 5 1.2 -5 1.0 1.2 1.4 53 7 4.8 2.4 24 9 63 Rwanda 11.1 31 8 2.3 -1 15.8 21.0 1.9 136 49 8.2 4.0 41 3 44 Seychelles 0.1 19 7 1.1 2 0.1 0.1 1.1 54 11.4 5.8 2.4 22 8 66 Somalia 10.8 44 12 3.2 -3 16.9 27.1 2.5 154 80 7.2 6.6 48 3 41 South Sudan 11.7 36 12 2.4 16 17.3 39.3 3.3 187 78 6.9 7.0 42 3 36 per woman to 2.8.in 2050. contraception. P O P UPanama 3.9 20 5 1.5 2 4.8 5.6 1.4 53 14 5.2 2.5 28 7 66 CARIBBEAN 43 18 8 1.1 -4 47 49 1.1 77 33 4.7 2.3 26 9 62 Antigua and Barbuda 0.1 14 5 0.8 5 0.1 0.1 1.4 45 16 3.7 1.8 24 7 66 Bahamas 0.4 16 5 1.1 2 0.4 0.5 1.3 36 17 3.5 2.0 26 6 66 Barbados 0.3 12 8 0.4 1 0.3 0.3 1.1 46 10 3.1 1.8 20 13 65 Cuba 11.2 11 8 0.3 -4 10.7 9.3 0.8 45 4.6 4.0 1.7 17 13 70 Curacao 0.2 13 8 0.5 4 0.2 0.2 1.2 31 9.8 3.3 2.2 19 15 69 Dominica 0.1 13 8 0.5 -6 0.1 0.1 0.9 — 21 — 2.0 22 10 — Dominican Republic 10.4 21 6 1.5 -3 12.0 13.2 1.3 102 25 6.2 2.5 31 6 58 Grenada 0.1 16 7 0.8 -2 0.1 0.1 0.9 49 9 4.6 2.0 27 7 64 Guadeloupe 0.4 13 7 0.6 -7 0.4 0.4 1.0 37 8.1 4.9 2.2 21 15 65 Haiti 10.8 28 9 1.9 -3 13.5 16.8 1.6 141 59 5.8 3.4 35 4 47 Jamaica 2.7 18 7 1.1 -5 2.9 2.7 1.0 48 21 5.5 2.3 27 8 68 Martinique 0.4 12 7 0.4 -10 0.4 0.4 1.1 40 8 4.6 1.9 19 17 66 Puerto Rico 3.6 11 8 0.3 -13 3.4 3.0 0.8 29 8.1 3.2 1.6 19 16 72 St. Kitts-Nevis 0.1 13 7 0.6 7 0.1 0.1 1.2 — 17 — 1.6 22 8 — St. Lucia 0.2 13 8 0.6 0 0.2 0.2 1.0 50 20 6.1 1.5 23 9 63 St. Vincent and the Grenadines 0.1 17 8 0.9 -9 0.1 0.1 1.0 64 20 6.0 2.2 25 7 65 Trinidad and Tobago 1.3 13 10 0.3 -3 1.2 1.0 0.7 46 24 3.6 1.6 20 9 65 SOUTH AMERICA 410 17 6 1.1 -0 467 503 1.2 89 18 4.9 2.1 26 8 60 Argentina 42.7 19 7 1.1 -0 50.2 59.4 1.4 53 11.7 3.1 2.3 25 10 66 Bolivia 10.3 26 7 1.9 0 13.0 15.8 1.5 156 39 6.6 3.2 35 5 46 Brazil 202.8 15 6 0.9 0 223.1 226.3 1.1 96 20 5.0 1.8 24 7 59 Chile 17.7 14 6 0.9 0 19.6 20.2 1.1 79 7.7 4.0 1.9 22 10 62 Colombia 47.7 19 6 1.3 -2 55.7 61.3 1.3 78 18 5.6 2.3 28 7 61 Ecuador 16.0 23 5 1.8 -0 19.8 23.4 1.5 101 17 6.1 2.8 31 7 58 French Guiana 0.3 27 3 2.4 2 0.4 0.6 2.4 47 10 4.7 3.5 34 5 65 Guyana 0.7 20 7 1.3 -15 0.8 0.8 1.0 60 29 5.1 2.5 36 3 59 Paraguay 6.9 23 6 1.7 -1 8.6 10.1 1.5 56 29 5.7 2.8 33 5 65 Peru 30.8 20 5 1.5 -3 35.9 40.1 1.3 118 16 6.3 2.4 29 6 53 Suriname 0.6 20 7 1.3 -2 0.7 0.7 1.3 46 20 5.7 2.6 28 6 63 Uruguay 3.4 14 9 0.5 -2 3.6 3.6 1.1 47 9.3 2.9 2.0 22 14 69 Venezuela 30.2 20 5 1.5 0 36.1 40.5 1.3 54 14.4 5.4 2.4 29 6 65 Population (millions) Birth Rate Death Rate Natural Increase (%) Migration Rate mid-2030 mid-2050 Population Change 1970 2013* 1970 2013* 15 65+ Both, 197 Population (millions) Infant Mortality Total Fertility Rate % of Population NOTES (—) Indicates data unavailable or inapplicable. * Denotes 2013 or most recent year for which data are available. a Infant deaths per 1,000 live births. Rates shown with decimals indicate national statistics reported as completely registered, while those without are estimates from the sources cited on the reverse. Rates shown in italics are based upon fewer than 50 annual infant deaths and, as a result, are subject to considerable yearly variability. b Average number of children born to a woman during c Data prior to 2008 are shown in italics. d Data prior to 2013 are shown in italics. e The status of Western Sahara is disputed by Morocc f Special Administrative Region. g Does not include the population of Crimea, estimate 1875 Connecticut Ave., NW, Washington, DC 20009 USA tel. 202-483-1100 | fax 202-328-3937 e-mail: popref@prb.org | website: www.prb.org POPULATION, HEALTH, AND ENVIRONMENT DATA AND ESTIMATES FOR THE Population mid-2014 (millions) Births per 1,000 Population Deaths per 1,000 Population Rate of Natural Increase (%) Net Migration Rate per 1,000 Population Projected Population (millions) 2050 Population as a Multiple of 2014 Infant Mortality Ratea Total Fertility Rateb Percent of Population mid-2030 mid-2050 1970 2013* 1970 2013* Ages 15 Ages 65+ Both Sex 1970 ASIA 4,351 18 7 1.1 -0 4,907 5,252 1.2 91 34 5.4 2.2 25 7 57 ASIA (Excl. China) 2,987 21 7 1.4 -0 3,507 3,941 1.3 114 40 5.9 2.5 29 6 53 WESTERN ASIA 255 22 5 1.7 2 322 387 1.5 122 25 5.8 2.9 30 5 56 Armenia 3.0 14 9 0.5 -8 3.0 2.8 0.9 66 10 3.2 1.6 19 11 70 Azerbaijan 9.5 18 6 1.3 0 11.1 12.1 1.3 103 11 4.6 2.2 22 6 65 Bahrain 1.3 15 2 1.3 20 1.6 1.8 1.4 58 8 6.5 2.1 21 2 63 Cyprus 1.2 13 7 0.6 -2 1.3 1.4 1.2 26 6 2.5 1.5 17 12 73 Georgia 4.8 13 11 0.2 -1 4.8 4.6 1.0 55 11 2.6 1.7 17 14 67 Iraq 35.1 31 5 2.6 1 53.8 80.5 2.3 80 29 7.4 4.1 40 3 58 Israel 8.2 21 5 1.6 3 10.5 13.9 1.7 23 3.0 3.8 3.0 28 10 72 Jordan 7.6 28 4 2.4 -8 9.9 13.1 1.7 71 17 7.9 3.5 34 4 60 Kuwait 3.7 18 2 1.7 35 5.1 6.6 1.8 47 8 7.2 2.4 23 2 66 Lebanon 5.0 13 4 0.9 20 5.2 5.3 1.1 44 9 5.0 1.5 20 9 66 Oman 4.1 20 2 1.8 39 5.4 6.3 1.6 120 9 7.3 2.8 22 3 50 Palestinian Territory 4.4 31 4 2.7 -1 6.6 9.1 2.1 99 20 7.9 4.1 40 3 56 Qatar 2.3 11 1 1.0 2 2.8 3.0 1.3 43 7 6.9 2.1 14 1 68 Saudi Arabia 30.8 22 4 1.8 2 37.4 42.4 1.4 122 16 7.3 2.9 30 3 53 Syria 22.0 24 4 2.1 -11 29.9 36.7 1.7 81 17 7.6 3.0 35 4 59 Turkey 77.2 16 5 1.1 0 88.3 93.3 1.2 145 10 5.7 2.1 25 8 52 United Arab Emirates 9.4 15 1 1.4 22 12.3 15.5 1.6 67 6 6.6 1.8 16 0 62 Yemen 26.0 36 8 2.8 -1 33.6 38.8 1.5 196 68 7.5 4.4 42 3 41 SOUTH CENTRAL ASIA 1,874 22 7 1.6 -1 2,220 2,516 1.3 133 47 5.7 2.5 31 5 49 CENTRAL ASIA 67 24 6 1.8 -1 81 93 1.4 95 41 5.1 2.7 29 5 62 Kazakhstan 17.3 23 8 1.5 -0 20.3 24.5 1.4 81 28 3.5 2.7 25 7 63 Kyrgyzstan 5.8 28 7 2.1 -1 7.5 9.4 1.6 105 27 4.9 3.2 31 4 61 Tajikistan 8.3 34 7 2.7 -5 11.2 14.8 1.8 129 57 6.9 3.8 36 3 60 40Percentag population ULATION Data Sheet C E B U R E A U POPULATION, HEALTH, AND ENVIRONMENT DATA AND ESTIMATES FOR THE COUNTRIES AND REGIONS OF THE WORLD
  • 10. © 2014 Population Reference Bureau See notes on page 18 2014 WORLD POPULATION DATA SHEET 10 POPULATION, HEALTH, AND ENVIRONMENT DATA AND ESTIMATES FOR THE Population mid-2014 (millions) Births per 1,000 Population Deaths per 1,000 Population Rate of Natural Increase (%) Net Migration Rate per 1,000 Population Projected Population (millions) 2050 Population as a Multiple of 2014 Infant Mortality Ratea Total Fertility Rateb Percent of Population mid-2030 mid-2050 1970 2013* 1970 2013* Ages 15 Ages 65+ Both Sex 1970 WORLD 7,238 20 8 1.2 — 8,444 9,683 1.3 89 38 4.7 2.5 26 8 58 MORE DEVELOPED 1,249 11 10 0.1 2 1,292 1,309 1.0 24 5 2.3 1.6 16 17 71 LESS DEVELOPED 5,989 22 7 1.4 0 7,152 8,375 1.4 100 42 5.7 2.6 29 6 55 LESS DEVELOPED (EXCL. CHINA) 4,625 24 7 1.7 -1 5,752 7,063 1.5 119 46 5.8 3.0 32 5 51 LEAST DEVELOPED 916 33 9 2.4 -1 1,290 1,855 2.0 150 64 5.7 4.3 40 4 44 AFRICA 1,136 36 10 2.5 0 1,637 2,428 2.1 139 62 6.7 4.7 41 4 45 SUB-SAHARAN AFRICA 920 37 11 2.6 0 1,360 2,081 2.3 138 67 6.7 5.1 43 3 44 NORTHERN AFRICA 217 28 7 2.2 -2 277 347 1.6 140 33 6.5 3.4 32 5 52 Algeria 39.1 25 6 1.9 -1 49.9 60.3 1.5 128 26 7.6 2.9 28 6 50 Egypt 87.9 32 6 2.6 -1 113.2 146.0 1.7 169 29 5.9 3.5 32 6 52 Libya 6.3 21 4 1.7 -7 7.5 8.4 1.3 104 14 7.9 2.4 29 5 56 Morocco 33.3 22 6 1.5 -3 38.2 41.4 1.2 118 29 6.7 2.6 28 5 53 Sudan 38.8 34 8 2.5 -4 55.1 77.1 2.0 97 55 6.9 5.2 41 3 52 Tunisia 11.0 19 6 1.3 -3 12.4 13.1 1.2 158 16 6.4 2.2 24 7 51 Western Saharae 0.6 21 6 1.5 17 0.8 0.8 1.4 168 37 6.6 2.4 27 3 42 WESTERN AFRICA 339 39 12 2.7 -1 507 784 2.3 152 66 6.7 5.4 44 3 41 Benin 10.3 37 10 2.7 -0 15.0 21.5 2.1 155 69 6.8 4.9 43 3 42 Burkina Faso 17.9 43 11 3.1 -2 28.4 46.6 2.6 163 70 6.6 5.9 46 2 39 Cape Verde 0.5 22 5 1.7 -7 0.6 0.7 1.5 109 24 6.9 2.6 30 5 52 Côte d'Ivoire 20.8 37 14 2.3 1 29.2 42.3 2.0 156 75 7.9 4.9 41 3 44 Gambia 1.9 41 10 3.1 -2 3.1 4.9 2.5 120 55 6.1 5.6 46 2 38 Ghana 27.0 34 9 2.5 -1 37.7 52.6 1.9 110 53 7.0 4.3 38 5 49 Guinea 11.6 38 12 2.7 -0 16.9 23.9 2.1 190 67 6.2 5.1 42 3 37 Guinea-Bissau 1.7 38 13 2.5 -1 2.5 3.5 2.0 144 94 6.1 5.0 41 3 44 Liberia 4.4 35 9 2.6 -1 6.4 9.4 2.1 186 54 6.7 4.7 43 3 39 Mali 15.9 42 13 2.9 -2 26.3 45.6 2.9 184 58 6.9 6.1 48 3 32 Mauritania 4.0 34 9 2.6 -1 5.6 7.9 2.0 110 72 6.8 4.1 40 3 49 Niger 18.2 50 11 3.9 -0 33.8 68.0 3.7 154 54 7.4 7.6 50 3 36 Nigeria 177.5 39 13 2.5 -0 261.7 396.5 2.2 153 69 6.5 5.6 44 3 41 Senegal 13.9 40 8 3.2 -1 21.8 35.1 2.5 111 43 7.3 5.3 44 3 39 Sierra Leone 6.3 38 17 2.1 -1 8.2 10.5 1.7 197 92 6.7 4.9 42 3 35 Togo 7.0 37 11 2.6 -0 10.0 14.5 2.1 120 66 7.1 4.7 42 3 47 EASTERN AFRICA 378 36 9 2.7 0 561 851 2.3 134 57 7.1 4.9 44 3 45 Burundi 10.5 45 13 3.2 -0 16.4 26.7 2.5 139 87 7.3 6.1 45 2 44 Comoros 0.7 34 9 2.5 -3 1.0 1.3 1.8 134 36 7.1 4.3 42 3 48 Djibouti 0.9 28 9 1.9 -4 1.1 1.2 1.4 112 55 6.8 3.4 34 4 49 Eritrea 6.5 33 7 2.6 2 9.8 14.3 2.2 151 42 6.7 4.7 43 2 41 Ethiopia 95.9 28 8 2.1 -0 130.5 165.1 1.7 144 50 7.0 4.1 43 3 43 Kenya 43.2 34 9 2.6 -0 60.0 81.3 1.9 98 47 8.1 4.3 42 3 52 Madagascar 22.4 34 7 2.7 -0 34.3 52.8 2.4 139 42 7.3 4.4 42 3 45 Malawi 16.8 40 12 2.9 0 26.0 41.2 2.4 175 66 7.3 5.5 45 3 41 Mauritius 1.3 11 8 0.3 -0 1.3 1.2 1.0 66 12.1 3.8 1.4 21 8 63 Mayotte 0.2 31 3 2.8 -5 0.3 0.5 2.1 53 4 7.9 4.1 45 2 62 Mozambique 25.1 43 13 2.9 0 38.4 63.5 2.5 165 85 6.6 5.7 45 3 39 Reunion 0.9 17 5 1.2 -5 1.0 1.2 1.4 53 7 4.8 2.4 24 9 63 Rwanda 11.1 31 8 2.3 -1 15.8 21.0 1.9 136 49 8.2 4.0 41 3 44 Seychelles 0.1 19 7 1.1 2 0.1 0.1 1.1 54 11.4 5.8 2.4 22 8 66 Somalia 10.8 44 12 3.2 -3 16.9 27.1 2.5 154 80 7.2 6.6 48 3 41 South Sudan 11.7 36 12 2.4 16 17.3 39.3 3.3 187 78 6.9 7.0 42 3 36 per woman to 2.8.in 2050. contraception. P O P UKuwait 3.7 18 2 1.7 35 5.1 6.6 1.8 47 8 7.2 2.4 23 2 66 Lebanon 5.0 13 4 0.9 20 5.2 5.3 1.1 44 9 5.0 1.5 20 9 66 Oman 4.1 20 2 1.8 39 5.4 6.3 1.6 120 9 7.3 2.8 22 3 50 Palestinian Territory 4.4 31 4 2.7 -1 6.6 9.1 2.1 99 20 7.9 4.1 40 3 56 Qatar 2.3 11 1 1.0 2 2.8 3.0 1.3 43 7 6.9 2.1 14 1 68 Saudi Arabia 30.8 22 4 1.8 2 37.4 42.4 1.4 122 16 7.3 2.9 30 3 53 Syria 22.0 24 4 2.1 -11 29.9 36.7 1.7 81 17 7.6 3.0 35 4 59 Turkey 77.2 16 5 1.1 0 88.3 93.3 1.2 145 10 5.7 2.1 25 8 52 United Arab Emirates 9.4 15 1 1.4 22 12.3 15.5 1.6 67 6 6.6 1.8 16 0 62 Yemen 26.0 36 8 2.8 -1 33.6 38.8 1.5 196 68 7.5 4.4 42 3 41 SOUTH CENTRAL ASIA 1,874 22 7 1.6 -1 2,220 2,516 1.3 133 47 5.7 2.5 31 5 49 CENTRAL ASIA 67 24 6 1.8 -1 81 93 1.4 95 41 5.1 2.7 29 5 62 Kazakhstan 17.3 23 8 1.5 -0 20.3 24.5 1.4 81 28 3.5 2.7 25 7 63 Kyrgyzstan 5.8 28 7 2.1 -1 7.5 9.4 1.6 105 27 4.9 3.2 31 4 61 Tajikistan 8.3 34 7 2.7 -5 11.2 14.8 1.8 129 57 6.9 3.8 36 3 60 Turkmenistan 5.3 22 8 1.4 -1 6.2 6.6 1.2 116 47 6.3 2.4 28 4 58 Uzbekistan 30.7 22 5 1.8 -1 35.8 38.1 1.2 89 44 6.5 2.4 28 4 63 SOUTH ASIA 1,806 22 7 1.5 -1 2,139 2,422 1.3 134 47 5.8 2.5 31 5 49 Afghanistan 31.3 35 8 2.7 -3 43.5 56.5 1.8 208 74 7.7 5.1 46 2 37 Bangladesh 158.5 20 6 1.5 -3 185.1 201.9 1.3 165 33 7.0 2.2 29 5 48 Bhutan 0.7 22 6 1.5 0 0.9 1.1 1.5 174 47 6.7 2.5 30 5 37 India 1,296.2 22 7 1.5 -0 1,510.0 1,656.9 1.3 129 44 5.5 2.4 31 5 49 Iran 77.4 19 5 1.4 -0 90.0 99.2 1.3 139 16 6.4 1.8 24 5 51 Maldives 0.4 23 3 1.9 -0 0.5 0.5 1.4 161 9 7.2 2.3 26 5 44 Nepal 27.1 22 7 1.5 -3 31.7 35.2 1.3 166 46 6.0 2.4 34 5 42 Pakistan 194.0 28 8 2.0 -3 254.7 348.0 1.8 123 74 6.6 3.8 38 4 53 Sri Lanka 20.7 18 6 1.2 -3 22.5 23.0 1.1 49 9 4.3 2.1 26 8 64 SOUTHEAST ASIA 621 19 7 1.3 -0 733 831 1.3 89 28 5.7 2.4 27 6 55 Brunei 0.4 16 3 1.3 1 0.5 0.5 1.3 34 4 5.8 1.6 25 5 67 Cambodia 14.8 24 6 1.8 -2 18.4 21.7 1.5 123 45 6.5 2.8 31 6 42 Indonesia 251.5 20 6 1.4 -1 306.7 365.3 1.5 109 32 5.5 2.6 29 5 52 Laos 6.8 26 6 2.0 -2 8.3 9.1 1.3 143 68 6.0 3.2 35 4 46 Malaysia 30.1 17 5 1.3 3 36.0 41.1 1.4 42 7 4.9 2.1 26 6 64 Myanmar 53.7 17 9 0.9 -1 58.7 58.6 1.1 116 49 6.0 2.0 25 5 51 Philippines 100.1 24 6 1.8 -1 127.8 157.1 1.6 63 23 6.3 3.0 34 4 61 Singapore 5.5 9 5 0.5 12 6.5 7.0 1.3 22 2.0 3.2 1.2 16 11 68 Thailand 66.4 12 8 0.4 0 66.8 61.0 0.9 69 11 5.6 1.8 18 10 60 Timor-Leste 1.2 37 10 2.7 0 1.8 2.9 2.4 186 63 5.9 5.7 42 5 40 Vietnam 90.7 17 7 1.0 -0 102.0 106.3 1.2 55 15 6.5 2.1 24 7 60 EAST ASIA 1,601 12 7 0.4 0 1,631 1,519 0.9 49 14 4.9 1.5 16 11 64 China 1,364.1 12 7 0.5 -0 1,400.1 1,311.8 1.0 51 15 5.5 1.6 16 10 63 China, Hong Kong SARf 7.2 8 6 0.2 4 8.1 8.6 1.2 21 1.6 3.3 1.1 11 15 72 China, Macao SARf 0.6 11 3 0.8 35 0.7 0.8 1.3 31 3 2.2 1.2 11 8 69 Japan 127.1 8 10 -0.2 1 116.6 97.1 0.8 14 1.9 2.1 1.4 13 26 72 Korea, North 24.9 15 9 0.5 -0 26.7 27.0 1.1 51 26 4.3 2.0 22 9 60 Korea, South 50.4 9 5 0.3 0 52.2 48.1 1.0 50 2.9 4.5 1.2 15 12 61 Mongolia 2.9 28 6 2.3 -0 3.5 4.3 1.5 112 26 7.6 2.9 28 4 55 Taiwan 23.4 8 7 0.1 1 23.5 21.0 0.9 27 3.7 3.9 1.1 14 12 68 EUROPE 741 11 11 0.0 2 746 726 1.0 27 6 2.3 1.6 16 17 70 EUROPEAN UNION 507 10 10 0.0 1 517 514 1.0 25 4 2.4 1.5 16 18 71 NORTHERN EUROPE 102 12 9 0.3 2 111 119 1.2 17 3 2.3 1.8 18 17 72 Channel Islands 0.2 11 8 0.3 0 0.2 0.2 1.1 24 2.9 2.1 1.7 15 16 72 Denmark 5.6 10 9 0.1 5 5.9 6.1 1.1 14 3.0 2.0 1.7 17 18 73 Estonia 1.3 11 12 -0.1 -5 1.2 1.2 0.9 22 2.1 2.2 1.5 16 18 70 Finland 5.5 11 9 0.1 3 5.8 6.1 1.1 13 1.8 1.8 1.8 16 19 70 Iceland 0.3 13 7 0.7 5 0.4 0.4 1.3 13 1.8 2.8 1.9 21 13 74 Ireland 4.6 15 7 0.9 -7 5.2 5.7 1.2 20 3.3 3.9 2.0 22 12 71 Latvia 2.0 10 14 -0.4 -12 1.6 1.4 0.7 20 3.6 2.0 1.5 14 19 70 Lithuania 2.9 10 14 -0.4 -6 2.7 2.5 0.9 23 3.6 2.4 1.6 15 18 71 POPULATION, HEALTH, AND ENVIRONMENT DATA AND ESTIMATES FOR THE COUNTRIES AND REGIONS OF THE WORLD
  • 11. © 2014 Population Reference Bureau See notes on page 18 2014 WORLD POPULATION DATA SHEET 11 POPULATION, HEALTH, AND ENVIRONMENT DATA AND ESTIMATES FOR THE Population mid-2014 (millions) Births per 1,000 Population Deaths per 1,000 Population Rate of Natural Increase (%) Net Migration Rate per 1,000 Population Projected Population (millions) 2050 Population as a Multiple of 2014 Infant Mortality Ratea Total Fertility Rateb Percent of Population mid-2030 mid-2050 1970 2013* 1970 2013* Ages 15 Ages 65+ Both Sex 1970 WORLD 7,238 20 8 1.2 — 8,444 9,683 1.3 89 38 4.7 2.5 26 8 58 MORE DEVELOPED 1,249 11 10 0.1 2 1,292 1,309 1.0 24 5 2.3 1.6 16 17 71 LESS DEVELOPED 5,989 22 7 1.4 0 7,152 8,375 1.4 100 42 5.7 2.6 29 6 55 LESS DEVELOPED (EXCL. CHINA) 4,625 24 7 1.7 -1 5,752 7,063 1.5 119 46 5.8 3.0 32 5 51 LEAST DEVELOPED 916 33 9 2.4 -1 1,290 1,855 2.0 150 64 5.7 4.3 40 4 44 AFRICA 1,136 36 10 2.5 0 1,637 2,428 2.1 139 62 6.7 4.7 41 4 45 SUB-SAHARAN AFRICA 920 37 11 2.6 0 1,360 2,081 2.3 138 67 6.7 5.1 43 3 44 NORTHERN AFRICA 217 28 7 2.2 -2 277 347 1.6 140 33 6.5 3.4 32 5 52 Algeria 39.1 25 6 1.9 -1 49.9 60.3 1.5 128 26 7.6 2.9 28 6 50 Egypt 87.9 32 6 2.6 -1 113.2 146.0 1.7 169 29 5.9 3.5 32 6 52 Libya 6.3 21 4 1.7 -7 7.5 8.4 1.3 104 14 7.9 2.4 29 5 56 Morocco 33.3 22 6 1.5 -3 38.2 41.4 1.2 118 29 6.7 2.6 28 5 53 Sudan 38.8 34 8 2.5 -4 55.1 77.1 2.0 97 55 6.9 5.2 41 3 52 Tunisia 11.0 19 6 1.3 -3 12.4 13.1 1.2 158 16 6.4 2.2 24 7 51 Western Saharae 0.6 21 6 1.5 17 0.8 0.8 1.4 168 37 6.6 2.4 27 3 42 WESTERN AFRICA 339 39 12 2.7 -1 507 784 2.3 152 66 6.7 5.4 44 3 41 Benin 10.3 37 10 2.7 -0 15.0 21.5 2.1 155 69 6.8 4.9 43 3 42 Burkina Faso 17.9 43 11 3.1 -2 28.4 46.6 2.6 163 70 6.6 5.9 46 2 39 Cape Verde 0.5 22 5 1.7 -7 0.6 0.7 1.5 109 24 6.9 2.6 30 5 52 Côte d'Ivoire 20.8 37 14 2.3 1 29.2 42.3 2.0 156 75 7.9 4.9 41 3 44 Gambia 1.9 41 10 3.1 -2 3.1 4.9 2.5 120 55 6.1 5.6 46 2 38 Ghana 27.0 34 9 2.5 -1 37.7 52.6 1.9 110 53 7.0 4.3 38 5 49 Guinea 11.6 38 12 2.7 -0 16.9 23.9 2.1 190 67 6.2 5.1 42 3 37 Guinea-Bissau 1.7 38 13 2.5 -1 2.5 3.5 2.0 144 94 6.1 5.0 41 3 44 Liberia 4.4 35 9 2.6 -1 6.4 9.4 2.1 186 54 6.7 4.7 43 3 39 Mali 15.9 42 13 2.9 -2 26.3 45.6 2.9 184 58 6.9 6.1 48 3 32 Mauritania 4.0 34 9 2.6 -1 5.6 7.9 2.0 110 72 6.8 4.1 40 3 49 Niger 18.2 50 11 3.9 -0 33.8 68.0 3.7 154 54 7.4 7.6 50 3 36 Nigeria 177.5 39 13 2.5 -0 261.7 396.5 2.2 153 69 6.5 5.6 44 3 41 Senegal 13.9 40 8 3.2 -1 21.8 35.1 2.5 111 43 7.3 5.3 44 3 39 Sierra Leone 6.3 38 17 2.1 -1 8.2 10.5 1.7 197 92 6.7 4.9 42 3 35 Togo 7.0 37 11 2.6 -0 10.0 14.5 2.1 120 66 7.1 4.7 42 3 47 EASTERN AFRICA 378 36 9 2.7 0 561 851 2.3 134 57 7.1 4.9 44 3 45 Burundi 10.5 45 13 3.2 -0 16.4 26.7 2.5 139 87 7.3 6.1 45 2 44 Comoros 0.7 34 9 2.5 -3 1.0 1.3 1.8 134 36 7.1 4.3 42 3 48 Djibouti 0.9 28 9 1.9 -4 1.1 1.2 1.4 112 55 6.8 3.4 34 4 49 Eritrea 6.5 33 7 2.6 2 9.8 14.3 2.2 151 42 6.7 4.7 43 2 41 Ethiopia 95.9 28 8 2.1 -0 130.5 165.1 1.7 144 50 7.0 4.1 43 3 43 Kenya 43.2 34 9 2.6 -0 60.0 81.3 1.9 98 47 8.1 4.3 42 3 52 Madagascar 22.4 34 7 2.7 -0 34.3 52.8 2.4 139 42 7.3 4.4 42 3 45 Malawi 16.8 40 12 2.9 0 26.0 41.2 2.4 175 66 7.3 5.5 45 3 41 Mauritius 1.3 11 8 0.3 -0 1.3 1.2 1.0 66 12.1 3.8 1.4 21 8 63 Mayotte 0.2 31 3 2.8 -5 0.3 0.5 2.1 53 4 7.9 4.1 45 2 62 Mozambique 25.1 43 13 2.9 0 38.4 63.5 2.5 165 85 6.6 5.7 45 3 39 Reunion 0.9 17 5 1.2 -5 1.0 1.2 1.4 53 7 4.8 2.4 24 9 63 Rwanda 11.1 31 8 2.3 -1 15.8 21.0 1.9 136 49 8.2 4.0 41 3 44 Seychelles 0.1 19 7 1.1 2 0.1 0.1 1.1 54 11.4 5.8 2.4 22 8 66 Somalia 10.8 44 12 3.2 -3 16.9 27.1 2.5 154 80 7.2 6.6 48 3 41 South Sudan 11.7 36 12 2.4 16 17.3 39.3 3.3 187 78 6.9 7.0 42 3 36 per woman to 2.8.in 2050. contraception. P O P UMongolia 2.9 28 6 2.3 -0 3.5 4.3 1.5 112 26 7.6 2.9 28 4 55 Taiwan 23.4 8 7 0.1 1 23.5 21.0 0.9 27 3.7 3.9 1.1 14 12 68 EUROPE 741 11 11 0.0 2 746 726 1.0 27 6 2.3 1.6 16 17 70 EUROPEAN UNION 507 10 10 0.0 1 517 514 1.0 25 4 2.4 1.5 16 18 71 NORTHERN EUROPE 102 12 9 0.3 2 111 119 1.2 17 3 2.3 1.8 18 17 72 Channel Islands 0.2 11 8 0.3 0 0.2 0.2 1.1 24 2.9 2.1 1.7 15 16 72 Denmark 5.6 10 9 0.1 5 5.9 6.1 1.1 14 3.0 2.0 1.7 17 18 73 Estonia 1.3 11 12 -0.1 -5 1.2 1.2 0.9 22 2.1 2.2 1.5 16 18 70 Finland 5.5 11 9 0.1 3 5.8 6.1 1.1 13 1.8 1.8 1.8 16 19 70 Iceland 0.3 13 7 0.7 5 0.4 0.4 1.3 13 1.8 2.8 1.9 21 13 74 Ireland 4.6 15 7 0.9 -7 5.2 5.7 1.2 20 3.3 3.9 2.0 22 12 71 Latvia 2.0 10 14 -0.4 -12 1.6 1.4 0.7 20 3.6 2.0 1.5 14 19 70 Lithuania 2.9 10 14 -0.4 -6 2.7 2.5 0.9 23 3.6 2.4 1.6 15 18 71 Norway 5.1 12 8 0.4 8 6.0 6.7 1.3 11 2.5 2.5 1.8 18 16 74 Sweden 9.7 12 9 0.2 2 10.8 11.4 1.2 11 2.3 1.9 1.9 17 19 74 United Kingdom 64.5 12 9 0.3 3 71.1 77.0 1.2 13 3.9 2.4 1.9 18 17 72 WESTERN EUROPE 190 10 10 0.0 3 196 198 1.0 20 3 2.2 1.7 16 19 71 Austria 8.5 9 9 0.0 6 9.0 9.4 1.1 26 3.1 2.3 1.4 14 18 70 Belgium 11.2 11 10 0.2 4 11.9 12.6 1.1 21 3.8 2.3 1.8 17 18 71 France 64.1 12 9 0.3 1 68.3 72.1 1.1 18 3.6 2.5 2.0 18 18 72 Germany 80.9 8 11 -0.2 5 80.0 76.2 0.9 22 3.3 2.1 1.4 13 21 71 Liechtenstein 0.04 10 6 0.4 4 0.04 0.04 1.2 — 3.3 — 1.5 16 15 — Luxembourg 0.6 11 7 0.4 19 0.7 0.7 1.3 25 3.5 2.0 1.6 17 14 70 Monaco 0.04 6 7 -0.1 23 0.04 0.05 1.4 — — — 1.4 13 24 — Netherlands 16.9 10 8 0.2 1 17.6 17.9 1.1 13 3.8 2.6 1.7 17 17 74 Switzerland 8.2 10 8 0.2 6 8.7 9.0 1.1 15 3.6 2.1 1.5 15 18 73 EASTERN EUROPE 294 12 13 -0.1 1 285 262 0.9 29 8 2.1 1.5 15 14 69 Belarus 9.5 13 13 -0.1 1 9.3 9.0 1.0 23 4.3 2.3 1.7 15 14 71 Bulgaria 7.2 9 14 -0.5 -0 6.5 5.7 0.8 27 7.3 2.2 1.5 14 20 71 Czech Republic 10.5 10 10 0.0 -0 10.8 11.1 1.1 20 2.5 1.9 1.5 15 17 70 Hungary 9.9 9 13 -0.4 1 9.7 9.4 0.9 36 5.1 2.0 1.3 14 17 70 Moldova 4.1 11 11 0.0 -0 3.4 2.1 0.5 47 14 2.6 1.2 16 10 65 Poland 38.5 10 10 -0.1 -0 37.5 34.8 0.9 37 4.6 2.3 1.2 15 14 70 Romania 20.0 10 12 -0.3 -0 18.7 16.5 0.8 49 8.5 2.9 1.3 16 16 68 Russiag 143.7 13 13 0.0 2 143.5 134.1 0.9 28 10.3 2.0 1.7 16 13 69 Slovakia 5.4 10 10 0.1 0 5.4 5.0 0.9 26 5.5 2.4 1.3 15 14 70 Ukraineg 42.9 11 15 -0.4 1 40.1 33.8 0.7 22 7.0 2.1 1.5 15 15 71 SOUTHERN EUROPE 154 9 10 -0.1 -1 153 147 1.0 36 4 2.6 1.3 15 19 70 Albania 3.0 12 7 0.5 -6 3.1 2.9 1.0 98 14.4 5.1 1.8 19 12 67 Andorra 0.1 8 3 0.5 -7 0.1 0.1 0.9 — 3.4 — 1.1 15 13 — Bosnia-Herzegovina 3.8 8 9 -0.1 0 3.7 3.3 0.9 70 5 2.7 1.3 16 16 66 Croatia 4.2 10 13 -0.3 -1 4.0 3.6 0.8 34 3.6 1.8 1.6 15 19 68 Greece 11.0 9 11 -0.1 -4 10.7 9.4 0.9 30 2.9 2.4 1.3 15 20 71 Italy 61.3 9 10 -0.1 3 63.4 63.5 1.0 29 3.2 2.4 1.4 14 21 71 Kosovoh 1.8 15 4 1.1 -2 2.0 1.9 1.0 — 11 — 2.0 28 7 — Macedoniai 2.1 11 9 0.2 1 2.0 1.8 0.9 88 10 3.0 1.5 17 12 66 Malta 0.4 10 8 0.2 7 0.4 0.4 0.9 28 5.7 2.0 1.4 15 16 71 Montenegro 0.6 12 10 0.3 -3 0.7 0.8 1.2 40 5.2 2.7 1.7 19 13 70 Portugal 10.4 8 10 -0.2 -4 9.9 9.1 0.9 58 3.0 3.0 1.2 15 19 67 San Marino 0.03 10 7 0.3 5 0.04 0.04 1.1 — 6.4 2.2 1.5 15 18 — Serbia 7.1 9 14 -0.5 0 6.7 6.4 0.9 59 5.4 2.4 1.4 14 18 68 Slovenia 2.1 10 9 0.1 -0 2.1 2.1 1.0 25 2.9 2.2 1.5 15 17 69 Spain 46.5 9 8 0.1 -4 44.5 42.3 0.9 21 3.1 2.9 1.3 15 18 72 OCEANIA 39 18 7 1.1 6 48 60 1.6 43 21 3.4 2.4 24 11 66 Australia 23.5 13 6 0.7 10 28.6 36.4 1.5 18 3.3 2.9 1.9 19 14 71 Federated States of Micronesia 0.1 24 5 1.9 -19 0.1 0.1 0.9 63 29 6.9 3.5 34 4 62 Fiji 0.9 21 8 1.4 -6 0.9 1.0 1.2 44 15 4.5 2.5 29 5 60 French Polynesia 0.3 17 6 1.1 -6 0.3 0.3 1.2 76 5.1 5.1 2.1 25 6 60 Guam 0.2 22 5 1.7 -6 0.2 0.3 1.6 45 13.4 4.4 3.1 27 7 66 POPULATION, HEALTH, AND ENVIRONMENT DATA AND ESTIMATES FOR THE COUNTRIES AND REGIONS OF THE WORLD
  • 12. © 2014 Population Reference Bureau See notes on page 18 2014 WORLD POPULATION DATA SHEET 12 POPULATION, HEALTH, AND ENVIRONMENT DATA AND ESTIMATES FOR THE Population mid-2014 (millions) Births per 1,000 Population Deaths per 1,000 Population Rate of Natural Increase (%) Net Migration Rate per 1,000 Population Projected Population (millions) 2050 Population as a Multiple of 2014 Infant Mortality Ratea Total Fertility Rateb Percent of Population mid-2030 mid-2050 1970 2013* 1970 2013* Ages 15 Ages 65+ Both Sex 1970 WORLD 7,238 20 8 1.2 — 8,444 9,683 1.3 89 38 4.7 2.5 26 8 58 MORE DEVELOPED 1,249 11 10 0.1 2 1,292 1,309 1.0 24 5 2.3 1.6 16 17 71 LESS DEVELOPED 5,989 22 7 1.4 0 7,152 8,375 1.4 100 42 5.7 2.6 29 6 55 LESS DEVELOPED (EXCL. CHINA) 4,625 24 7 1.7 -1 5,752 7,063 1.5 119 46 5.8 3.0 32 5 51 LEAST DEVELOPED 916 33 9 2.4 -1 1,290 1,855 2.0 150 64 5.7 4.3 40 4 44 AFRICA 1,136 36 10 2.5 0 1,637 2,428 2.1 139 62 6.7 4.7 41 4 45 SUB-SAHARAN AFRICA 920 37 11 2.6 0 1,360 2,081 2.3 138 67 6.7 5.1 43 3 44 NORTHERN AFRICA 217 28 7 2.2 -2 277 347 1.6 140 33 6.5 3.4 32 5 52 Algeria 39.1 25 6 1.9 -1 49.9 60.3 1.5 128 26 7.6 2.9 28 6 50 Egypt 87.9 32 6 2.6 -1 113.2 146.0 1.7 169 29 5.9 3.5 32 6 52 Libya 6.3 21 4 1.7 -7 7.5 8.4 1.3 104 14 7.9 2.4 29 5 56 Morocco 33.3 22 6 1.5 -3 38.2 41.4 1.2 118 29 6.7 2.6 28 5 53 Sudan 38.8 34 8 2.5 -4 55.1 77.1 2.0 97 55 6.9 5.2 41 3 52 Tunisia 11.0 19 6 1.3 -3 12.4 13.1 1.2 158 16 6.4 2.2 24 7 51 Western Saharae 0.6 21 6 1.5 17 0.8 0.8 1.4 168 37 6.6 2.4 27 3 42 WESTERN AFRICA 339 39 12 2.7 -1 507 784 2.3 152 66 6.7 5.4 44 3 41 Benin 10.3 37 10 2.7 -0 15.0 21.5 2.1 155 69 6.8 4.9 43 3 42 Burkina Faso 17.9 43 11 3.1 -2 28.4 46.6 2.6 163 70 6.6 5.9 46 2 39 Cape Verde 0.5 22 5 1.7 -7 0.6 0.7 1.5 109 24 6.9 2.6 30 5 52 Côte d'Ivoire 20.8 37 14 2.3 1 29.2 42.3 2.0 156 75 7.9 4.9 41 3 44 Gambia 1.9 41 10 3.1 -2 3.1 4.9 2.5 120 55 6.1 5.6 46 2 38 Ghana 27.0 34 9 2.5 -1 37.7 52.6 1.9 110 53 7.0 4.3 38 5 49 Guinea 11.6 38 12 2.7 -0 16.9 23.9 2.1 190 67 6.2 5.1 42 3 37 Guinea-Bissau 1.7 38 13 2.5 -1 2.5 3.5 2.0 144 94 6.1 5.0 41 3 44 Liberia 4.4 35 9 2.6 -1 6.4 9.4 2.1 186 54 6.7 4.7 43 3 39 Mali 15.9 42 13 2.9 -2 26.3 45.6 2.9 184 58 6.9 6.1 48 3 32 Mauritania 4.0 34 9 2.6 -1 5.6 7.9 2.0 110 72 6.8 4.1 40 3 49 Niger 18.2 50 11 3.9 -0 33.8 68.0 3.7 154 54 7.4 7.6 50 3 36 Nigeria 177.5 39 13 2.5 -0 261.7 396.5 2.2 153 69 6.5 5.6 44 3 41 Senegal 13.9 40 8 3.2 -1 21.8 35.1 2.5 111 43 7.3 5.3 44 3 39 Sierra Leone 6.3 38 17 2.1 -1 8.2 10.5 1.7 197 92 6.7 4.9 42 3 35 Togo 7.0 37 11 2.6 -0 10.0 14.5 2.1 120 66 7.1 4.7 42 3 47 EASTERN AFRICA 378 36 9 2.7 0 561 851 2.3 134 57 7.1 4.9 44 3 45 Burundi 10.5 45 13 3.2 -0 16.4 26.7 2.5 139 87 7.3 6.1 45 2 44 Comoros 0.7 34 9 2.5 -3 1.0 1.3 1.8 134 36 7.1 4.3 42 3 48 Djibouti 0.9 28 9 1.9 -4 1.1 1.2 1.4 112 55 6.8 3.4 34 4 49 Eritrea 6.5 33 7 2.6 2 9.8 14.3 2.2 151 42 6.7 4.7 43 2 41 Ethiopia 95.9 28 8 2.1 -0 130.5 165.1 1.7 144 50 7.0 4.1 43 3 43 Kenya 43.2 34 9 2.6 -0 60.0 81.3 1.9 98 47 8.1 4.3 42 3 52 Madagascar 22.4 34 7 2.7 -0 34.3 52.8 2.4 139 42 7.3 4.4 42 3 45 Malawi 16.8 40 12 2.9 0 26.0 41.2 2.4 175 66 7.3 5.5 45 3 41 Mauritius 1.3 11 8 0.3 -0 1.3 1.2 1.0 66 12.1 3.8 1.4 21 8 63 Mayotte 0.2 31 3 2.8 -5 0.3 0.5 2.1 53 4 7.9 4.1 45 2 62 Mozambique 25.1 43 13 2.9 0 38.4 63.5 2.5 165 85 6.6 5.7 45 3 39 Reunion 0.9 17 5 1.2 -5 1.0 1.2 1.4 53 7 4.8 2.4 24 9 63 Rwanda 11.1 31 8 2.3 -1 15.8 21.0 1.9 136 49 8.2 4.0 41 3 44 Seychelles 0.1 19 7 1.1 2 0.1 0.1 1.1 54 11.4 5.8 2.4 22 8 66 Somalia 10.8 44 12 3.2 -3 16.9 27.1 2.5 154 80 7.2 6.6 48 3 41 South Sudan 11.7 36 12 2.4 16 17.3 39.3 3.3 187 78 6.9 7.0 42 3 36 per woman to 2.8.in 2050. contraception. P O P UItaly 61.3 9 10 -0.1 3 63.4 63.5 1.0 29 3.2 2.4 1.4 14 21 71 Kosovoh 1.8 15 4 1.1 -2 2.0 1.9 1.0 — 11 — 2.0 28 7 — Macedoniai 2.1 11 9 0.2 1 2.0 1.8 0.9 88 10 3.0 1.5 17 12 66 Malta 0.4 10 8 0.2 7 0.4 0.4 0.9 28 5.7 2.0 1.4 15 16 71 Montenegro 0.6 12 10 0.3 -3 0.7 0.8 1.2 40 5.2 2.7 1.7 19 13 70 Portugal 10.4 8 10 -0.2 -4 9.9 9.1 0.9 58 3.0 3.0 1.2 15 19 67 San Marino 0.03 10 7 0.3 5 0.04 0.04 1.1 — 6.4 2.2 1.5 15 18 — Serbia 7.1 9 14 -0.5 0 6.7 6.4 0.9 59 5.4 2.4 1.4 14 18 68 Slovenia 2.1 10 9 0.1 -0 2.1 2.1 1.0 25 2.9 2.2 1.5 15 17 69 Spain 46.5 9 8 0.1 -4 44.5 42.3 0.9 21 3.1 2.9 1.3 15 18 72 OCEANIA 39 18 7 1.1 6 48 60 1.6 43 21 3.4 2.4 24 11 66 Australia 23.5 13 6 0.7 10 28.6 36.4 1.5 18 3.3 2.9 1.9 19 14 71 Federated States of Micronesia 0.1 24 5 1.9 -19 0.1 0.1 0.9 63 29 6.9 3.5 34 4 62 Fiji 0.9 21 8 1.4 -6 0.9 1.0 1.2 44 15 4.5 2.5 29 5 60 French Polynesia 0.3 17 6 1.1 -6 0.3 0.3 1.2 76 5.1 5.1 2.1 25 6 60 Guam 0.2 22 5 1.7 -6 0.2 0.3 1.6 45 13.4 4.4 3.1 27 7 66 Kiribati 0.1 30 9 2.1 -1 0.2 0.2 1.9 114 45 6.1 3.8 35 4 51 Marshall Islands 0.1 30 4 2.5 -17 0.1 0.1 1.3 — 26 — 4.1 40 2 — Nauru 0.01 36 8 2.9 -9 0.1 0.1 1.6 — 39 — 4.3 37 1 — New Caledonia 0.3 17 5 1.2 4 0.3 0.3 1.3 59 5 5.3 2.2 24 8 62 New Zealand 4.3 13 7 0.7 5 4.9 5.5 1.3 17 4.4 3.2 2.0 20 14 71 Palau 0.02 14 9 0.5 0 0.1 0.1 1.0 — 11 — 1.7 20 6 — Papua New Guinea 7.6 33 10 2.3 0 10.5 14.2 1.9 106 48 6.2 4.3 39 3 46 Samoa 0.2 29 5 2.4 -24 0.2 0.2 1.3 73 16 7.2 4.7 39 5 55 Solomon Islands 0.6 31 5 2.6 0 0.9 0.4 0.6 98 26 6.9 4.1 39 3 54 Tonga 0.1 27 7 2.0 -19 0.1 0.1 1.2 40 17 5.9 3.9 37 6 65 Tuvalu 0.01 25 9 1.6 0 0.1 0.1 1.8 — 10 — 3.2 33 5 — Vanuatu 0.3 29 5 2.4 0 0.4 0.5 1.8 108 21 6.3 4.4 39 4 52 Population (millions) Birth Rate Death Rate Natural Increase (%) Migration Rate mid-2030 mid-2050 Population Change 1970 2013* 1970 2013* 15 65+ Both, 197 Population (millions) Infant Mortality Total Fertility Rate % of Population POPULATION, HEALTH, AND ENVIRONMENT DATA AND ESTIMATES FOR THE COUNTRIES AND REGIONS OF THE WORLD
  • 13. © 2014 Population Reference Bureau See notes on page 18 2014 WORLD POPULATION DATA SHEET 13 ENVIRONMENT DATA AND ESTIMATES FOR THE COUNTRIES AND REGIONS OF THE WORLD Infant Mortality Ratea Total Fertility Rateb Percent of Population Life Expectancy at Birth (years) Percent Urban Percent of Married Women 15-49 Using Contraceptionc Population per Square Kilometer GNI PPP per Capita ($US) 2013d Carbon Emissions (million tons) 1990 2012970 2013* 1970 2013* Ages 15 Ages 65+ Both Sexes 1970 Both Sexes 2013* Males 2013* Females 2013* All Methods Modern Methods 89 38 4.7 2.5 26 8 58 71 69 73 53 63 56 53 14,210 6,127 9,667 24 5 2.3 1.6 16 17 71 79 75 82 77 70 60 23 37,470 3,883 3,606 00 42 5.7 2.6 29 6 55 69 67 71 48 61 55 72 8,920 2,029 5,510 19 46 5.8 3.0 32 5 51 67 65 69 46 54 46 63 8,060 1,358 2,884 50 64 5.7 4.3 40 4 44 61 60 62 28 36 30 44 1,970 20 62 39 62 6.7 4.7 41 4 45 59 58 60 40 34 28 37 4,470 188 331 38 67 6.7 5.1 43 3 44 57 56 58 37 29 23 41 3,220 125 193 40 33 6.5 3.4 32 5 52 69 68 71 51 53 47 28 9,600 64 139 28 26 7.6 2.9 28 6 50 71 69 73 73 61 52 16 12,990 21.5 37.7 69 29 5.9 3.5 32 6 52 71 69 72 43 60 58 88 10,850 20.7 58.7 04 14 7.9 2.4 29 5 56 75 73 77 78 42 20 4 28,110 10.0 16.7 18 29 6.7 2.6 28 5 53 71 69 73 59 67 57 75 7,000 6.4 14.3 97 55 6.9 5.2 41 3 52 62 60 64 33 9 — 21 2,370 1.5 3.9 58 16 6.4 2.2 24 7 51 75 73 77 66 63 50 67 10,960 3.6 7.5 68 37 6.6 2.4 27 3 42 68 66 70 82 — — 2 — 0.0 0.0 52 66 6.7 5.4 44 3 41 55 54 55 45 17 11 55 3,930 18 33 55 69 6.8 4.9 43 3 42 59 58 61 45 13 7 91 1,780 0.2 1.5 63 70 6.6 5.9 46 2 39 56 56 57 27 16 15 65 1,560 0.2 0.5 09 24 6.9 2.6 30 5 52 75 71 79 62 61 57 126 6,220 0.0 0.1 56 75 7.9 4.9 41 3 44 51 50 51 53 18 12 65 2,900 1.6 1.7 20 55 6.1 5.6 46 2 38 59 57 60 57 9 8 169 1,620 0.1 0.1 10 53 7.0 4.3 38 5 49 61 60 62 51 35 23 113 3,880 1.1 2.5 90 67 6.2 5.1 42 3 37 56 55 57 36 6 3 47 1,160 0.3 0.3 44 94 6.1 5.0 41 3 44 54 53 56 44 14 10 48 1,240 0.1 0.1 86 54 6.7 4.7 43 3 39 60 59 61 47 20 19 39 790 0.1 0.2 84 58 6.9 6.1 48 3 32 55 55 54 35 10 10 13 1,540 0.1 0.2 10 72 6.8 4.1 40 3 49 62 60 63 41 9 8 4 2,850 0.7 0.6 54 54 7.4 7.6 50 3 36 58 58 58 22 14 8 14 910 0.2 0.4 53 69 6.5 5.6 44 3 41 52 52 53 50 15 9 192 5,600 12.4 22.2 11 43 7.3 5.3 44 3 39 63 62 65 47 18 16 71 2,240 0.9 2.0 97 92 6.7 4.9 42 3 35 45 45 46 41 17 15 88 1,750 0.1 0.2 20 66 7.1 4.7 42 3 47 56 56 57 38 15 13 123 1,180 0.2 0.4 34 57 7.1 4.9 44 3 45 60 59 62 24 39 31 54 1,570 11 17 39 87 7.3 6.1 45 2 44 54 52 56 10 22 18 377 820 0.1 0.1 34 36 7.1 4.3 42 3 48 61 59 61 28 19 13 335 1,560 0.0 0.0 12 55 6.8 3.4 34 4 49 62 60 63 77 19 18 38 — 0.1 0.2 51 42 6.7 4.7 43 2 41 63 60 65 21 8 7 56 1,180 — 0.1 44 50 7.0 4.1 43 3 43 63 62 65 17 42 40 87 1,350 0.8 1.8 98 47 8.1 4.3 42 3 52 62 60 64 24 46 39 74 2,250 1.6 3.5 39 42 7.3 4.4 42 3 45 65 63 66 33 40 33 38 1,350 0.3 0.6 75 66 7.3 5.5 45 3 41 55 55 55 16 46 42 142 760 0.2 0.4 66 12.1 3.8 1.4 21 8 63 74 70 77 42 76 39 618 17,220 0.4 1.2 53 4 7.9 4.1 45 2 62 79 76 82 50 — — 600 — — — 65 85 6.6 5.7 45 3 39 53 51 55 31 12 11 31 1,040 0.3 0.8 53 7 4.8 2.4 24 9 63 80 77 83 94 67 64 339 — 0.4 1.2 36 49 8.2 4.0 41 3 44 65 63 66 17 52 45 421 1,430 0.2 0.2 54 11.4 5.8 2.4 22 8 66 73 69 78 54 — — 198 23,270 0.0 0.2 54 80 7.2 6.6 48 3 41 55 53 57 38 15 1 17 — 0.0 0.2 87 78 6.9 7.0 42 3 36 55 54 56 17 4 1 18 2,190 — — ASIA ASIA (Excl. China WESTERN ASIA Armenia Azerbaijan Bahrain Cyprus Georgia Iraq Israel Jordan Kuwait Lebanon Oman Palestinian Terri Qatar Saudi Arabia Syria Turkey United Arab Em Yemen SOUTH CENTRA CENTRAL ASIA Kazakhstan Kyrgyzstan Tajikistan Turkmenistan Uzbekistan SOUTH ASIA Afghanistan Bangladesh Bhutan India Iran Maldives Nepal Pakistan Sri Lanka SOUTHEAST ASI Brunei Cambodia Indonesia Laos Malaysia Myanmar Philippines Singapore Thailand Timor-Leste P O P U L A T I O N R E F E R E N C E B POPULATION, HEALTH, AND ENVIRONMENT DATA AND ESTIMATES Population mid-2014 (millions) Births per 1,000 Population Deaths per 1,000 Population Rate of Natural Increase (%) Net Migration Rate per 1,000 Population Projected Population (millions) 2050 Population as a Multiple of 2014 Infant Mortality Ratea Total Fertility Rateb Percent of Popu mid-2030 mid-2050 1970 2013* 1970 2013* Ages 15 Ag WORLD 7,238 20 8 1.2 — 8,444 9,683 1.3 89 38 4.7 2.5 26 MORE DEVELOPED 1,249 11 10 0.1 2 1,292 1,309 1.0 24 5 2.3 1.6 16 LESS DEVELOPED 5,989 22 7 1.4 0 7,152 8,375 1.4 100 42 5.7 2.6 29 LESS DEVELOPED (EXCL. CHINA) 4,625 24 7 1.7 -1 5,752 7,063 1.5 119 46 5.8 3.0 32 LEAST DEVELOPED 916 33 9 2.4 -1 1,290 1,855 2.0 150 64 5.7 4.3 40 AFRICA 1,136 36 10 2.5 0 1,637 2,428 2.1 139 62 6.7 4.7 41 SUB-SAHARAN AFRICA 920 37 11 2.6 0 1,360 2,081 2.3 138 67 6.7 5.1 43 NORTHERN AFRICA 217 28 7 2.2 -2 277 347 1.6 140 33 6.5 3.4 32 Algeria 39.1 25 6 1.9 -1 49.9 60.3 1.5 128 26 7.6 2.9 28 Egypt 87.9 32 6 2.6 -1 113.2 146.0 1.7 169 29 5.9 3.5 32 Libya 6.3 21 4 1.7 -7 7.5 8.4 1.3 104 14 7.9 2.4 29 Morocco 33.3 22 6 1.5 -3 38.2 41.4 1.2 118 29 6.7 2.6 28 Sudan 38.8 34 8 2.5 -4 55.1 77.1 2.0 97 55 6.9 5.2 41 Tunisia 11.0 19 6 1.3 -3 12.4 13.1 1.2 158 16 6.4 2.2 24 Western Saharae 0.6 21 6 1.5 17 0.8 0.8 1.4 168 37 6.6 2.4 27 WESTERN AFRICA 339 39 12 2.7 -1 507 784 2.3 152 66 6.7 5.4 44 Benin 10.3 37 10 2.7 -0 15.0 21.5 2.1 155 69 6.8 4.9 43 Burkina Faso 17.9 43 11 3.1 -2 28.4 46.6 2.6 163 70 6.6 5.9 46 Cape Verde 0.5 22 5 1.7 -7 0.6 0.7 1.5 109 24 6.9 2.6 30 Côte d'Ivoire 20.8 37 14 2.3 1 29.2 42.3 2.0 156 75 7.9 4.9 41 Gambia 1.9 41 10 3.1 -2 3.1 4.9 2.5 120 55 6.1 5.6 46 Ghana 27.0 34 9 2.5 -1 37.7 52.6 1.9 110 53 7.0 4.3 38 Guinea 11.6 38 12 2.7 -0 16.9 23.9 2.1 190 67 6.2 5.1 42 Guinea-Bissau 1.7 38 13 2.5 -1 2.5 3.5 2.0 144 94 6.1 5.0 41 Liberia 4.4 35 9 2.6 -1 6.4 9.4 2.1 186 54 6.7 4.7 43 Mali 15.9 42 13 2.9 -2 26.3 45.6 2.9 184 58 6.9 6.1 48 Mauritania 4.0 34 9 2.6 -1 5.6 7.9 2.0 110 72 6.8 4.1 40 Niger 18.2 50 11 3.9 -0 33.8 68.0 3.7 154 54 7.4 7.6 50 Nigeria 177.5 39 13 2.5 -0 261.7 396.5 2.2 153 69 6.5 5.6 44 Senegal 13.9 40 8 3.2 -1 21.8 35.1 2.5 111 43 7.3 5.3 44 Sierra Leone 6.3 38 17 2.1 -1 8.2 10.5 1.7 197 92 6.7 4.9 42 Togo 7.0 37 11 2.6 -0 10.0 14.5 2.1 120 66 7.1 4.7 42 EASTERN AFRICA 378 36 9 2.7 0 561 851 2.3 134 57 7.1 4.9 44 Burundi 10.5 45 13 3.2 -0 16.4 26.7 2.5 139 87 7.3 6.1 45 Comoros 0.7 34 9 2.5 -3 1.0 1.3 1.8 134 36 7.1 4.3 42 Djibouti 0.9 28 9 1.9 -4 1.1 1.2 1.4 112 55 6.8 3.4 34 Eritrea 6.5 33 7 2.6 2 9.8 14.3 2.2 151 42 6.7 4.7 43 Ethiopia 95.9 28 8 2.1 -0 130.5 165.1 1.7 144 50 7.0 4.1 43 Kenya 43.2 34 9 2.6 -0 60.0 81.3 1.9 98 47 8.1 4.3 42 Madagascar 22.4 34 7 2.7 -0 34.3 52.8 2.4 139 42 7.3 4.4 42 Malawi 16.8 40 12 2.9 0 26.0 41.2 2.4 175 66 7.3 5.5 45 Mauritius 1.3 11 8 0.3 -0 1.3 1.2 1.0 66 12.1 3.8 1.4 21 Mayotte 0.2 31 3 2.8 -5 0.3 0.5 2.1 53 4 7.9 4.1 45 Mozambique 25.1 43 13 2.9 0 38.4 63.5 2.5 165 85 6.6 5.7 45 Reunion 0.9 17 5 1.2 -5 1.0 1.2 1.4 53 7 4.8 2.4 24 Rwanda 11.1 31 8 2.3 -1 15.8 21.0 1.9 136 49 8.2 4.0 41 Seychelles 0.1 19 7 1.1 2 0.1 0.1 1.1 54 11.4 5.8 2.4 22 Somalia 10.8 44 12 3.2 -3 16.9 27.1 2.5 154 80 7.2 6.6 48 South Sudan 11.7 36 12 2.4 16 17.3 39.3 3.3 187 78 6.9 7.0 42 per woman to 2.8.in 2050. contraception. P O POPULATION, HEALTH, AND ENVIRONMENT DATA AND ESTIMATES FOR THE COUNTRIES AND REGIONS OF THE WORLD
  • 14. © 2014 Population Reference Bureau See notes on page 18 2014 WORLD POPULATION DATA SHEET 14 ENVIRONMENT DATA AND ESTIMATES FOR THE COUNTRIES AND REGIONS OF THE WORLD Infant Mortality Ratea Total Fertility Rateb Percent of Population Life Expectancy at Birth (years) Percent Urban Percent of Married Women 15-49 Using Contraceptionc Population per Square Kilometer GNI PPP per Capita ($US) 2013d Carbon Emissions (million tons) 1990 2012970 2013* 1970 2013* Ages 15 Ages 65+ Both Sexes 1970 Both Sexes 2013* Males 2013* Females 2013* All Methods Modern Methods 89 38 4.7 2.5 26 8 58 71 69 73 53 63 56 53 14,210 6,127 9,667 24 5 2.3 1.6 16 17 71 79 75 82 77 70 60 23 37,470 3,883 3,606 00 42 5.7 2.6 29 6 55 69 67 71 48 61 55 72 8,920 2,029 5,510 19 46 5.8 3.0 32 5 51 67 65 69 46 54 46 63 8,060 1,358 2,884 50 64 5.7 4.3 40 4 44 61 60 62 28 36 30 44 1,970 20 62 39 62 6.7 4.7 41 4 45 59 58 60 40 34 28 37 4,470 188 331 38 67 6.7 5.1 43 3 44 57 56 58 37 29 23 41 3,220 125 193 40 33 6.5 3.4 32 5 52 69 68 71 51 53 47 28 9,600 64 139 28 26 7.6 2.9 28 6 50 71 69 73 73 61 52 16 12,990 21.5 37.7 69 29 5.9 3.5 32 6 52 71 69 72 43 60 58 88 10,850 20.7 58.7 04 14 7.9 2.4 29 5 56 75 73 77 78 42 20 4 28,110 10.0 16.7 18 29 6.7 2.6 28 5 53 71 69 73 59 67 57 75 7,000 6.4 14.3 97 55 6.9 5.2 41 3 52 62 60 64 33 9 — 21 2,370 1.5 3.9 58 16 6.4 2.2 24 7 51 75 73 77 66 63 50 67 10,960 3.6 7.5 68 37 6.6 2.4 27 3 42 68 66 70 82 — — 2 — 0.0 0.0 52 66 6.7 5.4 44 3 41 55 54 55 45 17 11 55 3,930 18 33 55 69 6.8 4.9 43 3 42 59 58 61 45 13 7 91 1,780 0.2 1.5 63 70 6.6 5.9 46 2 39 56 56 57 27 16 15 65 1,560 0.2 0.5 09 24 6.9 2.6 30 5 52 75 71 79 62 61 57 126 6,220 0.0 0.1 56 75 7.9 4.9 41 3 44 51 50 51 53 18 12 65 2,900 1.6 1.7 20 55 6.1 5.6 46 2 38 59 57 60 57 9 8 169 1,620 0.1 0.1 10 53 7.0 4.3 38 5 49 61 60 62 51 35 23 113 3,880 1.1 2.5 90 67 6.2 5.1 42 3 37 56 55 57 36 6 3 47 1,160 0.3 0.3 44 94 6.1 5.0 41 3 44 54 53 56 44 14 10 48 1,240 0.1 0.1 86 54 6.7 4.7 43 3 39 60 59 61 47 20 19 39 790 0.1 0.2 84 58 6.9 6.1 48 3 32 55 55 54 35 10 10 13 1,540 0.1 0.2 10 72 6.8 4.1 40 3 49 62 60 63 41 9 8 4 2,850 0.7 0.6 54 54 7.4 7.6 50 3 36 58 58 58 22 14 8 14 910 0.2 0.4 53 69 6.5 5.6 44 3 41 52 52 53 50 15 9 192 5,600 12.4 22.2 11 43 7.3 5.3 44 3 39 63 62 65 47 18 16 71 2,240 0.9 2.0 97 92 6.7 4.9 42 3 35 45 45 46 41 17 15 88 1,750 0.1 0.2 20 66 7.1 4.7 42 3 47 56 56 57 38 15 13 123 1,180 0.2 0.4 34 57 7.1 4.9 44 3 45 60 59 62 24 39 31 54 1,570 11 17 39 87 7.3 6.1 45 2 44 54 52 56 10 22 18 377 820 0.1 0.1 34 36 7.1 4.3 42 3 48 61 59 61 28 19 13 335 1,560 0.0 0.0 12 55 6.8 3.4 34 4 49 62 60 63 77 19 18 38 — 0.1 0.2 51 42 6.7 4.7 43 2 41 63 60 65 21 8 7 56 1,180 — 0.1 44 50 7.0 4.1 43 3 43 63 62 65 17 42 40 87 1,350 0.8 1.8 98 47 8.1 4.3 42 3 52 62 60 64 24 46 39 74 2,250 1.6 3.5 39 42 7.3 4.4 42 3 45 65 63 66 33 40 33 38 1,350 0.3 0.6 75 66 7.3 5.5 45 3 41 55 55 55 16 46 42 142 760 0.2 0.4 66 12.1 3.8 1.4 21 8 63 74 70 77 42 76 39 618 17,220 0.4 1.2 53 4 7.9 4.1 45 2 62 79 76 82 50 — — 600 — — — 65 85 6.6 5.7 45 3 39 53 51 55 31 12 11 31 1,040 0.3 0.8 53 7 4.8 2.4 24 9 63 80 77 83 94 67 64 339 — 0.4 1.2 36 49 8.2 4.0 41 3 44 65 63 66 17 52 45 421 1,430 0.2 0.2 54 11.4 5.8 2.4 22 8 66 73 69 78 54 — — 198 23,270 0.0 0.2 54 80 7.2 6.6 48 3 41 55 53 57 38 15 1 17 — 0.0 0.2 87 78 6.9 7.0 42 3 36 55 54 56 17 4 1 18 2,190 — — ASIA ASIA (Excl. China WESTERN ASIA Armenia Azerbaijan Bahrain Cyprus Georgia Iraq Israel Jordan Kuwait Lebanon Oman Palestinian Terri Qatar Saudi Arabia Syria Turkey United Arab Em Yemen SOUTH CENTRA CENTRAL ASIA Kazakhstan Kyrgyzstan Tajikistan Turkmenistan Uzbekistan SOUTH ASIA Afghanistan Bangladesh Bhutan India Iran Maldives Nepal Pakistan Sri Lanka SOUTHEAST ASI Brunei Cambodia Indonesia Laos Malaysia Myanmar Philippines Singapore Thailand Timor-Leste P O P U L A T I O N R E F E R E N C E BEritrea 6.5 33 7 2.6 2 9.8 14.3 2.2 151 42 6.7 4.7 43 Ethiopia 95.9 28 8 2.1 -0 130.5 165.1 1.7 144 50 7.0 4.1 43 Kenya 43.2 34 9 2.6 -0 60.0 81.3 1.9 98 47 8.1 4.3 42 Madagascar 22.4 34 7 2.7 -0 34.3 52.8 2.4 139 42 7.3 4.4 42 Malawi 16.8 40 12 2.9 0 26.0 41.2 2.4 175 66 7.3 5.5 45 Mauritius 1.3 11 8 0.3 -0 1.3 1.2 1.0 66 12.1 3.8 1.4 21 Mayotte 0.2 31 3 2.8 -5 0.3 0.5 2.1 53 4 7.9 4.1 45 Mozambique 25.1 43 13 2.9 0 38.4 63.5 2.5 165 85 6.6 5.7 45 Reunion 0.9 17 5 1.2 -5 1.0 1.2 1.4 53 7 4.8 2.4 24 Rwanda 11.1 31 8 2.3 -1 15.8 21.0 1.9 136 49 8.2 4.0 41 Seychelles 0.1 19 7 1.1 2 0.1 0.1 1.1 54 11.4 5.8 2.4 22 Somalia 10.8 44 12 3.2 -3 16.9 27.1 2.5 154 80 7.2 6.6 48 South Sudan 11.7 36 12 2.4 16 17.3 39.3 3.3 187 78 6.9 7.0 42 Tanzania 50.8 40 9 3.1 -1 79.4 129.4 2.5 124 49 6.8 5.3 45 Uganda 38.8 43 9 3.4 -1 63.4 104.1 2.7 113 57 7.1 5.9 48 Zambia 15.1 45 11 3.4 -1 26.1 49.2 3.3 112 66 7.4 6.0 47 Zimbabwe 14.7 33 9 2.4 6 21.5 30.2 2.1 86 37 7.4 3.8 40 MIDDLE AFRICA 142 45 15 3.0 -0 225 372 2.6 144 97 6.4 6.1 46 Angola 22.4 46 14 3.2 1 36.4 60.8 2.7 179 96 7.3 6.2 48 Cameroon 22.8 39 12 2.7 -1 34.5 54.3 2.4 127 62 6.2 5.1 43 Central African Republic 4.8 47 15 3.2 0 6.7 9.7 2.0 149 116 6.0 6.2 40 Chad 13.3 48 15 3.3 -2 21.8 37.4 2.8 153 96 6.5 6.6 49 Congo 4.6 38 10 2.8 -2 6.8 10.6 2.3 93 64 6.3 5.0 42 Congo, Dem. Rep. 71.2 46 16 3.0 -0 114.9 193.6 2.7 138 109 6.2 6.6 46 Equatorial Guinea 0.8 36 13 2.2 5 1.1 1.6 2.1 162 89 5.7 4.9 39 Gabon 1.7 32 9 2.3 1 2.4 3.3 1.9 124 43 5.1 4.1 38 Sao Tome and Principe 0.2 36 7 2.9 -2 0.3 0.4 2.2 82 44 6.5 4.3 42 SOUTHERN AFRICA 61 21 11 1.0 3 68 75 1.2 85 44 5.7 2.4 30 Botswana 2.0 24 17 0.7 2 2.3 2.8 1.4 97 32 6.6 2.6 34 Lesotho 1.9 30 21 0.9 -6 2.1 2.7 1.4 127 82 5.8 3.3 36 Namibia 2.3 30 7 2.2 -0 3.0 3.7 1.6 108 39 6.5 3.6 36 South Africa 53.7 20 11 1.0 3 58.7 64.1 1.2 80 42 5.6 2.3 29 Swaziland 1.3 30 14 1.6 -1 1.5 1.8 1.4 133 65 6.9 3.4 38 AMERICAS 972 16 7 0.9 0 1,106 1,217 1.3 68 15 4.0 2.1 24 NORTHERN AMERICA 353 12 8 0.4 3 396 444 1.3 21 5 2.3 1.8 19 Canada 35.5 11 7 0.4 8 41.5 48.4 1.4 19 4.8 2.2 1.6 16 United States 317.7 13 8 0.4 3 354.4 395.3 1.2 20 5.4 2.5 1.9 19 LATIN AMERICA AND THE CARIBBEAN 618 18 6 1.2 -1 710 773 1.3 86 18 5.3 2.2 27 CENTRAL AMERICA 165 21 6 1.5 -2 195 222 1.3 81 16 6.6 2.4 30 Belize 0.4 23 4 1.9 6 0.5 0.6 1.7 64 14 6.3 2.6 36 Costa Rica 4.8 15 4 1.1 2 5.6 6.1 1.3 61 8.7 4.9 1.8 24 El Salvador 6.4 20 7 1.4 -7 6.9 6.9 1.1 104 17 6.2 2.2 30 Guatemala 15.9 31 5 2.6 -1 22.6 31.3 2.0 109 23 6.2 3.8 40 Honduras 8.2 24 5 2.0 -1 10.2 11.7 1.4 112 24 7.3 2.8 35 Mexico 119.7 19 6 1.4 -2 137.5 150.8 1.3 75 13 6.7 2.2 28 Nicaragua 6.2 23 5 1.9 -6 7.5 8.4 1.4 105 17 6.9 2.5 33 Panama 3.9 20 5 1.5 2 4.8 5.6 1.4 53 14 5.2 2.5 28 CARIBBEAN 43 18 8 1.1 -4 47 49 1.1 77 33 4.7 2.3 26 Antigua and Barbuda 0.1 14 5 0.8 5 0.1 0.1 1.4 45 16 3.7 1.8 24 Bahamas 0.4 16 5 1.1 2 0.4 0.5 1.3 36 17 3.5 2.0 26 Barbados 0.3 12 8 0.4 1 0.3 0.3 1.1 46 10 3.1 1.8 20 Cuba 11.2 11 8 0.3 -4 10.7 9.3 0.8 45 4.6 4.0 1.7 17 Curacao 0.2 13 8 0.5 4 0.2 0.2 1.2 31 9.8 3.3 2.2 19 Dominica 0.1 13 8 0.5 -6 0.1 0.1 0.9 — 21 — 2.0 22 Dominican Republic 10.4 21 6 1.5 -3 12.0 13.2 1.3 102 25 6.2 2.5 31 Grenada 0.1 16 7 0.8 -2 0.1 0.1 0.9 49 9 4.6 2.0 27 Guadeloupe 0.4 13 7 0.6 -7 0.4 0.4 1.0 37 8.1 4.9 2.2 21 Haiti 10.8 28 9 1.9 -3 13.5 16.8 1.6 141 59 5.8 3.4 35 Jamaica 2.7 18 7 1.1 -5 2.9 2.7 1.0 48 21 5.5 2.3 27 51 42 6.7 4.7 43 2 41 63 60 65 21 8 7 56 1,180 — 0.1 44 50 7.0 4.1 43 3 43 63 62 65 17 42 40 87 1,350 0.8 1.8 98 47 8.1 4.3 42 3 52 62 60 64 24 46 39 74 2,250 1.6 3.5 39 42 7.3 4.4 42 3 45 65 63 66 33 40 33 38 1,350 0.3 0.6 75 66 7.3 5.5 45 3 41 55 55 55 16 46 42 142 760 0.2 0.4 66 12.1 3.8 1.4 21 8 63 74 70 77 42 76 39 618 17,220 0.4 1.2 53 4 7.9 4.1 45 2 62 79 76 82 50 — — 600 — — — 65 85 6.6 5.7 45 3 39 53 51 55 31 12 11 31 1,040 0.3 0.8 53 7 4.8 2.4 24 9 63 80 77 83 94 67 64 339 — 0.4 1.2 36 49 8.2 4.0 41 3 44 65 63 66 17 52 45 421 1,430 0.2 0.2 54 11.4 5.8 2.4 22 8 66 73 69 78 54 — — 198 23,270 0.0 0.2 54 80 7.2 6.6 48 3 41 55 53 57 38 15 1 17 — 0.0 0.2 87 78 6.9 7.0 42 3 36 55 54 56 17 4 1 18 2,190 — — 24 49 6.8 5.3 45 3 47 61 60 63 30 34 26 54 1,750 1.0 2.0 13 57 7.1 5.9 48 2 49 59 58 60 18 30 26 161 1,370 0.2 1.1 12 66 7.4 6.0 47 3 49 58 56 60 40 41 27 20 3,070 1.0 1.0 86 37 7.4 3.8 40 3 55 60 59 61 33 59 57 38 1,560 4.0 3.0 44 97 6.4 6.1 46 3 43 52 50 53 42 18 8 21 2,540 5 14 79 96 7.3 6.2 48 2 37 52 50 53 59 18 12 18 6,770 1.2 8.4 27 62 6.2 5.1 43 3 46 55 54 56 52 23 14 48 2,660 0.5 2.0 49 116 6.0 6.2 40 4 42 50 48 51 39 15 9 8 600 0.1 0.1 53 96 6.5 6.6 49 2 41 51 50 52 22 5 2 10 2,000 0.0 0.1 93 64 6.3 5.0 42 3 53 59 57 60 64 45 20 13 4,720 0.3 0.6 38 109 6.2 6.6 46 3 44 50 48 52 34 18 5 30 680 1.1 0.9 62 89 5.7 4.9 39 3 40 53 52 55 39 13 10 28 23,240 0.0 1.4 24 43 5.1 4.1 38 5 47 63 62 64 86 31 19 6 17,220 1.3 0.7 82 44 6.5 4.3 42 4 56 66 64 68 67 38 34 197 2,950 0.0 0.0 85 44 5.7 2.4 30 5 53 59 57 60 59 59 59 23 11,840 92 128 97 32 6.6 2.6 34 4 55 47 48 47 62 53 51 4 15,500 0.6 1.5 27 82 5.8 3.3 36 6 49 44 42 45 26 51 49 63 3,320 — 0.0 08 39 6.5 3.6 36 4 53 64 62 67 38 55 53 3 9,590 0.0 0.9 80 42 5.6 2.3 29 5 53 60 58 61 62 60 60 44 12,240 91.0 125.7 33 65 6.9 3.4 38 3 48 49 50 49 21 65 63 73 6,220 0.1 0.3 68 15 4.0 2.1 24 10 65 76 73 79 79 74 67 23 27,420 1,698 2,032 21 5 2.3 1.8 19 14 71 79 77 81 81 77 69 16 52,810 1,423 1,535 19 4.8 2.2 1.6 16 15 72 81 79 84 80 74 72 4 42,590 122.7 137.8 20 5.4 2.5 1.9 19 14 71 79 76 81 81 77 68 33 53,960 1,300.0 1,397.0 86 18 5.3 2.2 27 7 60 75 71 78 78 73 67 30 12,900 275 496 81 16 6.6 2.4 30 6 60 74 71 77 72 71 64 67 13,880 91 143 64 14 6.3 2.6 36 4 66 74 71 77 45 55 52 16 8,160 0.1 0.1 61 8.7 4.9 1.8 24 7 67 80 77 82 73 76 75 93 13,570 0.8 2.2 04 17 6.2 2.2 30 7 57 73 68 77 65 73 66 303 7,490 0.7 1.7 09 23 6.2 3.8 40 5 52 72 68 76 50 54 44 146 7,130 1.4 3.1 12 24 7.3 2.8 35 4 53 74 71 76 52 73 64 73 4,270 0.7 2.2 75 13 6.7 2.2 28 6 61 74 71 77 78 73 66 61 16,110 85.7 129.9 05 17 6.9 2.5 33 5 54 75 72 78 56 80 77 48 4,440 0.7 1.3 53 14 5.2 2.5 28 7 66 76 74 79 75 52 49 52 19,290 0.8 2.7 77 33 4.7 2.3 26 9 62 73 70 75 66 61 59 182 11,740 23 37 45 16 3.7 1.8 24 7 66 77 74 80 30 — — 201 20,070 0.1 0.1 36 17 3.5 2.0 26 6 66 75 72 77 84 — — 27 21,540 0.5 0.7 46 10 3.1 1.8 20 13 65 75 73 78 44 — — 660 15,080 0.3 0.4 45 4.6 4.0 1.7 17 13 70 78 76 80 77 74 73 101 18,520 9.1 10.9 31 9.8 3.3 2.2 19 15 69 78 74 81 — — — 348 — — — — 21 — 2.0 22 10 — 73 71 76 67 — — 94 9,800 0.0 0.0 02 25 6.2 2.5 31 6 58 73 70 76 67 72 69 213 11,150 2.6 6.0 49 9 4.6 2.0 27 7 64 70 67 73 39 54 52 324 11,120 0.0 0.1 37 8.1 4.9 2.2 21 15 65 81 77 84 98 — — 238 — 0.4 0.5 41 59 5.8 3.4 35 4 47 63 61 65 53 35 31 387 1,710 0.3 0.6 48 21 5.5 2.3 27 8 68 74 71 76 54 73 68 248 8,480 2.2 2.0 Pakistan Sri Lanka SOUTHEAST ASI Brunei Cambodia Indonesia Laos Malaysia Myanmar Philippines Singapore Thailand Timor-Leste Vietnam EAST ASIA China China, Hong Ko China, Macao S Japan Korea, North Korea, South Mongolia Taiwan EUROPE EUROPEAN UN NORTHERN EU Channel Islands Denmark Estonia Finland Iceland Ireland Latvia Lithuania Norway Sweden United Kingdom WESTERN EURO Austria Belgium France Germany Liechtenstein Luxembourg Monaco Netherlands Switzerland EASTERN EUROP Belarus Bulgaria Czech Republic Hungary Moldova Poland Romania Russiag Slovakia Ukraineg SOUTHERN EUR POPULATION, HEALTH, AND ENVIRONMENT DATA AND ESTIMATES FOR THE COUNTRIES AND REGIONS OF THE WORLD
  • 15. © 2014 Population Reference Bureau See notes on page 18 2014 WORLD POPULATION DATA SHEET 15 ENVIRONMENT DATA AND ESTIMATES FOR THE COUNTRIES AND REGIONS OF THE WORLD Infant Mortality Ratea Total Fertility Rateb Percent of Population Life Expectancy at Birth (years) Percent Urban Percent of Married Women 15-49 Using Contraceptionc Population per Square Kilometer GNI PPP per Capita ($US) 2013d Carbon Emissions (million tons) 1990 2012970 2013* 1970 2013* Ages 15 Ages 65+ Both Sexes 1970 Both Sexes 2013* Males 2013* Females 2013* All Methods Modern Methods 89 38 4.7 2.5 26 8 58 71 69 73 53 63 56 53 14,210 6,127 9,667 24 5 2.3 1.6 16 17 71 79 75 82 77 70 60 23 37,470 3,883 3,606 00 42 5.7 2.6 29 6 55 69 67 71 48 61 55 72 8,920 2,029 5,510 19 46 5.8 3.0 32 5 51 67 65 69 46 54 46 63 8,060 1,358 2,884 50 64 5.7 4.3 40 4 44 61 60 62 28 36 30 44 1,970 20 62 39 62 6.7 4.7 41 4 45 59 58 60 40 34 28 37 4,470 188 331 38 67 6.7 5.1 43 3 44 57 56 58 37 29 23 41 3,220 125 193 40 33 6.5 3.4 32 5 52 69 68 71 51 53 47 28 9,600 64 139 28 26 7.6 2.9 28 6 50 71 69 73 73 61 52 16 12,990 21.5 37.7 69 29 5.9 3.5 32 6 52 71 69 72 43 60 58 88 10,850 20.7 58.7 04 14 7.9 2.4 29 5 56 75 73 77 78 42 20 4 28,110 10.0 16.7 18 29 6.7 2.6 28 5 53 71 69 73 59 67 57 75 7,000 6.4 14.3 97 55 6.9 5.2 41 3 52 62 60 64 33 9 — 21 2,370 1.5 3.9 58 16 6.4 2.2 24 7 51 75 73 77 66 63 50 67 10,960 3.6 7.5 68 37 6.6 2.4 27 3 42 68 66 70 82 — — 2 — 0.0 0.0 52 66 6.7 5.4 44 3 41 55 54 55 45 17 11 55 3,930 18 33 55 69 6.8 4.9 43 3 42 59 58 61 45 13 7 91 1,780 0.2 1.5 63 70 6.6 5.9 46 2 39 56 56 57 27 16 15 65 1,560 0.2 0.5 09 24 6.9 2.6 30 5 52 75 71 79 62 61 57 126 6,220 0.0 0.1 56 75 7.9 4.9 41 3 44 51 50 51 53 18 12 65 2,900 1.6 1.7 20 55 6.1 5.6 46 2 38 59 57 60 57 9 8 169 1,620 0.1 0.1 10 53 7.0 4.3 38 5 49 61 60 62 51 35 23 113 3,880 1.1 2.5 90 67 6.2 5.1 42 3 37 56 55 57 36 6 3 47 1,160 0.3 0.3 44 94 6.1 5.0 41 3 44 54 53 56 44 14 10 48 1,240 0.1 0.1 86 54 6.7 4.7 43 3 39 60 59 61 47 20 19 39 790 0.1 0.2 84 58 6.9 6.1 48 3 32 55 55 54 35 10 10 13 1,540 0.1 0.2 10 72 6.8 4.1 40 3 49 62 60 63 41 9 8 4 2,850 0.7 0.6 54 54 7.4 7.6 50 3 36 58 58 58 22 14 8 14 910 0.2 0.4 53 69 6.5 5.6 44 3 41 52 52 53 50 15 9 192 5,600 12.4 22.2 11 43 7.3 5.3 44 3 39 63 62 65 47 18 16 71 2,240 0.9 2.0 97 92 6.7 4.9 42 3 35 45 45 46 41 17 15 88 1,750 0.1 0.2 20 66 7.1 4.7 42 3 47 56 56 57 38 15 13 123 1,180 0.2 0.4 34 57 7.1 4.9 44 3 45 60 59 62 24 39 31 54 1,570 11 17 39 87 7.3 6.1 45 2 44 54 52 56 10 22 18 377 820 0.1 0.1 34 36 7.1 4.3 42 3 48 61 59 61 28 19 13 335 1,560 0.0 0.0 12 55 6.8 3.4 34 4 49 62 60 63 77 19 18 38 — 0.1 0.2 51 42 6.7 4.7 43 2 41 63 60 65 21 8 7 56 1,180 — 0.1 44 50 7.0 4.1 43 3 43 63 62 65 17 42 40 87 1,350 0.8 1.8 98 47 8.1 4.3 42 3 52 62 60 64 24 46 39 74 2,250 1.6 3.5 39 42 7.3 4.4 42 3 45 65 63 66 33 40 33 38 1,350 0.3 0.6 75 66 7.3 5.5 45 3 41 55 55 55 16 46 42 142 760 0.2 0.4 66 12.1 3.8 1.4 21 8 63 74 70 77 42 76 39 618 17,220 0.4 1.2 53 4 7.9 4.1 45 2 62 79 76 82 50 — — 600 — — — 65 85 6.6 5.7 45 3 39 53 51 55 31 12 11 31 1,040 0.3 0.8 53 7 4.8 2.4 24 9 63 80 77 83 94 67 64 339 — 0.4 1.2 36 49 8.2 4.0 41 3 44 65 63 66 17 52 45 421 1,430 0.2 0.2 54 11.4 5.8 2.4 22 8 66 73 69 78 54 — — 198 23,270 0.0 0.2 54 80 7.2 6.6 48 3 41 55 53 57 38 15 1 17 — 0.0 0.2 87 78 6.9 7.0 42 3 36 55 54 56 17 4 1 18 2,190 — — ASIA ASIA (Excl. China WESTERN ASIA Armenia Azerbaijan Bahrain Cyprus Georgia Iraq Israel Jordan Kuwait Lebanon Oman Palestinian Terri Qatar Saudi Arabia Syria Turkey United Arab Em Yemen SOUTH CENTRA CENTRAL ASIA Kazakhstan Kyrgyzstan Tajikistan Turkmenistan Uzbekistan SOUTH ASIA Afghanistan Bangladesh Bhutan India Iran Maldives Nepal Pakistan Sri Lanka SOUTHEAST ASI Brunei Cambodia Indonesia Laos Malaysia Myanmar Philippines Singapore Thailand Timor-Leste P O P U L A T I O N R E F E R E N C E BPanama 3.9 20 5 1.5 2 4.8 5.6 1.4 53 14 5.2 2.5 28 CARIBBEAN 43 18 8 1.1 -4 47 49 1.1 77 33 4.7 2.3 26 Antigua and Barbuda 0.1 14 5 0.8 5 0.1 0.1 1.4 45 16 3.7 1.8 24 Bahamas 0.4 16 5 1.1 2 0.4 0.5 1.3 36 17 3.5 2.0 26 Barbados 0.3 12 8 0.4 1 0.3 0.3 1.1 46 10 3.1 1.8 20 Cuba 11.2 11 8 0.3 -4 10.7 9.3 0.8 45 4.6 4.0 1.7 17 Curacao 0.2 13 8 0.5 4 0.2 0.2 1.2 31 9.8 3.3 2.2 19 Dominica 0.1 13 8 0.5 -6 0.1 0.1 0.9 — 21 — 2.0 22 Dominican Republic 10.4 21 6 1.5 -3 12.0 13.2 1.3 102 25 6.2 2.5 31 Grenada 0.1 16 7 0.8 -2 0.1 0.1 0.9 49 9 4.6 2.0 27 Guadeloupe 0.4 13 7 0.6 -7 0.4 0.4 1.0 37 8.1 4.9 2.2 21 Haiti 10.8 28 9 1.9 -3 13.5 16.8 1.6 141 59 5.8 3.4 35 Jamaica 2.7 18 7 1.1 -5 2.9 2.7 1.0 48 21 5.5 2.3 27 Martinique 0.4 12 7 0.4 -10 0.4 0.4 1.1 40 8 4.6 1.9 19 Puerto Rico 3.6 11 8 0.3 -13 3.4 3.0 0.8 29 8.1 3.2 1.6 19 St. Kitts-Nevis 0.1 13 7 0.6 7 0.1 0.1 1.2 — 17 — 1.6 22 St. Lucia 0.2 13 8 0.6 0 0.2 0.2 1.0 50 20 6.1 1.5 23 St. Vincent and the Grenadines 0.1 17 8 0.9 -9 0.1 0.1 1.0 64 20 6.0 2.2 25 Trinidad and Tobago 1.3 13 10 0.3 -3 1.2 1.0 0.7 46 24 3.6 1.6 20 SOUTH AMERICA 410 17 6 1.1 -0 467 503 1.2 89 18 4.9 2.1 26 Argentina 42.7 19 7 1.1 -0 50.2 59.4 1.4 53 11.7 3.1 2.3 25 Bolivia 10.3 26 7 1.9 0 13.0 15.8 1.5 156 39 6.6 3.2 35 Brazil 202.8 15 6 0.9 0 223.1 226.3 1.1 96 20 5.0 1.8 24 Chile 17.7 14 6 0.9 0 19.6 20.2 1.1 79 7.7 4.0 1.9 22 Colombia 47.7 19 6 1.3 -2 55.7 61.3 1.3 78 18 5.6 2.3 28 Ecuador 16.0 23 5 1.8 -0 19.8 23.4 1.5 101 17 6.1 2.8 31 French Guiana 0.3 27 3 2.4 2 0.4 0.6 2.4 47 10 4.7 3.5 34 Guyana 0.7 20 7 1.3 -15 0.8 0.8 1.0 60 29 5.1 2.5 36 Paraguay 6.9 23 6 1.7 -1 8.6 10.1 1.5 56 29 5.7 2.8 33 Peru 30.8 20 5 1.5 -3 35.9 40.1 1.3 118 16 6.3 2.4 29 Suriname 0.6 20 7 1.3 -2 0.7 0.7 1.3 46 20 5.7 2.6 28 Uruguay 3.4 14 9 0.5 -2 3.6 3.6 1.1 47 9.3 2.9 2.0 22 Venezuela 30.2 20 5 1.5 0 36.1 40.5 1.3 54 14.4 5.4 2.4 29 Population (millions) Birth Rate Death Rate Natural Increase (%) Migration Rate mid-2030 mid-2050 Population Change 1970 2013* 1970 2013* 15 Population (millions) Infant Mortality Total Fertility Rate % of Population NOTES (—) Indicates data unavailable or inapplicable. * Denotes 2013 or most recent year for which data are available. a Infant deaths per 1,000 live births. Rates shown with decimals indicate national statistics reported as completely registered, while those without are estimates from the sources cited on the reverse. Rates shown in italics are based upon fewer than 50 annual infant deaths and, as a result, are subject to considerable yearly variability. b Average number of children born t c Data prior to 2008 are shown in ita d Data prior to 2013 are shown in ita e The status of Western Sahara is dis f Special Administrative Region. g Does not include the population o 1875 Connecticut Ave., NW, Washington, DC 20009 USA tel. 202-483-1100 | fax 202-328-3937 e-mail: popref@prb.org | website: www.prb.org 53 14 5.2 2.5 28 7 66 76 74 79 75 52 49 52 19,290 0.8 2.7 77 33 4.7 2.3 26 9 62 73 70 75 66 61 59 182 11,740 23 37 45 16 3.7 1.8 24 7 66 77 74 80 30 — — 201 20,070 0.1 0.1 36 17 3.5 2.0 26 6 66 75 72 77 84 — — 27 21,540 0.5 0.7 46 10 3.1 1.8 20 13 65 75 73 78 44 — — 660 15,080 0.3 0.4 45 4.6 4.0 1.7 17 13 70 78 76 80 77 74 73 101 18,520 9.1 10.9 31 9.8 3.3 2.2 19 15 69 78 74 81 — — — 348 — — — — 21 — 2.0 22 10 — 73 71 76 67 — — 94 9,800 0.0 0.0 02 25 6.2 2.5 31 6 58 73 70 76 67 72 69 213 11,150 2.6 6.0 49 9 4.6 2.0 27 7 64 70 67 73 39 54 52 324 11,120 0.0 0.1 37 8.1 4.9 2.2 21 15 65 81 77 84 98 — — 238 — 0.4 0.5 41 59 5.8 3.4 35 4 47 63 61 65 53 35 31 387 1,710 0.3 0.6 48 21 5.5 2.3 27 8 68 74 71 76 54 73 68 248 8,480 2.2 2.0 40 8 4.6 1.9 19 17 66 82 79 85 89 — — 348 — 0.6 0.6 29 8.1 3.2 1.6 19 16 72 79 75 83 99 84 72 403 22,730 — — — 17 — 1.6 22 8 — 75 73 78 32 — — 210 20,400 0.0 0.1 50 20 6.1 1.5 23 9 63 75 72 77 18 — — 321 10,350 0.1 0.1 64 20 6.0 2.2 25 7 65 71 70 74 49 — — 273 10,610 0.0 0.1 46 24 3.6 1.6 20 9 65 70 66 74 14 43 38 262 26,210 4.6 12.8 89 18 4.9 2.1 26 8 60 75 72 78 82 75 68 23 12,620 161 316 53 11.7 3.1 2.3 25 10 66 77 73 80 92 55 53 15 — 30.7 53.6 56 39 6.6 3.2 35 5 46 67 65 69 67 61 34 9 5,750 1.5 5.0 96 20 5.0 1.8 24 7 59 75 71 79 85 80 77 24 14,750 57.0 122.1 79 7.7 4.0 1.9 22 10 62 79 76 82 87 64 — 23 21,030 9.3 24.8 78 18 5.6 2.3 28 7 61 75 72 79 76 79 73 42 11,890 15.6 22.0 01 17 6.1 2.8 31 7 58 75 72 78 63 73 59 57 10,310 4.6 9.5 47 10 4.7 3.5 34 5 65 79 76 83 76 — — 3 — 0.2 0.2 60 29 5.1 2.5 36 3 59 66 64 69 28 43 40 3 6,550 0.3 0.5 56 29 5.7 2.8 33 5 65 73 71 75 59 79 70 17 7,640 0.6 1.4 18 16 6.3 2.4 29 6 53 75 72 77 75 74 51 24 11,360 5.8 17.8 46 20 5.7 2.6 28 6 63 71 69 74 70 48 47 3 15,860 0.5 0.7 47 9.3 2.9 2.0 22 14 69 77 74 81 94 77 75 20 18,930 1.0 2.0 54 14.4 5.4 2.4 29 6 65 75 72 78 89 70 62 33 17,890 33.0 57.0 Switzerland EASTERN EUROP Belarus Bulgaria Czech Republic Hungary Moldova Poland Romania Russiag Slovakia Ukraineg SOUTHERN EUR Albania Andorra Bosnia-Herzego Croatia Greece Italy Kosovoh Macedoniai Malta Montenegro Portugal San Marino Serbia Slovenia Spain OCEANIA Australia Federated State Fiji French Polynesi Guam Kiribati Marshall Islands Nauru New Caledonia New Zealand Palau Papua New Gui Samoa Solomon Island Tonga Tuvalu Vanuatu 970 2013* 1970 2013* 15 65+ Both, 1970 Both, 2013* Males, 2013* Females, 2013* Percent Urban All Methods Modern Methods Population Density GNI PPP per Capita ($US) 2013 1990 2012 Infant Mortality Total Fertility Rate % of Population Life Expectancy % Using Contraception Carbon Emissions (million tons) cate national statistics tes from the sources than 50 annual infant ty. b Average number of children born to a woman during her lifetime. c Data prior to 2008 are shown in italics. d Data prior to 2013 are shown in italics. e The status of Western Sahara is disputed by Morocco. f Special Administrative Region. g Does not include the population of Crimea, estimated at 2.3 million. h Kosovo declared independence from Serbia on Feb. 17, 2008. Serbia has not recognized Kosovo’s independence. i The former Yugoslav Republic. For additional notes and sources, see reverse side. Data prepared by PRB demographers Carl Haub and Toshiko Kaneda. © August 2014. Population Reference Bureau. All rights reserved. ENVIRONMENT DATA AND ESTIMATES FOR THE COUNTRIES AND REGIONS OF THE WORLD Infant Mortality Ratea Total Fertility Rateb Percent of Population Life Expectancy at Birth (years) Percent Urban Percent of Married Women 15-49 Using Contraceptionc Population per Square Kilometer GNI PPP per Capita ($US) 2013d Carbon Emissions (million tons) 1990 2012970 2013* 1970 2013* Ages 15 Ages 65+ Both Sexes 1970 Both Sexes 2013* Males 2013* Females 2013* All Methods Modern Methods 91 34 5.4 2.2 25 7 57 71 69 73 46 66 60 136 10,380 1,863 5,023 14 40 5.9 2.5 29 6 53 69 67 71 43 57 48 134 9,700 1,192 2,397 22 25 5.8 2.9 30 5 56 73 71 76 70 54 37 53 22,920 202 453 66 10 3.2 1.6 19 11 70 74 71 78 63 55 26 101 8,140 1.2 1.2 03 11 4.6 2.2 22 6 65 74 71 77 53 51 13 110 16,180 17.3 13.9 58 8 6.5 2.1 21 2 63 76 75 78 100 62 31 1,901 36,140 3.2 6.7 26 6 2.5 1.5 17 12 73 79 77 81 67 — — 125 29,570 1.3 2.1 55 11 2.6 1.7 17 14 67 75 70 79 54 53 35 69 7,040 4.6 1.8 80 29 7.4 4.1 40 3 58 69 66 73 71 53 33 80 15,220 14.3 33.3 23 3.0 3.8 3.0 28 10 72 82 80 84 91 — — 371 32,140 9.2 20.9 71 17 7.9 3.5 34 4 60 73 72 74 83 61 41 85 11,660 2.8 6.1 47 8 7.2 2.4 23 2 66 74 73 75 98 52 39 205 88,170 13.2 26.4 44 9 5.0 1.5 20 9 66 80 78 82 87 58 34 478 17,390 2.5 5.8 20 9 7.3 2.8 22 3 50 76 75 78 75 32 25 13 52,170 3.1 16.1 99 20 7.9 4.1 40 3 56 73 71 74 83 53 41 731 4,900 — 0.7 43 7 6.9 2.1 14 1 68 78 78 79 100 38 — 206 123,860 3.2 24.7 22 16 7.3 2.9 30 3 53 74 73 75 81 24 — 14 53,780 59.4 137.9 81 17 7.6 3.0 35 4 59 74 72 78 54 54 38 119 — 10.2 17.9 45 10 5.7 2.1 25 8 52 75 71 78 77 73 46 99 18,760 39.8 84.9 67 6 6.6 1.8 16 0 62 77 76 78 83 28 24 113 58,090 14.2 46.7 96 68 7.5 4.4 42 3 41 63 62 64 29 34 29 49 3,820 2.0 6.0 33 47 5.7 2.5 31 5 49 67 65 68 33 54 46 174 5,600 397 973 95 41 5.1 2.7 29 5 62 68 65 72 47 53 49 17 9,300 126 127 81 28 3.5 2.7 25 7 63 70 65 74 55 51 50 6 20,570 78.5 79.6 05 27 4.9 3.2 31 4 61 70 66 74 34 36 34 29 3,070 3.3 1.8 29 57 6.9 3.8 36 3 60 67 64 71 26 28 26 58 2,500 2.2 0.8 $ 53,960Gross national income per capita in the United States. 2.4BILLION By 2050, Africa’s population is estimated to increase to 2.4 billion, from 1.1 billion in 2014. 40%Percentage of Iraq’s population under age 15. 9.7Billion tons of carbon emissions worldwide in 2012. Up from 6.1 billion tons in 1990. et POPULATION, HEALTH, AND ENVIRONMENT DATA AND ESTIMATES bon Emissions million tons) 90 2012 27 9,667 83 3,606 29 5,510 58 2,884 20 62 88 331 25 193 64 139 21.5 37.7 20.7 58.7 10.0 16.7 6.4 14.3 1.5 3.9 3.6 7.5 0.0 0.0 18 33 0.2 1.5 0.2 0.5 0.0 0.1 1.6 1.7 0.1 0.1 1.1 2.5 0.3 0.3 0.1 0.1 0.1 0.2 0.1 0.2 Population mid-2014 (millions) Births per 1,000 Population Deaths per 1,000 Population Rate of Natural Increase (%) Net Migration Rate per 1,000 Population Projected Population (millions) 2050 Population as a Multiple of 2014 Infant Mortality Ratea Total Fertility Rateb Percent of Popu mid-2030 mid-2050 1970 2013* 1970 2013* Ages 15 Ag ASIA 4,351 18 7 1.1 -0 4,907 5,252 1.2 91 34 5.4 2.2 25 ASIA (Excl. China) 2,987 21 7 1.4 -0 3,507 3,941 1.3 114 40 5.9 2.5 29 WESTERN ASIA 255 22 5 1.7 2 322 387 1.5 122 25 5.8 2.9 30 Armenia 3.0 14 9 0.5 -8 3.0 2.8 0.9 66 10 3.2 1.6 19 Azerbaijan 9.5 18 6 1.3 0 11.1 12.1 1.3 103 11 4.6 2.2 22 Bahrain 1.3 15 2 1.3 20 1.6 1.8 1.4 58 8 6.5 2.1 21 Cyprus 1.2 13 7 0.6 -2 1.3 1.4 1.2 26 6 2.5 1.5 17 Georgia 4.8 13 11 0.2 -1 4.8 4.6 1.0 55 11 2.6 1.7 17 Iraq 35.1 31 5 2.6 1 53.8 80.5 2.3 80 29 7.4 4.1 40 Israel 8.2 21 5 1.6 3 10.5 13.9 1.7 23 3.0 3.8 3.0 28 Jordan 7.6 28 4 2.4 -8 9.9 13.1 1.7 71 17 7.9 3.5 34 Kuwait 3.7 18 2 1.7 35 5.1 6.6 1.8 47 8 7.2 2.4 23 Lebanon 5.0 13 4 0.9 20 5.2 5.3 1.1 44 9 5.0 1.5 20 Oman 4.1 20 2 1.8 39 5.4 6.3 1.6 120 9 7.3 2.8 22 Palestinian Territory 4.4 31 4 2.7 -1 6.6 9.1 2.1 99 20 7.9 4.1 40 Qatar 2.3 11 1 1.0 2 2.8 3.0 1.3 43 7 6.9 2.1 14 Saudi Arabia 30.8 22 4 1.8 2 37.4 42.4 1.4 122 16 7.3 2.9 30 Syria 22.0 24 4 2.1 -11 29.9 36.7 1.7 81 17 7.6 3.0 35 Turkey 77.2 16 5 1.1 0 88.3 93.3 1.2 145 10 5.7 2.1 25 United Arab Emirates 9.4 15 1 1.4 22 12.3 15.5 1.6 67 6 6.6 1.8 16 Yemen 26.0 36 8 2.8 -1 33.6 38.8 1.5 196 68 7.5 4.4 42 SOUTH CENTRAL ASIA 1,874 22 7 1.6 -1 2,220 2,516 1.3 133 47 5.7 2.5 31 CENTRAL ASIA 67 24 6 1.8 -1 81 93 1.4 95 41 5.1 2.7 29 Kazakhstan 17.3 23 8 1.5 -0 20.3 24.5 1.4 81 28 3.5 2.7 25 Kyrgyzstan 5.8 28 7 2.1 -1 7.5 9.4 1.6 105 27 4.9 3.2 31 Tajikistan 8.3 34 7 2.7 -5 11.2 14.8 1.8 129 57 6.9 3.8 36 OPULATION Data Sheet E N C E B U R E A U POPULATION, HEALTH, AND ENVIRONMENT DATA AND ESTIMATES FOR THE COUNTRIES AND REGIONS OF THE WORLD
  • 16. © 2014 Population Reference Bureau See notes on page 18 2014 WORLD POPULATION DATA SHEET 16 ENVIRONMENT DATA AND ESTIMATES FOR THE COUNTRIES AND REGIONS OF THE WORLD Infant Mortality Ratea Total Fertility Rateb Percent of Population Life Expectancy at Birth (years) Percent Urban Percent of Married Women 15-49 Using Contraceptionc Population per Square Kilometer GNI PPP per Capita ($US) 2013d Carbon Emissions (million tons) 1990 2012970 2013* 1970 2013* Ages 15 Ages 65+ Both Sexes 1970 Both Sexes 2013* Males 2013* Females 2013* All Methods Modern Methods 89 38 4.7 2.5 26 8 58 71 69 73 53 63 56 53 14,210 6,127 9,667 24 5 2.3 1.6 16 17 71 79 75 82 77 70 60 23 37,470 3,883 3,606 00 42 5.7 2.6 29 6 55 69 67 71 48 61 55 72 8,920 2,029 5,510 19 46 5.8 3.0 32 5 51 67 65 69 46 54 46 63 8,060 1,358 2,884 50 64 5.7 4.3 40 4 44 61 60 62 28 36 30 44 1,970 20 62 39 62 6.7 4.7 41 4 45 59 58 60 40 34 28 37 4,470 188 331 38 67 6.7 5.1 43 3 44 57 56 58 37 29 23 41 3,220 125 193 40 33 6.5 3.4 32 5 52 69 68 71 51 53 47 28 9,600 64 139 28 26 7.6 2.9 28 6 50 71 69 73 73 61 52 16 12,990 21.5 37.7 69 29 5.9 3.5 32 6 52 71 69 72 43 60 58 88 10,850 20.7 58.7 04 14 7.9 2.4 29 5 56 75 73 77 78 42 20 4 28,110 10.0 16.7 18 29 6.7 2.6 28 5 53 71 69 73 59 67 57 75 7,000 6.4 14.3 97 55 6.9 5.2 41 3 52 62 60 64 33 9 — 21 2,370 1.5 3.9 58 16 6.4 2.2 24 7 51 75 73 77 66 63 50 67 10,960 3.6 7.5 68 37 6.6 2.4 27 3 42 68 66 70 82 — — 2 — 0.0 0.0 52 66 6.7 5.4 44 3 41 55 54 55 45 17 11 55 3,930 18 33 55 69 6.8 4.9 43 3 42 59 58 61 45 13 7 91 1,780 0.2 1.5 63 70 6.6 5.9 46 2 39 56 56 57 27 16 15 65 1,560 0.2 0.5 09 24 6.9 2.6 30 5 52 75 71 79 62 61 57 126 6,220 0.0 0.1 56 75 7.9 4.9 41 3 44 51 50 51 53 18 12 65 2,900 1.6 1.7 20 55 6.1 5.6 46 2 38 59 57 60 57 9 8 169 1,620 0.1 0.1 10 53 7.0 4.3 38 5 49 61 60 62 51 35 23 113 3,880 1.1 2.5 90 67 6.2 5.1 42 3 37 56 55 57 36 6 3 47 1,160 0.3 0.3 44 94 6.1 5.0 41 3 44 54 53 56 44 14 10 48 1,240 0.1 0.1 86 54 6.7 4.7 43 3 39 60 59 61 47 20 19 39 790 0.1 0.2 84 58 6.9 6.1 48 3 32 55 55 54 35 10 10 13 1,540 0.1 0.2 10 72 6.8 4.1 40 3 49 62 60 63 41 9 8 4 2,850 0.7 0.6 54 54 7.4 7.6 50 3 36 58 58 58 22 14 8 14 910 0.2 0.4 53 69 6.5 5.6 44 3 41 52 52 53 50 15 9 192 5,600 12.4 22.2 11 43 7.3 5.3 44 3 39 63 62 65 47 18 16 71 2,240 0.9 2.0 97 92 6.7 4.9 42 3 35 45 45 46 41 17 15 88 1,750 0.1 0.2 20 66 7.1 4.7 42 3 47 56 56 57 38 15 13 123 1,180 0.2 0.4 34 57 7.1 4.9 44 3 45 60 59 62 24 39 31 54 1,570 11 17 39 87 7.3 6.1 45 2 44 54 52 56 10 22 18 377 820 0.1 0.1 34 36 7.1 4.3 42 3 48 61 59 61 28 19 13 335 1,560 0.0 0.0 12 55 6.8 3.4 34 4 49 62 60 63 77 19 18 38 — 0.1 0.2 51 42 6.7 4.7 43 2 41 63 60 65 21 8 7 56 1,180 — 0.1 44 50 7.0 4.1 43 3 43 63 62 65 17 42 40 87 1,350 0.8 1.8 98 47 8.1 4.3 42 3 52 62 60 64 24 46 39 74 2,250 1.6 3.5 39 42 7.3 4.4 42 3 45 65 63 66 33 40 33 38 1,350 0.3 0.6 75 66 7.3 5.5 45 3 41 55 55 55 16 46 42 142 760 0.2 0.4 66 12.1 3.8 1.4 21 8 63 74 70 77 42 76 39 618 17,220 0.4 1.2 53 4 7.9 4.1 45 2 62 79 76 82 50 — — 600 — — — 65 85 6.6 5.7 45 3 39 53 51 55 31 12 11 31 1,040 0.3 0.8 53 7 4.8 2.4 24 9 63 80 77 83 94 67 64 339 — 0.4 1.2 36 49 8.2 4.0 41 3 44 65 63 66 17 52 45 421 1,430 0.2 0.2 54 11.4 5.8 2.4 22 8 66 73 69 78 54 — — 198 23,270 0.0 0.2 54 80 7.2 6.6 48 3 41 55 53 57 38 15 1 17 — 0.0 0.2 87 78 6.9 7.0 42 3 36 55 54 56 17 4 1 18 2,190 — — ASIA ASIA (Excl. China WESTERN ASIA Armenia Azerbaijan Bahrain Cyprus Georgia Iraq Israel Jordan Kuwait Lebanon Oman Palestinian Terri Qatar Saudi Arabia Syria Turkey United Arab Em Yemen SOUTH CENTRA CENTRAL ASIA Kazakhstan Kyrgyzstan Tajikistan Turkmenistan Uzbekistan SOUTH ASIA Afghanistan Bangladesh Bhutan India Iran Maldives Nepal Pakistan Sri Lanka SOUTHEAST ASI Brunei Cambodia Indonesia Laos Malaysia Myanmar Philippines Singapore Thailand Timor-Leste P O P U L A T I O N R E F E R E N C E B47 8 7.2 2.4 23 2 66 74 73 75 98 52 39 205 88,170 13.2 26.4 44 9 5.0 1.5 20 9 66 80 78 82 87 58 34 478 17,390 2.5 5.8 20 9 7.3 2.8 22 3 50 76 75 78 75 32 25 13 52,170 3.1 16.1 99 20 7.9 4.1 40 3 56 73 71 74 83 53 41 731 4,900 — 0.7 43 7 6.9 2.1 14 1 68 78 78 79 100 38 — 206 123,860 3.2 24.7 22 16 7.3 2.9 30 3 53 74 73 75 81 24 — 14 53,780 59.4 137.9 81 17 7.6 3.0 35 4 59 74 72 78 54 54 38 119 — 10.2 17.9 45 10 5.7 2.1 25 8 52 75 71 78 77 73 46 99 18,760 39.8 84.9 67 6 6.6 1.8 16 0 62 77 76 78 83 28 24 113 58,090 14.2 46.7 96 68 7.5 4.4 42 3 41 63 62 64 29 34 29 49 3,820 2.0 6.0 33 47 5.7 2.5 31 5 49 67 65 68 33 54 46 174 5,600 397 973 95 41 5.1 2.7 29 5 62 68 65 72 47 53 49 17 9,300 126 127 81 28 3.5 2.7 25 7 63 70 65 74 55 51 50 6 20,570 78.5 79.6 05 27 4.9 3.2 31 4 61 70 66 74 34 36 34 29 3,070 3.3 1.8 29 57 6.9 3.8 36 3 60 67 64 71 26 28 26 58 2,500 2.2 0.8 16 47 6.3 2.4 28 4 58 65 61 70 47 48 46 11 12,920 8.4 15.1 89 44 6.5 2.4 28 4 63 68 65 72 51 65 59 69 5,340 34.0 30.0 34 47 5.8 2.5 31 5 49 67 65 68 32 54 46 266 5,460 271 845 08 74 7.7 5.1 46 2 37 61 59 62 24 21 20 48 2,000 0.7 2.4 65 33 7.0 2.2 29 5 48 70 70 71 26 61 52 1,101 2,810 4.2 17.7 74 47 6.7 2.5 30 5 37 68 67 68 36 66 65 16 7,210 0.0 0.1 29 44 5.5 2.4 31 5 49 66 65 68 31 55 48 394 5,350 188.3 611.2 39 16 6.4 1.8 24 5 51 74 72 76 71 82 60 47 15,600 57.6 164.5 61 9 7.2 2.3 26 5 44 74 73 75 41 35 27 1,241 9,890 0.0 0.3 66 46 6.0 2.4 34 5 42 68 67 69 17 50 43 184 2,260 0.2 1.1 23 74 6.6 3.8 38 4 53 65 63 66 35 35 25 244 4,920 18.7 44.1 49 9 4.3 2.1 26 8 64 74 71 77 15 68 53 315 9,470 1.0 3.8 89 28 5.7 2.4 27 6 55 71 68 73 48 62 55 138 9,130 116 356 34 4 5.8 1.6 25 5 67 78 77 80 76 — — 73 68,090 1.8 2.7 23 45 6.5 2.8 31 6 42 63 61 66 20 51 35 82 2,890 0.1 1.2 09 32 5.5 2.6 29 5 52 71 69 73 50 62 58 132 9,260 40.8 130.0 43 68 6.0 3.2 35 4 46 68 66 69 34 50 42 29 4,570 0.1 0.5 42 7 4.9 2.1 26 6 64 75 73 77 71 49 32 91 22,460 15.4 59.0 16 49 6.0 2.0 25 5 51 65 63 67 31 46 46 79 — 1.2 2.7 63 23 6.3 3.0 34 4 61 69 65 72 63 55 37 334 7,820 11.4 23.6 22 2.0 3.2 1.2 16 11 68 83 80 85 100 62 55 8,034 76,850 12.8 3.6 69 11 5.6 1.8 18 10 60 75 71 78 47 79 77 129 13,510 26.1 88.1 86 63 5.9 5.7 42 5 40 62 61 62 30 22 21 81 6,410 — 0.1 55 15 6.5 2.1 24 7 60 73 70 76 32 76 67 273 5,030 6.0 45.0 49 14 4.9 1.5 16 11 64 76 75 78 58 82 81 136 14,440 1,149 3,241 51 15 5.5 1.6 16 10 63 75 74 77 54 85 84 143 11,850 671.1 2,625.7 21 1.6 3.3 1.1 11 15 72 84 81 87 100 80 75 6,589 54,260 7.5 10.5 31 3 2.2 1.2 11 8 69 82 79 86 100 — — 23,872 112,180 0.3 0.3 14 1.9 2.1 1.4 13 26 72 83 80 86 91 54 44 336 37,630 298.6 342.3 51 26 4.3 2.0 22 9 60 69 65 73 60 71 65 206 — 66.8 20.5 50 2.9 4.5 1.2 15 12 61 81 78 85 81 80 70 507 33,440 67.3 166.7 12 26 7.6 2.9 28 4 55 67 64 72 68 55 50 2 8,810 2.7 3.3 27 3.7 3.9 1.1 14 12 68 80 76 83 73 71 — 650 — 34.3 71.6 27 6 2.3 1.6 16 17 70 78 74 81 72 70 57 32 30,010 2,077 1,619 25 4 2.4 1.5 16 18 71 80 77 83 72 72 61 116 34,220 1,161 967 17 3 2.3 1.8 18 17 72 80 78 83 79 80 78 56 37,860 233 201 24 2.9 2.1 1.7 15 16 72 82 79 84 31 — — 835 — — — 14 3.0 2.0 1.7 17 18 73 80 78 82 87 77 — 131 44,440 13.6 10.0 22 2.1 2.2 1.5 16 18 70 76 71 81 68 63 58 29 24,230 6.9 5.3 13 1.8 1.8 1.8 16 19 70 81 78 84 85 77 75 16 38,480 14.1 13.1 13 1.8 2.8 1.9 21 13 74 82 81 84 95 — — 3 38,870 0.5 0.5 20 3.3 3.9 2.0 22 12 71 81 78 83 60 65 61 66 35,090 8.6 9.9 20 3.6 2.0 1.5 14 19 70 74 69 79 68 68 56 31 21,390 4.1 2.1 23 3.6 2.4 1.6 15 18 71 74 68 79 67 63 50 45 23,080 6.7 3.7 6.4 14.3 1.5 3.9 3.6 7.5 0.0 0.0 18 33 0.2 1.5 0.2 0.5 0.0 0.1 1.6 1.7 0.1 0.1 1.1 2.5 0.3 0.3 0.1 0.1 0.1 0.2 0.1 0.2 0.7 0.6 0.2 0.4 12.4 22.2 0.9 2.0 0.1 0.2 0.2 0.4 11 17 0.1 0.1 0.0 0.0 0.1 0.2 — 0.1 0.8 1.8 1.6 3.5 0.3 0.6 0.2 0.4 0.4 1.2 — — 0.3 0.8 0.4 1.2 0.2 0.2 0.0 0.2 0.0 0.2 — — 1.0 2.0 0.2 1.1 1.0 1.0 4.0 3.0 5 14 1.2 8.4 0.5 2.0 0.1 0.1 0.0 0.1 0.3 0.6 1.1 0.9 0.0 1.4 1.3 0.7 0.0 0.0 92 128 0.6 1.5 — 0.0 0.0 0.9 91.0 125.7 0.1 0.3 98 2,032 Kuwait 3.7 18 2 1.7 35 5.1 6.6 1.8 47 8 7.2 2.4 23 Lebanon 5.0 13 4 0.9 20 5.2 5.3 1.1 44 9 5.0 1.5 20 Oman 4.1 20 2 1.8 39 5.4 6.3 1.6 120 9 7.3 2.8 22 Palestinian Territory 4.4 31 4 2.7 -1 6.6 9.1 2.1 99 20 7.9 4.1 40 Qatar 2.3 11 1 1.0 2 2.8 3.0 1.3 43 7 6.9 2.1 14 Saudi Arabia 30.8 22 4 1.8 2 37.4 42.4 1.4 122 16 7.3 2.9 30 Syria 22.0 24 4 2.1 -11 29.9 36.7 1.7 81 17 7.6 3.0 35 Turkey 77.2 16 5 1.1 0 88.3 93.3 1.2 145 10 5.7 2.1 25 United Arab Emirates 9.4 15 1 1.4 22 12.3 15.5 1.6 67 6 6.6 1.8 16 Yemen 26.0 36 8 2.8 -1 33.6 38.8 1.5 196 68 7.5 4.4 42 SOUTH CENTRAL ASIA 1,874 22 7 1.6 -1 2,220 2,516 1.3 133 47 5.7 2.5 31 CENTRAL ASIA 67 24 6 1.8 -1 81 93 1.4 95 41 5.1 2.7 29 Kazakhstan 17.3 23 8 1.5 -0 20.3 24.5 1.4 81 28 3.5 2.7 25 Kyrgyzstan 5.8 28 7 2.1 -1 7.5 9.4 1.6 105 27 4.9 3.2 31 Tajikistan 8.3 34 7 2.7 -5 11.2 14.8 1.8 129 57 6.9 3.8 36 Turkmenistan 5.3 22 8 1.4 -1 6.2 6.6 1.2 116 47 6.3 2.4 28 Uzbekistan 30.7 22 5 1.8 -1 35.8 38.1 1.2 89 44 6.5 2.4 28 SOUTH ASIA 1,806 22 7 1.5 -1 2,139 2,422 1.3 134 47 5.8 2.5 31 Afghanistan 31.3 35 8 2.7 -3 43.5 56.5 1.8 208 74 7.7 5.1 46 Bangladesh 158.5 20 6 1.5 -3 185.1 201.9 1.3 165 33 7.0 2.2 29 Bhutan 0.7 22 6 1.5 0 0.9 1.1 1.5 174 47 6.7 2.5 30 India 1,296.2 22 7 1.5 -0 1,510.0 1,656.9 1.3 129 44 5.5 2.4 31 Iran 77.4 19 5 1.4 -0 90.0 99.2 1.3 139 16 6.4 1.8 24 Maldives 0.4 23 3 1.9 -0 0.5 0.5 1.4 161 9 7.2 2.3 26 Nepal 27.1 22 7 1.5 -3 31.7 35.2 1.3 166 46 6.0 2.4 34 Pakistan 194.0 28 8 2.0 -3 254.7 348.0 1.8 123 74 6.6 3.8 38 Sri Lanka 20.7 18 6 1.2 -3 22.5 23.0 1.1 49 9 4.3 2.1 26 SOUTHEAST ASIA 621 19 7 1.3 -0 733 831 1.3 89 28 5.7 2.4 27 Brunei 0.4 16 3 1.3 1 0.5 0.5 1.3 34 4 5.8 1.6 25 Cambodia 14.8 24 6 1.8 -2 18.4 21.7 1.5 123 45 6.5 2.8 31 Indonesia 251.5 20 6 1.4 -1 306.7 365.3 1.5 109 32 5.5 2.6 29 Laos 6.8 26 6 2.0 -2 8.3 9.1 1.3 143 68 6.0 3.2 35 Malaysia 30.1 17 5 1.3 3 36.0 41.1 1.4 42 7 4.9 2.1 26 Myanmar 53.7 17 9 0.9 -1 58.7 58.6 1.1 116 49 6.0 2.0 25 Philippines 100.1 24 6 1.8 -1 127.8 157.1 1.6 63 23 6.3 3.0 34 Singapore 5.5 9 5 0.5 12 6.5 7.0 1.3 22 2.0 3.2 1.2 16 Thailand 66.4 12 8 0.4 0 66.8 61.0 0.9 69 11 5.6 1.8 18 Timor-Leste 1.2 37 10 2.7 0 1.8 2.9 2.4 186 63 5.9 5.7 42 Vietnam 90.7 17 7 1.0 -0 102.0 106.3 1.2 55 15 6.5 2.1 24 EAST ASIA 1,601 12 7 0.4 0 1,631 1,519 0.9 49 14 4.9 1.5 16 China 1,364.1 12 7 0.5 -0 1,400.1 1,311.8 1.0 51 15 5.5 1.6 16 China, Hong Kong SARf 7.2 8 6 0.2 4 8.1 8.6 1.2 21 1.6 3.3 1.1 11 China, Macao SARf 0.6 11 3 0.8 35 0.7 0.8 1.3 31 3 2.2 1.2 11 Japan 127.1 8 10 -0.2 1 116.6 97.1 0.8 14 1.9 2.1 1.4 13 Korea, North 24.9 15 9 0.5 -0 26.7 27.0 1.1 51 26 4.3 2.0 22 Korea, South 50.4 9 5 0.3 0 52.2 48.1 1.0 50 2.9 4.5 1.2 15 Mongolia 2.9 28 6 2.3 -0 3.5 4.3 1.5 112 26 7.6 2.9 28 Taiwan 23.4 8 7 0.1 1 23.5 21.0 0.9 27 3.7 3.9 1.1 14 EUROPE 741 11 11 0.0 2 746 726 1.0 27 6 2.3 1.6 16 EUROPEAN UNION 507 10 10 0.0 1 517 514 1.0 25 4 2.4 1.5 16 NORTHERN EUROPE 102 12 9 0.3 2 111 119 1.2 17 3 2.3 1.8 18 Channel Islands 0.2 11 8 0.3 0 0.2 0.2 1.1 24 2.9 2.1 1.7 15 Denmark 5.6 10 9 0.1 5 5.9 6.1 1.1 14 3.0 2.0 1.7 17 Estonia 1.3 11 12 -0.1 -5 1.2 1.2 0.9 22 2.1 2.2 1.5 16 Finland 5.5 11 9 0.1 3 5.8 6.1 1.1 13 1.8 1.8 1.8 16 Iceland 0.3 13 7 0.7 5 0.4 0.4 1.3 13 1.8 2.8 1.9 21 Ireland 4.6 15 7 0.9 -7 5.2 5.7 1.2 20 3.3 3.9 2.0 22 Latvia 2.0 10 14 -0.4 -12 1.6 1.4 0.7 20 3.6 2.0 1.5 14 Lithuania 2.9 10 14 -0.4 -6 2.7 2.5 0.9 23 3.6 2.4 1.6 15 POPULATION, HEALTH, AND ENVIRONMENT DATA AND ESTIMATES FOR THE COUNTRIES AND REGIONS OF THE WORLD