Latest Performance Report for: Brokencode.com
•
0 j'aime•911 vues

Report generated: Wed, Jul 3, 2013, 9:17 AM -0700 Test Server Region: Vancouver, Canada Using: Firefox (Desktop) 14.0.1, Page Speed 1.12.16, YSlow 3.1.6

Recommandé
Contenu connexe
Dernier
Dernier (20)
En vedette
En vedette (20)
Latest Performance Report for: Brokencode.com
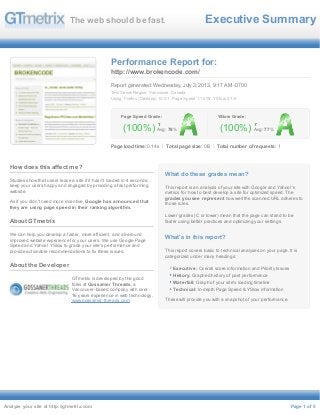
- 1. Executive SummaryThe web should be fast. (100%) Page Speed Grade: Avg: 78% (100%) YSlow Grade: Avg: 77% Performance Report for: http://www.brokencode.com/ Report generated: Wednesday, July 3, 2013, 9:17 AM -0700 Test Server Region: Vancouver, Canada Using: Firefox (Desktop) 14.0.1, Page Speed 1.12.16, YSlow 3.1.6 How does this affect me? Studies show that users leave a site if it hasn't loaded in 4 seconds; keep your users happy and engaged by providing a fast performing website. As if you didn't need more incentive, Google has announced that they are using page speed in their ranking algorithm. About GTmetrix We can help you develop a faster, more efficient, and all-around improved website experience for your users. We use Google Page Speed and Yahoo! YSlow to grade your site's performance and provide actionable recommendations to fix these issues. About the Developer GTmetrix is developed by the good folks at Gossamer Threads, a Vancouver-based company with over 16 years experience in web technology. www.gossamer-threads.com What do these grades mean? This report is an analysis of your site with Google and Yahoo!'s metrics for how to best develop a site for optimized speed. The grades you see represent how well the scanned URL adheres to those rules. Lower grades (C or lower) mean that the page can stand to be faster using better practices and optimizing your settings. What's in this report? This report covers basic to technical analyses on your page. It is categorized under many headings: Executive: Overall score information and Priority Issues History: Graphed history of past performance Waterfall: Graph of your site's loading timeline Technical: In-depth Page Speed & YSlow information These will provide you with a snapshot of your performance. Page load time: 0.14s Total page size: 0B Total number of requests: 1 Analyze your site at http://gtmetrix.com Page 1 of 5
- 2. History Page load times HTML D/L Time Page Load Time Page sizes and request counts Total Page Elements HTML Size Total Page Size Page Speed and YSlow scores Page Speed Score YSlow Score Jun 16 Jun 18 Jun 20 Jun 22 Jun 24 Jun 26 Jun 28 Jun 30 Jul 2 0.0 s 0.5 s 1.0 s Jun 16 Jun 18 Jun 20 Jun 22 Jun 24 Jun 26 Jun 28 Jun 30 Jul 2 49 KB 98 KB 146 KB 195 KB 244 KB 293 KB 5 10 15 Jun 16 Jun 18 Jun 20 Jun 22 Jun 24 Jun 26 Jun 28 Jun 30 Jul 2 60% 70% 80% 90% 100% Analyze your site at http://gtmetrix.com Page 2 of 5
- 3. Waterfall The waterfall graph displays the loading behaviour of your site in Firefox. It can be used to discover simple issues such as 404's or more complex issues such as external resources blocking page rendering. Brokencode | Bukan Sekedar Merusak Kode! 200 OK brokencode.com ? 1 Request ? 229ms (onload: 136ms) 229msGET bag?r[]=http://www.brokencode.com/wp-content/cache/minify/000000/M9bPKixNLarUMdAvTi7KLCgp1s_NT0ktysusKgIA.js Analyze your site at http://gtmetrix.com Page 3 of 5
- 4. 9 7 % 9 7 % 5 6 % 9 1 % 9 9 % 1 00 % 9 1 % 9 5 % 9 0 % 9 2 Page Speed Recommendations RECOMMENDATION GRADE RELATIVE TYPE PRIORITY Avoid bad requests A (100) Avg Score: 97% Content High Avoid landing page redirects A (100) Avg Score: 97% Server High Leverage browser caching A (100) Avg Score: 56% Server High Minimize redirects A (100) Avg Score: 91% Content High Minimize request size A (100) Avg Score: 99% Content High Put CSS in the document head A (100) Avg Score: 100% CSS High Remove query strings from static resources A (100) Avg Score: 91% Content High Specify a cache validator A (100) Avg Score: 95% Server High Specify a Vary: Accept-Encoding header A (100) Avg Score: 90% Server High Prefer asynchronous resources A (100) Avg Score: 92% JS Medium Analyze your site at http://gtmetrix.com Page 4 of 5
- 5. 1 00 % 2 3 % 4 3 % 6 6 % 7 % 7 6 % 8 6 % 1 00 % 1 00 % 1 00 % 1 00 % 9 5 % 1 00 % 9 4 % 1 00 % 4 3 % 1 00 % 9 7 % 7 2 % 1 00 % 1 00 % 5 2 % YSlow Recommendations RECOMMENDATION GRADE RELATIVE TYPE PRIORITY Avoid empty src or href A (100) Avg Score: 100% Content High Add Expires headers A (100) Avg Score: 23% Server High Make fewer HTTP requests A (100) Avg Score: 43% Content High Compress components with gzip A (100) Avg Score: 66% Server High Use a Content Delivery Network (CDN) A (100) Avg Score: 7% Server Medium Minify JavaScript and CSS A (100) Avg Score: 76% CSS/JS Medium Avoid URL redirects A (100) Avg Score: 86% Content Medium Make AJAX cacheable A (100) Avg Score: 100% JS Medium Put CSS at the top A (100) Avg Score: 100% CSS Medium Remove duplicate JavaScript and CSS A (100) Avg Score: 100% CSS/JS Medium Put JavaScript at bottom A (100) Avg Score: 100% JS Medium Avoid AlphaImageLoader filter A (100) Avg Score: 95% CSS Medium Avoid HTTP 404 (Not Found) error A (100) Avg Score: 100% Content Medium Reduce the number of DOM elements A (100) Avg Score: 94% Content Low Do not scale images in HTML A (100) Avg Score: 100% Images Low Use cookie-free domains A (100) Avg Score: 43% Cookie Low Use GET for AJAX requests A (100) Avg Score: 100% JS Low Avoid CSS expressions A (100) Avg Score: 97% CSS Low Reduce DNS lookups A (100) Avg Score: 72% Content Low Reduce cookie size A (100) Avg Score: 100% Cookie Low Make favicon small and cacheable A (100) Avg Score: 100% Images Low Configure entity tags (ETags) A (100) Avg Score: 52% Server Low Make JavaScript and CSS external (n/a) CSS/JS Medium Analyze your site at http://gtmetrix.com Page 5 of 5