Contenu connexe
Similaire à Pages from f metrics h_2
Similaire à Pages from f metrics h_2 (20)
Pages from f metrics h_2
- 1. Liquidity NBER
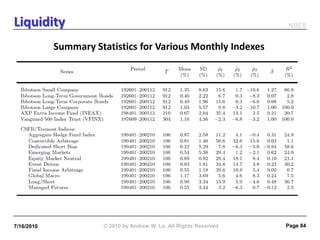
Summary Statistics for Various Monthly Indexes
7/16/2010 © 2010 by Andrew W. Lo, All Rights Reserved Page 84
- 2. Liquidity NBER
Summary Statistics for Individual Mutual Funds and Hedge Funds
Start Sample
Fund Date End Date Size Mean SD ρ1 ρ2 ρ3 p(Q 11)
(%) (%) (%) (%) (%) (%)
Mutual Funds
Vanguard 500 Index Oct-76 Jun-00 286 1.30 4.27 -4.0 -6.6 -4.9 64.5
Fidelity Magellan Jan-67 Jun-00 402 1.73 6.23 12.4 -2.3 -0.4 28.6
Investment Company of America Jan-63 Jun-00 450 1.17 4.01 1.8 -3.2 -4.5 80.2
Janus Mar-70 Jun-00 364 1.52 4.75 10.5 0.0 -3.7 58.1
Fidelity Contrafund May-67 Jun-00 397 1.29 4.97 7.4 -2.5 -6.8 58.2
Washington Mutual Investors Jan-63 Jun-00 450 1.13 4.09 -0.1 -7.2 -2.6 22.8
Janus Worldwide Jan-92 Jun-00 102 1.81 4.36 11.4 3.4 -3.8 13.2
Fidelity Growth and Income Jan-86 Jun-00 174 1.54 4.13 5.1 -1.6 -8.2 60.9
American Century Ultra Dec-81 Jun-00 223 1.72 7.11 2.3 3.4 1.4 54.5
Growth Fund of America Jul-64 Jun-00 431 1.18 5.35 8.5 -2.7 -4.1 45.4
Hedge Funds
Convertible/Option Arbitrage May-92 Dec-00 104 1.63 0.97 42.7 29.0 21.4 0.0
Relative Value Dec-92 Dec-00 97 0.66 0.21 25.9 19.2 -2.1 4.5
Mortgage-Backed Securities Jan-93 Dec-00 96 1.33 0.79 42.0 22.1 16.7 0.1
High Yield Debt Jun-94 Dec-00 79 1.30 0.87 33.7 21.8 13.1 5.2
Risk Arbitrage A Jul-93 Dec-00 90 1.06 0.69 -4.9 -10.8 6.9 30.6
Long/Short Equities Jul-89 Dec-00 138 1.18 0.83 -20.2 24.6 8.7 0.1
Multi-Strategy A Jan-95 Dec-00 72 1.08 0.75 48.9 23.4 3.3 0.3
Risk Arbitrage B Nov-94 Dec-00 74 0.90 0.77 -4.9 2.5 -8.3 96.1
Convertible Arbitrage A Sep-92 Dec-00 100 1.38 1.60 33.8 30.8 7.9 0.8
Convertible Arbitrage B Jul-94 Dec-00 78 0.78 0.62 32.4 9.7 -4.5 23.4
Multi-Strategy B Jun-89 Dec-00 139 1.34 1.63 49.0 24.6 10.6 0.0
Fund of Funds Oct-94 Dec-00 75 1.68 2.29 29.7 21.1 0.9 23.4
7/16/2010 © 2010 by Andrew W. Lo, All Rights Reserved Page 85
- 3. Liquidity NBER
At Least Five Possible Sources of Serial Correlation:
1. Time-Varying Expected Returns
2. Inefficiencies
3. Nonsynchronous Trading
4. Illiquidity
5. Performance Smoothing
For Alternative Investments, (4) and (5) Most Relevant:
(1) Is implausible over shorter horizons (monthly)
(2) Unlikely for highly optimized strategies
(3) Is related to (4)
(4) is common among many hedge-fund strategies
(5) may be an issue for some funds
7/16/2010 © 2010 by Andrew W. Lo, All Rights Reserved Slide 86
- 4. Liquidity NBER
Why Is Autocorrelation An Indicator?
If this pattern exists and is strong, it can be exploited
– Large positive return this month ⇒ increase exposure
– Large negative return this month ⇒ decrease exposure
– This leads to higher profits, so why not?
Two reasons that hedge funds don’t do this:
1. They are dumb (possible, but unlikely)
2. They can’t (assets are too illiquid)
Illiquid assets creates the potential for fraud
How? Return-Smoothing
7/16/2010 © 2010 by Andrew W. Lo, All Rights Reserved Page 87
- 5. Liquidity NBER
What Is Return-Smoothing?
Inappropriate valuation of illiquid fund assets
In very good months, report less profits than actual
In very bad months, report less losses than actual
What’s the Harm? Isn’t This Just “Conservative”?
No, it’s fraud (GAAP fair value measurement, FAS 157)
Imagine potential investors drawn in by lower losses
Imagine exiting investors that exit with lower gains
Imagine investors going in/out and “timing” these cycles
Smoother returns imply higher Sharpe ratios (moth-to-flame)
7/16/2010 © 2010 by Andrew W. Lo, All Rights Reserved Page 88
- 6. Liquidity NBER
Smooth Returns Are Not Always Deliberate
What is the monthly return of your house?
Certain assets and strategies are known to be illiquid
Smoothness is created by “three-quote rule” (averaging)
For complex derivatives, mark-to-model is not unusual
But these situations provide opportunities for abuse
What to look for:
Extreme autocorrelation (more than 25%, less than −25%)
Mark-to-model instead of mark-to-market
No independent verification of valuations
Secrecy, lack of transparency
7/16/2010 © 2010 by Andrew W. Lo, All Rights Reserved Page 89
- 7. Liquidity NBER
Average ρ1 for Funds in the TASS Live and Graveyard Databases
February 1977 to August 2004
7/16/2010 © 2010 by Andrew W. Lo, All Rights Reserved Page 90
- 8. Liquidity NBER
A Model of Smoothed Returns
Suppose true returns are given by:
Suppose observed returns are given by:
7/16/2010 © 2010 by Andrew W. Lo, All Rights Reserved Slide 91
- 9. Liquidity NBER
This model implies:
7/16/2010 © 2010 by Andrew W. Lo, All Rights Reserved Slide 92
- 10. Liquidity NBER
Estimate MA(2) via maximum likelihood:
7/16/2010 © 2010 by Andrew W. Lo, All Rights Reserved Slide 93
- 11. Liquidity NBER
7/16/2010 © 2010 by Andrew W. Lo, All Rights Reserved Slide 94
- 12. Liquidity NBER
Managing Liquidity Exposure Explicitly
Define a liquidity metric
Construct mean-variance-liquidity-optimal
portfolios
Monitor changes in surface over time and Mean-Variance-Liquidity Surface
market conditions
See Lo, Petrov, Wierzbicki (2003) for
details
Tangency Portfolio Trajectories
7/16/2010 © 2010 by Andrew W. Lo, All Rights Reserved Slide 95
- 13. Hedge Funds and
Systemic Risk
References
Acharya, V. and M. Richardson, eds., 2009, Restoring Financial Stability: How to
Repair a Failed System. New York: John Wiley & Sons.
Billio, M., Getmansky, M., Lo, A. and L. Pelizzon, 2010, “Econometric Measures of
Systemic Risk in the Finance and Insurance Sectors”, SSRN No. 1571277.
Chan, N., Getmansky, M., Haas, S. and A. Lo, 2007, “Systemic Risk and Hedge
Funds”, in M. Carey and R. Stulz, eds., The Risks of Financial Institutions and the
Financial Sector. Chicago, IL: University of Chicago Press.
7/16/2010 © 2010 by Andrew W. Lo, All Rights Reserved Slide 96
- 14. Hedge Funds and Systemic Risk NBER
Lessons From August 1998:
Liquidity and credit are critical to the macroeconomy
Multiplier/accelerator effect of leverage
Hedge funds are now important providers of liquidity
Correlations can change quickly
Nonlinearities in risk and expected return
Systemic risk involves hedge funds
But No Direct Measures of Systemic Risk
7/16/2010 © 2010 by Andrew W. Lo, All Rights Reserved Page 97
- 15. Hedge Funds and Systemic Risk NBER
Five Indirect Measures:
1. Liquidity Risk
2. Risk Models for Hedge Funds
3. Industry Dynamics
4. Hedge-Fund Liquidations
5. Network Models (preliminary)
For More Details, See:
Chan, Getmansky, Haas, and Lo (2005)
Getmansky, Lo, and Makarov (2005)
Lo (2008)
Billio, Getmansky, Lo, and Pelizzon (2010)
7/16/2010 © 2010 by Andrew W. Lo, All Rights Reserved Page 98
- 22. Early Warning Signs NBER
“The nightmare script for
Mr. Lo would be a series
of collapses of highly
leveraged hedge funds
that bring down the
major banks or brokerage
firms that lend to them.”
7/16/2010 © 2010 by Andrew W. Lo, All Rights Reserved Page 105
- 23. Early Warning Signs NBER
Some Experts Disagreed:
“In approaching its task, the
Policy Group shared a broad
consensus that the already low
statistical probabilities of the
occurrence of truly systemic
financial shocks had further
declined over time.”
– CRMPG II, July 27, 2005, p. 1
7/16/2010 © 2010 by Andrew W. Lo, All Rights Reserved Page 106
- 24. Early Warning Signs NBER
But CRMPG II Also Contained:
…Recommendations 12, 21 and 22, which call for
urgent industry-wide efforts (1) to cope with serious
“back-office” and potential settlement problems in
the credit default swap market and (2) to stop the
practice whereby some market participants “assign”
their side of a trade to another institution without the
consent of the original counterparty to the trade.
(CRMPG II, July 27, 2005, p. iv)
7/16/2010 © 2010 by Andrew W. Lo, All Rights Reserved Page 107
- 25. Early Warning Signs NBER
Firms Represented in CRMPG II:
Bear Stearns JPMorgan Chase
Citigroup Merrill Lynch
Cleary Gottlieb Morgan Stanley
Deutsche Bank Lehman Brothers
GMAM TIAA CREF
Goldman Sachs Tudor Investments
HSBC
7/16/2010 © 2010 by Andrew W. Lo, All Rights Reserved Page 108
- 26. Granger Causality Networks (Billio et al. 2010) NBER
Granger Causality Is A Statistical Relationship
Y ⇒G X if {bj} is different from 0
X ⇒G Y if {dj} is different from 0
If both {bj} and {dj} are different from 0, feedback relation
Consider causality among the monthly returns of hedge funds,
publicly traded banks, brokers, and insurance companies
7/16/2010 © 2010 by Andrew W. Lo, All Rights Reserved Page 109
- 29. Granger Causality Networks NBER
LTCM 1998
Internet
Bubble
Crash
Financial
Crisis of
2007-2009
7/16/2010 © 2010 by Andrew W. Lo, All Rights Reserved Page 112
- 31. August 1998,
August 2007,
May 2010, ...
References
Khandani, A. and A. Lo, 2007, “What Happened To The Quants In August 2007?”,
Journal of Investment Management 5, 29–78.
Khandani, A. and A. Lo, 2010, “What Happened To The Quants In August 2007?:
Evidence from Factors and Transactions Data”, to appear in Journal of Financial
Markets.
NANEX, 2010, “Analysis of the Flash Crash”,
http://www.nanex.net/20100506/FlashCrashAnalysis_CompleteText.html.
7/16/2010 © 2010 by Andrew W. Lo, All Rights Reserved Slide 114
- 32. The Quant Meltdown of August 2007 NBER
Quantitative Equity Funds Hit Hard In August 2007
Specifically, August 7–9, and massive reversal on August 10
Some of the most consistently profitable funds lost too
Seemed to affect only quants Wall Street Journal
No real market news September 7, 2007
What Is The Future of Quant?
Is “Quant Dead”?
Can “it” happen again?
What can be done about it?
But Lack of Transparency Is
Problematic!
Khandani and Lo (2007, 2010)
7/16/2010 © 2010 by Andrew W. Lo, All Rights Reserved Page 115
- 33. A New Microscope NBER
Use Strategy As Research Tool
Lehmann (1990) and Lo and MacKinlay (1990)
Basic mean-reversion strategy:
7/16/2010 © 2010 by Andrew W. Lo, All Rights Reserved Page 116
- 34. A New Microscope NBER
Use Strategy As Research Tool
Linearity allows strategy to be analyzed explicitly:
7/16/2010 © 2010 by Andrew W. Lo, All Rights Reserved Page 117
- 35. A New Microscope NBER
Simulated Historical Performance of Contrarian Strategy
7/16/2010 © 2010 by Andrew W. Lo, All Rights Reserved Page 118
- 36. A New Microscope NBER
Simulated Historical Performance of Contrarian Strategy
7/16/2010 © 2010 by Andrew W. Lo, All Rights Reserved Page 119
- 37. Total Assets, Expected Returns, and Leverage NBER
7/16/2010 © 2010 by Andrew W. Lo, All Rights Reserved Page 120
- 38. A New Microscope NBER
Basic Leverage Calculations
Regulation T leverage of 2:1 implies
More leverage is available:
Leverage magnifies risk and return:
7/16/2010 © 2010 by Andrew W. Lo, All Rights Reserved Page 121
- 39. Total Assets, Expected Returns, and Leverage NBER
How Much Leverage Needed To Get 1998 Expected Return Level?
In 2007, use 2006 multiplier of 4
Required Leverage Ratios For Contrarian Strategy To Yield
8:1 leverage 1998 Level of Average Daily Return
Compute leveraged returns Average Required
How did the contrarian strategy Daily Return Leverage
Year Return Multiplier Ratio
perform during August 2007?
Recall that for 8:1 leverage: 1998 0.57% 1.00 2.00
1999 0.44% 1.28 2.57
– E[Rpt] = 4 × 0.15% = 0.60% 2000 0.44% 1.28 2.56
– SD[Rpt] = 4 × 0.52% = 2.08% 2001 0.31% 1.81 3.63
2002 0.45% 1.26 2.52
2003 0.21% 2.77 5.53
⇒ 2007 Daily Mean: 0.60% 2004 0.37% 1.52 3.04
2005 0.26% 2.20 4.40
⇒ 2007 Daily SD: 2.08% 2006 0.15% 3.88 7.76
2007 0.13% 4.48 8.96
7/16/2010 © 2010 by Andrew W. Lo, All Rights Reserved Page 122
- 40. What Happened In August 2007? NBER
Daily Returns of the Contrarian Strategy In August 2007
7/16/2010 © 2010 by Andrew W. Lo, All Rights Reserved Page 123
- 41. What Happened In August 2007? NBER
Daily Returns of Various Indexes In August 2007
7/16/2010 © 2010 by Andrew W. Lo, All Rights Reserved Page 124
- 42. Comparing August 2007 To August 1998 NBER
Daily Returns of the Contrarian Strategy In August and September 1998
7/16/2010 © 2010 by Andrew W. Lo, All Rights Reserved Page 125
- 43. Comparing August 2007 To August 1998 NBER
Daily Returns of the Contrarian Strategy In August and September 1998
7/16/2010 © 2010 by Andrew W. Lo, All Rights Reserved Page 126
- 44. The Unwind Hypothesis NBER
What Happened?
Losses due to rapid and large unwind of quant fund (market-neutral)
Liquidation is likely forced because of firesale prices (sub-prime?)
Initial losses caused other funds to reduce risk and de-leverage
De-leveraging caused further losses across broader set of equity funds
Friday rebound consistent with liquidity trade, not informed trade
Rebound due to quant funds, long/short, 130/30, long-only funds
Lessons
“Quant” is not the issue; liquidity and credit are the issues
Long/short equity space is more crowded now than in 1998
Hedge funds provide more significant amounts of liquidity today
Hedge funds can withdraw liquidity suddenly, unlike banks
Financial markets are more highly connected ⇒ new betas
7/16/2010 © 2010 by Andrew W. Lo, All Rights Reserved Page 127
- 45. Factor-Based Strategies NBER
Construct Five Long/Short Factor Portfolios
Book-to-Market
Earnings-to-Price
Cashflow-to-Price
Price Momentum
Earnings Momentum
Rank S&P 1500 stocks monthly
Invest $1 long in decile 10 (highest), $1 short in decile 1 (lowest)
Equal-weighting within deciles
Simulate daily holding-period returns
7/16/2010 © 2010 by Andrew W. Lo, All Rights Reserved Page 128
- 46. Factor-Based Strategies NBER
Cumulative Returns of Factor-Based Portfolios
January 3, 2007 to December 31, 2007
7/16/2010 © 2010 by Andrew W. Lo, All Rights Reserved Page 129
- 47. Factor-Based Strategies NBER
Using Tick Data, Construct Long/Short Factor Portfolios
Same five factors
Compute 5-minute returns from 9:30am to 4:00pm (no overnight returns)
Simulate intra-day performance of five long/short portfolios
7/16/2010 © 2010 by Andrew W. Lo, All Rights Reserved Page 130
- 48. Proxies for Market-Making Profits NBER
What Happened To Market-Makers During August 2007?
Simulate simpler contrarian strategy using TAQ data
– Sort stocks based on previous m-minute returns
– Put $1 long in decile 1 (losers) and $1 short in decile 10 (winners)
– Rebalance every m minutes
– Cumulate profits
Profitability of contrarian strategy should proxy for market-making P&L
Let m vary to measure the value of liquidity provision vs. horizons
Greater immediacy ⇒ larger profits on average
Positive profits suggest the presence of discretionary liquidity providers
Negative profits suggest the absence of discretionary liquidity providers
Given positive bid/offer spreads, on average, profits should be positive
7/16/2010 © 2010 by Andrew W. Lo, All Rights Reserved Page 131
- 49. Proxies for Market-Making Profits NBER
Cumulative m -Min Returns of Intra-Daily Contrarian Profits for Deciles 10/1 of
S&P 1500 Stocks July 2 to September 30, 2008
4.50
60 Min
4.00 30 Min
15 Min
3.50 10 Min
5 Min
3.00
Cumulative Return
2.50
2.00
1.50
1.00
0.50
0.00
7/2/07 7/11/07 7/19/07 7/27/07 8/6/07 8/14/07 8/22/07 8/30/07 9/10/07 9/18/07 9/26/07
12:00:00 12:00:00 12:00:00 12:00:00 12:00:00 12:00:00 12:00:00 12:00:00 12:00:00 12:00:00 12:00:00
7/16/2010 © 2010 by Andrew W. Lo, All Rights Reserved Page 132
- 50. August 2007: A Preview of May 2010? NBER
Profitability of Intra-Daily and Daily Strategies
Over Various Holding Period, August 1–15, 2007
7/16/2010 © 2010 by Andrew W. Lo, All Rights Reserved Page 133
- 51. NBER
7/16/2010 © 2010 by Andrew W. Lo, All Rights Reserved Page 134
- 52. Summary and
Conclusions
References
Lo, A., 2009, “Regulatory Reform in the Wake of the Financial Crisis of 2007–2008”,
Journal of Financial Economic Policy 1, 4–43.
Pozsar, Z., Adrian, T., Ashcraft, A. and H. Boesky, 2010, “Shadow Banking”, Federal
Reserve Bank of New York Staff Report No. 458.
7/16/2010 © 2010 by Andrew W. Lo, All Rights Reserved Slide 135
- 53. Topics for Future Research NBER
Time-varying parameters of hedge-fund returns
Dynamic correlations, rare events, tail risk
Funding risk, leverage, and market dislocation
Hedge funds and the macroeconomy
Welfare implications of hedge funds (how much is too
much liquidity?)
Industrial organization of the hedge-fund industry
Incentive contracts and risk-taking
7/16/2010 © 2010 by Andrew W. Lo, All Rights Reserved Page 136
- 54. Current Trends In The Industry NBER
Hedge-fund industry has already changed dramatically
Assets are near all-time highs again, and growing
Registration is almost certain (majority already registered)
Will likely have to provide more disclosure to regulators
– Leverage, positions, counterparties, etc.
Financial Stability Oversight Council will have access
Office of Financial Research (Treasury) will manage data
If Volcker Rule passes, more hedge funds will be created!
Traditional businesses will move closer to hedge funds
Market gyrations will create more opportunities and risks
Hedge funds will continue to be at the leading/bleeding edge
7/16/2010 © 2010 by Andrew W. Lo, All Rights Reserved Page 137
- 55. Additional References NBER
Campbell, J., Lo, A. and C. MacKinlay, 1997, The Econometrics of Financial Markets. Princeton, NJ: Princeton
University Press.
Chan, N., Getmansky, M., Haas, S. and A. Lo, 2005, “Systemic Risk and Hedge Funds”, to appear in M. Carey and
R. Stulz, eds., The Risks of Financial Institutions and the Financial Sector. Chicago, IL: University of Chicago Press.
Getmansky, M., Lo, A. and I. Makarov, 2004, “An Econometric Analysis of Serial Correlation and Illiquidity in
Hedge-Fund Returns”, Journal of Financial Economics 74, 529–609.
Getmansky, M., Lo, A. and S. Mei, 2004, “Sifting Through the Wreckage: Lessons from Recent Hedge-Fund
Liquidations”, Journal of Investment Management 2, 6–38.
Haugh, M. and A. Lo, 2001, “Asset Allocation and Derivatives”, Quantitative Finance 1, 45–72.
Hasanhodzic, J. and A. Lo, 2006, “Attack of the Clones”, Alpha June, 54–63.
Hasanhodzic, J. and A. Lo, 2007, “Can Hedge-Fund Returns Be Replicated?: The Linear Case”, Journal of
Investment Management 5, 5–45.
Khandani, A. and A. Lo, 2007, “What Happened to the Quants In August 2007?”, Journal of Investment
Management 5, 29−78.
Khandani, A. and A. Lo, 2009, “What Happened to the Quants In August 2007?: Evidence from Factors and
Transactions Data”, to appear in Journal of Financial Markets.
Lo, A., 1999, “The Three P’s of Total Risk Management”, Financial Analysts Journal 55, 13–26.
Lo, A., 2001, “Risk Management for Hedge Funds: Introduction and Overview”, Financial Analysts Journal 57, 16–
33.
Lo, A., 2002, “The Statistics of Sharpe Ratios”, Financial Analysts Journal 58, 36–50.
7/16/2010 © 2010 by Andrew W. Lo, All Rights Reserved Page 138
- 56. Additional References NBER
Lo, A., 2004, “The Adaptive Markets Hypothesis: Market Efficiency from an Evolutionary Perspective”, Journal of
Portfolio Management 30, 15–29.
Lo, A., 2005, The Dynamics of the Hedge Fund Industry. Charlotte, NC: CFA Institute.
Lo, A., 2005, “Reconciling Efficient Markets with Behavioral Finance: The Adaptive Markets Hypothesis”, Journal
of Investment Consulting 7, 21–44.
Lo, A., 2008, “Where Do Alphas Come From?: Measuring the Value of Active Investment Management”, Journal
of Investment Management 6, 1–29.
Lo, A., 2008, Hedge Funds: An Analytic Perspective. Princeton, NJ: Princeton University Press.
Lo, A., 2008, “Hedge Funds, Systemic Risk, and the Financial Crisis of 2007–2008: Written Testimony of Andrew
W. Lo”, Prepared for the U.S. House of Representatives Committee on Oversight and Government Reform
November 13, 2008 Hearing on Hedge Funds.
Lo, A., 2009, “Regulatory Reform in the Wake of the Financial Crisis of 2007–2008”, to appear in Journal of
Financial Economic Regulation.
Lo, A. and C. MacKinlay, 1999, A Non-Random Walk Down Wall Street. Princeton, NJ: Princeton University Press.
Lo, A., Petrov, C. and M. Wierzbicki, 2003, “It's 11pm—Do You Know Where Your Liquidity Is? The Mean-
Variance-Liquidity Frontier”, Journal of Investment Management 1, 55–93.
7/16/2010 © 2010 by Andrew W. Lo, All Rights Reserved Page 139