1. KNOWLEDGE MINING
1. Background
During the last few years, data or text mining has received more and more attention from
different fields, especially from the business community. This commercial interest has
grown mainly because of the potential in discovering knowledge from the vast amount of
data collected from customers for improving business competitiveness.
Knowledge mining can be defined as a process of extracting systematic patterns or
relationships and other information from databases for improving people’s decision
ability. It has a wide range of applications including business intelligence gathering, drug
discovery, product design, intelligent manufacturing, supply-chain management, logistics
and even research profiling. The following briefly provide a few examples.
In business:
• Targeting specific products and services that the customers are more likely to buy;
• Determining buying patterns of credit card customers to predict their future
purchases. Such information can also be used, for instance, for identifying stolen
credit cards.
In product design and development:
• Learning the relationships between customer needs and design specifications;
• Based on past projects the factors affecting a project’s success/failure can be
identified systematically.
In manufacturing:
• Fault diagnosis and prediction of the amount of product defects in manufacturing
processes;
• Operational manufacturing control such as intelligent scheduling systems, which
learns dynamic behavior of process outcomes, and generates control policies.
Knowledge mining software like Enterprise Miner and Intelligent Miner released by
SAS and IBM, respectively, are very popular in many applications. Companies utilized
knowledge mining tools successfully in their operations include: Fleet financial group
(customer characteristics analysis), Ford (harshness, noise and vibration analysis), Boeing
(post-flight diagnostics), Kodak (data visualization), Texas Instruments (fault diagnosis)
and Motorola (customer data management and analysis).
Knowledge mining process is iterative and consists of the following main stages:
understanding problem goals; data selection; data cleaning and preprocessing;
discovering patterns; analysis and interpretation; reporting and using discovered
knowledge. In particular, pattern discovery is a crucial step. There are several
approaches to discover patterns including classification, association, clustering,
regression, sequence analysis and visualization. Each of these approaches can be
implemented via one of the following competing and yet complementary techniques such
as statistical data analysis, artificial neural networks, machine learning, and pattern
recognition. We will not go deeply into the core of the above methods. Instead, let us
2. present a real application of pattern discovery using a machine learning technique called
CART (Classification and Regression Trees) in financial analysis.
There are three main reasons for the popularity of tree-based methods used in CART.
First, they decompose a complex problem into a series of simpler problems (e.g., binary
decisions). Second, the tree structure resulted from successive decompositions of the
data often provides a great understanding of the complex problem. Third, the methods
generally require a minimal set of assumptions for solving the problem.
Example 1 (Customer Characteristics): Fleet Financial Group, a Boston based
financial services company with assets of more than $97 billion, is currently redesigning
its customer service infrastructure, including a $38 million investment in a data
warehouse and marketing automation software. To profit from this repository of valuable
information on more than 15 million customers, Fleet's analysts are using data mining
tools to learn about their customers and to better target product promotions, such as home
equity lines of credit. In order to target the mailing list for the company's third quarter
home equity product promotion, Fleet wants to develop a model to estimate each
prospect’s probability of responding to the mailing, as well as estimate the expected
profitability of respondents. Based on this expected profitability, the database would be
segmented by scores that identify which prospects should receive one of several home
equity marketing pieces and which should not receive a mailing at all.
By hybridizing CART and logistic regression techniques, Fleet was able to use each
methodology’s strength to complement the other’s. The first step in the modeling process
was to gather the historical data for creating a prediction model. Fleet selected a sample
of approximately 20,000 customers with response records; included were 100 percent of
past profitable respondents, as well as two percent of past non-respondents. The data set
was then transferred into CART to display the interaction of the data. The resulting
effects were incorporated into a logistic regression model that illustrated the overall and
local landscape of the data.
When the data were fed into CART, the software automatically generated a decision
tree whose branches and nodes showed the hierarchy of binary data-splits and displayed
the data set’s myriad variables and their interactions. This hierarchy distilled nearly 100
predictor variables into a more manageable amount of approximately 25. In addition, the
CART nodes provided probability ratios that were used to understand why one segment
would be more responsive than another.
The CART model illustrated certain characteristics of “best” respondents by
predicting the expected balance they would carry on the credit line, as well as how much
they might transfer from another line. In addition, the CART results painted a portrait of
the principal characteristics of the least responsive customers. These prospects would
either not likely respond to a Fleet product offer because they do not have a need for a
large line of credit, or - equally of concern - they would respond but their subsequent
credit line usage and/or likely loss would not be profitable for the bank.
Fleet’s project team is cautiously taking into consideration other factors, such as the
mailing’s time of year and the number of other financial product offerings that customers
have received recently. “Test and control groups are needed to validate the efficiency of
3. our targeting with this predictive model”, said by Fleet’s project manager. “We are,
however, very confidant that Fleet will achieve a high response rate with this mailing.
Our customers have many more dimensions than the previous mailing model could
encapsulate for predictions. Creating a hybrid model using CART and our other data
mining and statistical tools was a more sophisticated approach that painted a very
descriptive portrait of our prospects, enabling us to increase the probability of their
response.” See www.salford-systems.com for more details.
The following present two other examples in different fields to show the wide-range
applicability of knowledge mining tools.
Example 2 (Product Design): Through the advance in computer and communication
systems, process sequences of engineering product designers (or analysts) working
together to develop products can be recorded in databases. Data and text mining
techniques start to become useful in capturing design knowledge and make significant
impact in shortening design cycles and meeting customer needs. In a project (Ishino and
Jin, 2001) of designing a “double-reduction” gear system consisting of four gears, three
shafts, a few bearings and a case, pattern matching and dynamic programming procedures
were used to select one design satisfying the evaluation criteria and being competitive to
other seven alternatives at all design sequences.
Gabowski, Lossack and Weibkopf (2001) described the use of geometric object
classification system to search databases of parts for automatically locating the part
matching the requirements of a design. Machine learning tools (e.g., C4.5 and CART)
were used in Schwabacher, Ellman and Hirsh (2001) to select the best prototype and
predict which design goals are achievable. Specifically, given a set of constraints
including windy speed and race course, a combination of eight design parameters of
racing yachts was selected to minimize the race time. r
Example 3 (Research Profiling): Text mining is useful in discovering intelligence in
a large body of electronic text sources such as publications, patents and grant-award
abstracts. Applying the text mining techniques to review the literature in “mining
information in large databases,” Porter, Kongthon and Lu (2002) spotlighted 15 ways for
their research profiling procedures to be useful. They include (#’s in parentheses refer to
the 15 ways illustrated in the case analyses of their paper):
Depict the research context to target our research efforts wisely (1)
− observe related topics (techniques) within our “large database mining” domain (2)
− observe related techniques beyond our “large database mining” domain (15)
– gain a “big picture” perspective on the research activity (in our case, in data
splitting, analysis and integration) (7)
– at the “big picture” level find intersecting interests (8)
Understand the research community
– identify a range of information sources (9)
− use the distribution of research literature in its own right to gain insight into how
innovation is progressing (10)
4. − find active organizations and individuals whose research relates to one’s own
interests, particularly those working in different disciplines or research domains
(15)
Explore topics (techniques) (11)
– map (graphically represent) topical interrelationships for a whole research area (4)
– examine how our target technique fits with other approaches (6)
− generate research opportunities in combining techniques – through mapping (12)
or in-depth probing (13)
− examine trends to ascertain which topics are “hot” (3)
− zoom in to examine promising topics in depth (5)
Furthermore, Kongthon (2004) developed text-based association-rule mining procedures
to capture parent-child hierarchies and sibling relations among related terms. Application
of the procedures to abstracts of Thailand’s science and technology publications provided
several insights for improving strategies of managing Thai government’s R&D funding
policies. p
2. Methodological Studies of Knowledge Mining Methods
Although data mining procedures are successful in many applications as illustrated in
examples given above, most of them are not effective in dealing with large size of data.
If there is an effective way of reducing the size of data, the commonly used data mining
procedures could then be useful. Lu (2001) outlined several data-reduction ideas. They
include: splitting data sets into smaller pieces, sampling representative data and using
summarizing, modeling and transformation techniques to reduce the size of data.
However, special procedures are required for some data with complicated nonstationary
structure such as the antenna testing signals as shown in Figure 1. The following show a
few examples from on-going research in ISyE.
Figure 1: Data Signals from Nortel’s Antenna Manufacturing Process
Example 4 (Wavelet-based Data Reduction): Professors Lu, Vidokovic, Huo and
their students have developed a data reduction method for complicated functional data
based on wavelets. Six testing curves and two real-life data sets were used to compare
their methods with procedures for data compression in the signal processing field and for
data denoising in the statistical modeling field. Jeong et al. (2004) showed that their
5. methods are more aggressive in reducing the size of data without sacrificing much
modeling accuracy. In their experiment, some of the data cannot be analyzed by
commercial software due to the large size of data, but are easily handled by the same data
mining tool (e.g., cluster analysis) when the data reduction methods were used.
Examples in detecting process problems in manufacturing applications showed the
potential of the developed methods. p
Example 5 (Data Reduction for Multiple Curves): Most of the data reduction, data
compression and data denoising procedures were developed for a single curve. In Jung
and Lu (2004) a wavelet-based random-effect model was proposed to characterize the
behavior of multiple curves collected in antenna testing and in sheet-metal stamping
process for automobile manufacturing. Then, “vertical energy” based thresholding”
procedures were developed to reduce the size of data. Real-life and simulation examples
showed that the proposed methods have excellent data reduction properties and the
modeling accuracy is very satisfactory. Data mining (e.g., hierarchical clustering) based
on the reduced-size data provided the same amount of decision power as analyzing the
original large-size data. o
Example 6 (Statistical Process Control (SPC)): SPC techniques are very popular in
monitoring quality measures in manufacturing and service industries. Examples include
automobile manufacturing’s quality monitoring (Lawless et al., 1999), checking potential
shifts in signals provided by mass flow controllers in semiconductor manufacturing
(Kang and Albin, 2000) and detecting changes in acoustic emission signal patterns in
nano-manufacturing (Ganesa et al., 2003). Just as monitoring testing results from
antennae produced from Nortel’s manufacturing process, these examples all discussed
problems of monitoring linear and nonlinear curve data using the traditional SPC
procedures. Moreover, in some applications (e.g., nano-manufacturing) the data size
could be very large for typical SPC procedures to handle. Jeong and Lu (2004)
developed SPC procedures to select a few data quantities well representing data change-
patterns such that the process monitoring can be efficient and effective. A series of
investigations based on simulation and real-life example studies showed that the
proposed methods perform better than procedures extended from the literature. p
3. Novel Applications
There are several on-going projects in ISyE for developing novel applications of
knowledge mining tools. The following show a few examples.
Example 7 (Supply-chain and Logistics Management): Lu and his graduate students,
Wang and Mangotra, are working on multi-scale modeling techniques to summarize the
information collected from supply-chain’s logistics network (including distribution
centers (DCs) and store locations and demands) for strategic decision-making purposes.
Statistical spatial models such as Kriging (Cressie, 1993), spatially correlated Poisson
and conditional autoregressive Gaussian (Besag et al., 1991) are used to model the large-
size data at different scales of details. Generalized estimating equations are developed to
link the summary information at various levels. With these approximated models
6. representing the logistics network, decisions at different scales, such as the locations and
capacities of global-level DCs serving stores in larger regions (covering many states),
local DCs serving a few counties and city-level supply-routes can then be evaluated. A
combination of data mining techniques, statistical modeling methods, game theory and
optimization methods is used to derive sound decisions for “coordinately managing”
inventory at different levels of DCs and retail-stores’ shelf-space for meeting various
space and time constraints.
Example 8 (Supply-chain’s Acceptance Sampling Plans): There are many reasons
that product shipments could contain certain amount of “damages” when they arrive DCs
and stores. In Kim, Lu and Kvam (2004) “Product damages” include missing
components, broken packages and goods, or even wrong orders. These problems resulted
numerous unsoldable products at stores. If there is no inspection for the in-coming
products at DCs or stores, it will be very expensive to deal with these damaged products
at the final destination of the supply-chain, the retailing store. In working with one of the
largest retailers in the world selling more than 5,000 products, Dr. Lu’s team discovered
that the amount of “damaged” products could be as high as 20% causing serious
“stockout” problems at stores. Thus, it is critical to dig into product damage information
across the entire supply chain collected at various locations and in several time points for
developing a cost justifiable, efficient (keeping the logistics flow smoothly) and effective
(weeding out most of defects) acceptance sampling plan. Moreover, extending the SPC
procedures studied in Example 6 to the supply-chain data collected at multiple stages can
detect anomalies in the logistics processes. This research could also be very important in
the third-party oriented “just-in-time” manufacturing, where parts are shipped through
supply-chain for making half-finished products and moving to various levels of assembly
centers for making the final products at the destination. c
Example 9 (Support Vector Tree): Professors Huo and Tsui, together with their
graduate students, are working on several projects for extending data mining’s
applicability. In particular, they have explored the idea of using Support Vector Tree
(SVT) to extend the applicability of a very population classification tool, Support Vector
Machine (SVM). One problem with the current version of SVM is that it only considers
two classes, i.e., the responses are binary. Extending the SVM method with a tree-
structured hierarchical model, Huo et al. (2002) introduced SVT for handling responses
with multiple classes. See their paper for possible applications in areas such as logistics,
target recognition and automatic control. t
Example 10 (Beamlets): Knowledge discovery requires great computational
efficiency in data mining algorithms. In analyzing pattern detection problem for image
analysis, Arias, Donoho and Huo (2003) shows that by using a multi-scale method −
beamlets − they can achieve the statistical and computational optimality simultaneously.
Their work has been used in improving Lockheed Martin’s Automatic Target
Recognition (ATR) systems. R
Example 11 (Security Intelligence Mining): Professors Huo and Wu have a project
supported by the National Science Foundation for locating “sparse” pattern in large-size
stream data. Currently, their challenge is to identify a few events not occurred often
7. (called “sparse” events) from monitoring large-size Internet traffic data for exploring
potential terrorist activities. Huo and Chen (2004) have developed a special decision tree
(cascade) to efficiently locate sparse events. Application to a fast-rate network traffic
data shows the potential of this research.
Dr. Lu’s group is working on “scenario”-based intelligence mining methods. The
motivation is from the following statements made by the Director Tony Tether of the
DARPA on May 6, 2003 before several members of the House of Representatives. “The
current commercially available data mining tools are ineffective for identifying patterns
and building predictive models to understand terrorist activities.” “Fishing expeditions”
through massive amounts of personal data is a wholesale invasion of Americans’
privacy.” Their research follows DARPA’s approach of developing attack “scenarios,”
useful in locating specific patterns that could indicate terrorist activities. The following
outlines a few key steps in their on-going research.
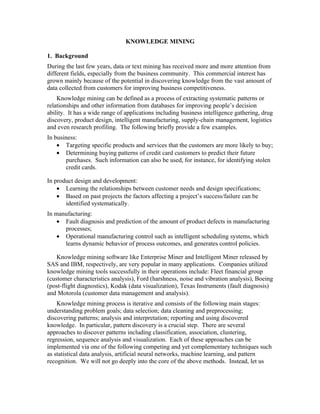
Interactive
Text Visualization
Mining System Intelligence
and
Law Enforcement
Link Characterization System Link Modeling System
Iterate
Entities Link Temporal Indirect Pruning Entity Entity Scenario Goodness
and Matrix Sequencing Link Module Clustering Modeling Classification Measure
Relations Module Module Module Module Module Module
Scenario
Background
Model and
Data Identify
Database
Anomalies
Expert
Panel
Figure 2. Link Discovery System
(1) Focus on one selected scenario. The analysts would start with suspects’ names (or
profiles) and use the object-oriented association rule mining tools in the link
discovery system (see Figure 2) to evaluate if there is any evidence of linking this
suspect with other suspects or suspicious activities.
(2) Convert suspicious activities of this suspect into a terrorism-intensity profile similar
to the plot in the right side of Figure 1, where the conversion will build on experts’
past experience and empirical evidence.
(3) The intelligence analyst uses “feature selection” techniques guided by the link
discovery system to reduce the size of data and search for “explanatory variables”
describing the reasons why the terrorist’s intensity-curve has sharp changes.
(4) If there are other suspects in the same “group” for planning a specific terrorism
activity (discovered by link analyses), their intensity curves will be tested against
each other to evaluate the probability that these suspects are indeed in the same
group. All information pertinent to this scenario will be collected and organized
through the link discovery system. A risk assessment model will be called to evaluate
the urgency of its potential impact on the nation’s homeland security.
8. (5) If there is a potential high impact of this investigation case, more evidence will be
collected from continuous monitoring (approved by legal departments) of suspects’
daily activities. This new evidence will be added to the intensity measures for
predicting if a high-impact event will occur in the near future. Proper actions will be
suggested to combat this terrorism. s
Example 12 (Data Mining in Bioinformatics and Cancer Research): National
Institute of Health (NIH) supported many data mining research projects in bioinformatics
and computational biology fields. Dr. Lu’s group is extending their research experience
in the above examples to these fields. For example, they are exploring patterns of
association in gene expression, protein and other genomic data linked to disease such as
breast cancer. In most studies the genomic and disease data are transformed into typical
statistical measurements for solving biological and medical research problems. Then,
data mining tools can be used to look for patterns and trends that help understand and
solve the problems. For instance, singular value decomposition and regression methods
are used to study profiles of gene expression for understanding the uncertainties in
classifying breast cancer tumor types (Spang et al., 2002). Clustering analysis is used to
identify regulatory binding sites where genes are transcripted into mRNA (Olman et al.,
2003). Since tremendous amount of data in bioinformatics and cancer research are
available online, system engineering research in these areas could be easier than many
studies in the manufacturing fields where most of data are proprietary. However, the key
challenge is to work with biologists and medical researchers to understand scientific
problems, data insights and significance of knowledge discovered. p
4. Concluding Remarks
This article provides several examples showing that knowledge mining becomes more
important in a wide range of applications. When data collection instruments become
more advanced and people rely more on computer to discover “intelligence,” opportunity
for knowledge mining field to grow is endless. Although many commercial data and text
mining software are available, there is still much room for research and education
activities to expand for advancing data mining techniques and for showing their potential
in several emerging fields such as computation-based biological and medical studies.
Hopefully, with the exposition of this article more ISyE students, faculty members and
alumni would use knowledge mining tools in their studies, research investigations and
business activities.
References:
Arias, E., Donoho, D. L., and Huo, X. (2003), “Asymptotically Optimal Detection of
Geometric Objects by Fast Multiscale Methods.” Submitted manuscript. http://www-
stat.stanford.edu/~donoho/Reports/2003/MultiScaleDetect.pdf.
Besag, J, York J, and Mollie A. (1991), “Bayesian Image Restoration with Two
Applications in Spatial Statistics,” Annals of the Institute of Statistical Mathematics,
43, 1-59.
9. Cressie, N. A. C. (1993). Statistics for Spatial Data (2nd edition). John Wiley: New
York.
Gabowski, H., Lossack and Weibkopf (2001), “Automatic Classification and Creation of
Classification Systems Using Methodologies of ‘Knowledge Discovery in
Databases,” Chapter 5 (pp. 127-144) of Data Mining for Design and Manufacturing:
Methods and Applications edited by D. Braha, Kluwer Academic Publishers: New
York.
Ganesan, R., Das, T. K., Sikdar, A., and Kumar, A. (2003), “Wavelet Based Detection of
Delamination Defect in CMP Using Nonstationary Acoustic Emission Signal,” in
review with IEEE Transactions on Semiconductor Manufacturing, 16(4), to appear.
Huo, X., and Chen, J. (2004), “Building a Cascade Detector and Applications in
Automatic Target Recognition,” Applied Optics: Information Processing, 43(2):
293-303.
Huo, X., Chen, J., Wang, S., and Tsui, K. (2002), “Support Vector Trees: Simultaneously
Realizing the principle of Maximal Margin and Maximal Purity.” Research report
can be obtained in http://www.isye.gatech.edu/research/files/tsui-2002-01.pdf.
Ishino, Y., and Jin, Y. (2001), “Data Mining for Knowledge Acquisition in Engineering
Design,” Chapter 6 (pp. 145-160) of Data Mining for Design and Manufacturing:
Methods and Applications edited by D. Braha, Kluwer Academic Publishers: New
York.
Jeong, M. K., Lu, J. C., Huo, X., Vidakovic, B., and Chen, D. (2004a), “Wavelet-based
Data Reduction Techniques for Process Fault Detection,” accepted by Technometrics.
This paper can be obtained in http://www.isye.gatech.edu/apps/research-papers/.
Jeong, M. K., and Lu, J. C. (2004b), “Statistical Process Control Charts for Complicated
Functional Data.”
Jung, Uk, and Lu, J. C. (2004), “A Wavelet-based Random-effect Model for Multiple
Sets of Complicated Functional Data.” This paper can be obtained in
http://www.isye.gatech.edu/apps/research-papers/.
Kang, L., and Albin, S. L. (2000), “On-Line Monitoring When the Process Yields a
Linear Profile,” Journal of Quality Technology, 32, 418-426.
Kim, H., Lu, J. C., and Kvam, P. (2004), “Product-order Decisions Considering
Uncertainty in Logistics Operations.” This paper can be obtained in
http://www.isye.gatech.edu/apps/research-papers/.
Kongthon, A. (2004). A Text Mining Framework for Discovering Technological
Intelligence to Support Science and Technology Management. Unpublished Ph.D.
Thesis, The School of Industrial and Systems Engineering, Georgia Institute of
Technology, Atlanta, GA, USA.
Lawless, J. F., Mackay, R. J., and Robinson, J. A. (1999), “Analysis of Variation
Transmission in Manufacturing Process-Part,” Journal of Quality Technology, 31,
131-142.
10. Lu, J. C. (2001), “Methodology of Mining Massive Data Set for Improving
Manufacturing Quality/Efficiency,” Chapter 11 (pp. 255-288) of Data Mining for
Design and Manufacturing: Methods and Applications edited by D., Kluwer
Academic Publishers: New York.
Olman, V., Xu, D., and Xu, Y. (2003), “CUBIC: Identification of Regulatory Biding
Sites Through Data Clustering,” Journal of Bioinformatics and Computational
Biology, 1(1), 21-40.
Porter, A. L., Kongthon, A., and Lu, J. C. (2002), “Research Profiling – Improving the
Literature Review: Illustrated for the Case of Data Mining of Large Datasets,”
Scientometrics, 53(3), 351-370.
Schwabacher, M., Ellman and Hirsh (2001), “Learning to Set Up Numerical
Optimizations for Engineering Designs,” Chapter 4 (pp. 87-126) of Data Mining for
Design and Manufacturing: Methods and Applications edited by D. Braha, Kluwer
Academic Publishers: New York.
Spang, R., Zuzan, H., West, M., Nevins, J., Blanchette, C., and Marks, J. R. (2002),
“Prediction and Uncertainty in the Analysis of Gene Expression Profiles,” Silico
Biology, 2, 33-44.