TorontoMLS® residential statistics - Central Toronto
•
0 j'aime•912 vues

TorontoMLS® residential statistics for the Fourth Quarter of 2011 - for Central Toronto

Recommandé
Recommandé
Contenu connexe
Tendances
Tendances (12)
Similaire à TorontoMLS® residential statistics - Central Toronto
Similaire à TorontoMLS® residential statistics - Central Toronto (20)
Plus de Bonnie Byford Real Estate Ltd., Brokerage
Plus de Bonnie Byford Real Estate Ltd., Brokerage (20)
Dernier
Dernier (20)
TorontoMLS® residential statistics - Central Toronto
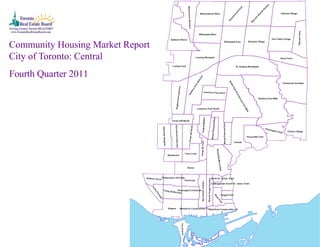
- 1. Community Housing Market Report City of Toronto: Central Fourth Quarter 2011
- 2. Toronto Real Estate Board Toronto C01 Community Breakdown ALL HOME TYPES, FOURTH QUARTER 2011 SUMMARY OF EXISTING HOME TRANSACTIONS TORONTO C01 COMMUNITY BREAKDOWN Sales Dollar Volume Average Price Median Price New Listings Active Listings Avg. SP/LP Avg. DOM Toronto C01 1,049 $465,256,480 $443,524 $385,850 1,594 819 99% 27 Dufferin Grove 32 $14,621,653 $456,927 $375,000 30 4 100% 24 Palmerston-Little Italy 32 $24,846,708 $776,460 $716,000 39 10 101% 15 University 8 $5,379,352 $672,419 $724,400 21 6 102% 17 Bay Street Corridor 124 $61,144,900 $493,104 $421,450 185 111 99% 26 Kensington-Chinatown 34 $14,444,650 $424,843 $363,500 40 17 99% 34 Trinity-Bellwoods 46 $28,752,145 $625,047 $598,500 63 23 101% 20 Little Portugal 20 $10,657,100 $532,855 $505,050 51 20 103% 19 Niagara 277 $110,047,657 $397,284 $364,000 407 169 99% 26 Waterfront Communities C1 476 $195,362,315 $410,425 $370,000 758 459 98% 30 The Islands 0 - - - 0 0 - - *The source for all slides is the Toronto Real Estate Board. Some statistics are not reported when the number of transactions is two (2) or less. Statistics are updated on a monthly basis. Quarterly community statistics in this report may not match quarterly sums calculated from past TREB publications. Fourth Quarter 2011 1
- 3. Toronto Real Estate Board Toronto C01: Dufferin Grove Average Selling Price Number of Transactions* Average/Median Selling Price (,000s)* Median Selling Price 11 10 $709 $663 8 $370 $375 $296 $312 2 1 0 Number of New Listings* Sales-to-New Listings Ratio* 11 125% 8 8 100% 100% 67% 3 0 0 0% 0% Average Days on Market* Average Sale Price to List Price Ratio* 31 101% 99% 100% 23 20 *The source for all slides is the Toronto Real Estate Board. Some statistics are not reported when the number of transactions is two (2) or less. Statistics are updated on a monthly basis. Quarterly community statistics in this report may not match quarterly sums calculated from past TREB publications. Fourth Quarter 2011 2
- 4. Toronto Real Estate Board Toronto C01: Palmerston-Little Italy Average Selling Price Number of Transactions* Average/Median Selling Price (,000s)* Median Selling Price 16 $809 $845 $841 $761 $765 $657 $464 $453 7 5 4 0 0 Number of New Listings* Sales-to-New Listings Ratio* 15 107% 88% 9 71% 8 7 44% 0 0 0% 0% Average Days on Market* Average Sale Price to List Price Ratio* 18 18 99% 102% 102% 102% 16 14 *The source for all slides is the Toronto Real Estate Board. Some statistics are not reported when the number of transactions is two (2) or less. Statistics are updated on a monthly basis. Quarterly community statistics in this report may not match quarterly sums calculated from past TREB publications. Fourth Quarter 2011 3
- 5. Toronto Real Estate Board Toronto C01: University Average Selling Price Number of Transactions* Average/Median Selling Price (,000s)* Median Selling Price 4 $818 $840 3 $583 $564 1 0 0 0 Number of New Listings* Sales-to-New Listings Ratio* 6 75% 80% 5 4 4 1 1 17% 0% 0% 0% Average Days on Market* Average Sale Price to List Price Ratio* 107% 21 99% 18 *The source for all slides is the Toronto Real Estate Board. Some statistics are not reported when the number of transactions is two (2) or less. Statistics are updated on a monthly basis. Quarterly community statistics in this report may not match quarterly sums calculated from past TREB publications. Fourth Quarter 2011 4
- 6. Toronto Real Estate Board Toronto C01: Bay Street Corridor Average Selling Price Number of Transactions* Average/Median Selling Price (,000s)* Median Selling Price 122 $465 $420 0 0 0 2 0 Number of New Listings* Sales-to-New Listings Ratio* 183 100% 67% 0 0 0 2 0 0% 0% 0% 0% Average Days on Market* Average Sale Price to List Price Ratio* 26 99% *The source for all slides is the Toronto Real Estate Board. Some statistics are not reported when the number of transactions is two (2) or less. Statistics are updated on a monthly basis. Quarterly community statistics in this report may not match quarterly sums calculated from past TREB publications. Fourth Quarter 2011 5
- 7. Toronto Real Estate Board Toronto C01: Kensington-Chinatown Average Selling Price Number of Transactions* Average/Median Selling Price (,000s)* Median Selling Price 25 $999 $902 $429 $381 $367 $345 6 3 0 0 0 Number of New Listings* Sales-to-New Listings Ratio* 33 300% 150% 76% 2 3 2 0 0 0% 0% 0% Average Days on Market* Average Sale Price to List Price Ratio* 37 104% 98% 34 97% 10 *The source for all slides is the Toronto Real Estate Board. Some statistics are not reported when the number of transactions is two (2) or less. Statistics are updated on a monthly basis. Quarterly community statistics in this report may not match quarterly sums calculated from past TREB publications. Fourth Quarter 2011 6
- 8. Toronto Real Estate Board Toronto C01: Trinity-Bellwoods Average Selling Price Number of Transactions* Average/Median Selling Price (,000s)* Median Selling Price 16 14 $870 $766 $720 $682 $711 $667 9 $581 $578 $497 $477 4 3 0 Number of New Listings* Sales-to-New Listings Ratio* 150% 24 17 94% 75% 12 58% 8 50% 2 0 0% Average Days on Market* Average Sale Price to List Price Ratio* 102% 102% 99% 100% 100% 23 24 22 19 12 *The source for all slides is the Toronto Real Estate Board. Some statistics are not reported when the number of transactions is two (2) or less. Statistics are updated on a monthly basis. Quarterly community statistics in this report may not match quarterly sums calculated from past TREB publications. Fourth Quarter 2011 7
- 9. Toronto Real Estate Board Toronto C01: Little Portugal Average Selling Price Number of Transactions* Average/Median Selling Price (,000s)* Median Selling Price 10 $541 $537 $523 $461 5 2 2 1 0 Number of New Listings* Sales-to-New Listings Ratio* 25 100% 91% 63% 11 8 33% 6 1 8% 0 0% Average Days on Market* Average Sale Price to List Price Ratio* 18 105% 103% 5 *The source for all slides is the Toronto Real Estate Board. Some statistics are not reported when the number of transactions is two (2) or less. Statistics are updated on a monthly basis. Quarterly community statistics in this report may not match quarterly sums calculated from past TREB publications. Fourth Quarter 2011 8
- 10. Toronto Real Estate Board Toronto C01: Niagara Average Selling Price Number of Transactions* Average/Median Selling Price (,000s)* Median Selling Price 235 $496 $505 $404 $394 $369 $358 38 0 0 4 0 Number of New Listings* Sales-to-New Listings Ratio* 360 97% 65% 50% 39 0 0 8 0 0% 0% 0% Average Days on Market* Average Sale Price to List Price Ratio* 26 102% 99% 99% 23 11 *The source for all slides is the Toronto Real Estate Board. Some statistics are not reported when the number of transactions is two (2) or less. Statistics are updated on a monthly basis. Quarterly community statistics in this report may not match quarterly sums calculated from past TREB publications. Fourth Quarter 2011 9
- 11. Toronto Real Estate Board Toronto C01: Waterfront Communities C1 Average Selling Price Number of Transactions* Average/Median Selling Price (,000s)* Median Selling Price 469 $560 $481 $409 $370 0 0 2 5 0 Number of New Listings* Sales-to-New Listings Ratio* 751 200% 125% 62% 0 1 1 4 1 0% 0% 0% Average Days on Market* Average Sale Price to List Price Ratio* 30 98% 98% 18 *The source for all slides is the Toronto Real Estate Board. Some statistics are not reported when the number of transactions is two (2) or less. Statistics are updated on a monthly basis. Quarterly community statistics in this report may not match quarterly sums calculated from past TREB publications. Fourth Quarter 2011 10
- 12. Toronto Real Estate Board Toronto C01: The Islands Average Selling Price Number of Transactions* Average/Median Selling Price (,000s)* Median Selling Price 0 0 0 0 0 0 Number of New Listings* Sales-to-New Listings Ratio* 0 0 0 0 0 0 0% 0% 0% 0% 0% 0% Average Days on Market* Average Sale Price to List Price Ratio* *The source for all slides is the Toronto Real Estate Board. Some statistics are not reported when the number of transactions is two (2) or less. Statistics are updated on a monthly basis. Quarterly community statistics in this report may not match quarterly sums calculated from past TREB publications. Fourth Quarter 2011 11
- 13. Toronto Real Estate Board Toronto C02 Community Breakdown ALL HOME TYPES, FOURTH QUARTER 2011 SUMMARY OF EXISTING HOME TRANSACTIONS TORONTO C02 COMMUNITY BREAKDOWN Sales Dollar Volume Average Price Median Price New Listings Active Listings Avg. SP/LP Avg. DOM Toronto C02 186 $189,904,136 $1,020,990 $743,750 295 166 98% 28 Yonge-St. Clair 44 $41,339,100 $939,525 $853,000 55 12 100% 18 Casa Loma 27 $31,301,400 $1,159,311 $1,100,000 61 48 96% 40 Wychwood 24 $13,546,100 $564,421 $567,500 30 8 103% 27 Annex 91 $103,717,536 $1,139,753 $884,000 149 98 98% 30 *The source for all slides is the Toronto Real Estate Board. Some statistics are not reported when the number of transactions is two (2) or less. Statistics are updated on a monthly basis. Quarterly community statistics in this report may not match quarterly sums calculated from past TREB publications. Fourth Quarter 2011 12
- 14. Toronto Real Estate Board Toronto C02: Yonge-St. Clair Average Selling Price Number of Transactions* Average/Median Selling Price (,000s)* Median Selling Price 25 $1,554 $1,420 $1,091 $1,060 10 $646 $650 6 2 1 0 Number of New Listings* Sales-to-New Listings Ratio* 35 200% 12 83% 71% 67% 50% 3 3 2 0 0% Average Days on Market* Average Sale Price to List Price Ratio* 22 101% 101% 98% 20 11 *The source for all slides is the Toronto Real Estate Board. Some statistics are not reported when the number of transactions is two (2) or less. Statistics are updated on a monthly basis. Quarterly community statistics in this report may not match quarterly sums calculated from past TREB publications. Fourth Quarter 2011 13
- 15. Toronto Real Estate Board Toronto C02: Casa Loma Average Selling Price Number of Transactions* Average/Median Selling Price (,000s)* Median Selling Price 12 $1,916 $1,697 8 $1,225 $1,190 $824 3 $598 2 2 0 Number of New Listings* Sales-to-New Listings Ratio* 36 150% 100% 15 53% 40% 33% 5 2 1 2 0% Average Days on Market* Average Sale Price to List Price Ratio* 54 95% 99% 97% 49 19 *The source for all slides is the Toronto Real Estate Board. Some statistics are not reported when the number of transactions is two (2) or less. Statistics are updated on a monthly basis. Quarterly community statistics in this report may not match quarterly sums calculated from past TREB publications. Fourth Quarter 2011 14
- 16. Toronto Real Estate Board Toronto C02: Wychwood Average Selling Price Number of Transactions* Average/Median Selling Price (,000s)* Median Selling Price 13 $646 $606 $581 $560 8 2 1 0 0 Number of New Listings* Sales-to-New Listings Ratio* 17 200% 11 100% 73% 76% 1 0 0 1 0% 0% Average Days on Market* Average Sale Price to List Price Ratio* 44 102% 104% 9 *The source for all slides is the Toronto Real Estate Board. Some statistics are not reported when the number of transactions is two (2) or less. Statistics are updated on a monthly basis. Quarterly community statistics in this report may not match quarterly sums calculated from past TREB publications. Fourth Quarter 2011 15
- 17. Toronto Real Estate Board Toronto C02: Annex Average Selling Price Number of Transactions* Average/Median Selling Price (,000s)* Median Selling Price 47 $1,456 $1,458 $1,271 $1,095 $1,095 $949 $858 $805 20 $738 $665 10 11 3 0 Number of New Listings* Sales-to-New Listings Ratio* 102 154% 138% 71% 46% 14 30% 13 8 10 2 0% Average Days on Market* Average Sale Price to List Price Ratio* 45 99% 99% 101% 98% 96% 33 31 27 19 *The source for all slides is the Toronto Real Estate Board. Some statistics are not reported when the number of transactions is two (2) or less. Statistics are updated on a monthly basis. Quarterly community statistics in this report may not match quarterly sums calculated from past TREB publications. Fourth Quarter 2011 16
- 18. Toronto Real Estate Board Toronto C03 Community Breakdown ALL HOME TYPES, FOURTH QUARTER 2011 SUMMARY OF EXISTING HOME TRANSACTIONS TORONTO C03 COMMUNITY BREAKDOWN Sales Dollar Volume Average Price Median Price New Listings Active Listings Avg. SP/LP Avg. DOM Toronto C03 127 $107,256,457 $844,539 $530,000 185 89 99% 27 Humewood-Cedarvale 23 $16,465,169 $715,877 $714,000 27 4 105% 16 Oakwood-Vaughan 44 $19,976,201 $454,005 $436,600 68 30 99% 27 Forest Hill South 45 $58,601,787 $1,302,262 $661,000 70 50 96% 34 Yonge-Eglinton 15 $12,213,300 $814,220 $718,800 20 5 102% 22 *The source for all slides is the Toronto Real Estate Board. Some statistics are not reported when the number of transactions is two (2) or less. Statistics are updated on a monthly basis. Quarterly community statistics in this report may not match quarterly sums calculated from past TREB publications. Fourth Quarter 2011 17
- 19. Toronto Real Estate Board Toronto C03: Humewood-Cedarvale Average Selling Price Number of Transactions* Average/Median Selling Price (,000s)* Median Selling Price 12 $917 $854 8 $582 $546 2 1 0 0 Number of New Listings* Sales-to-New Listings Ratio* 15 200% 9 80% 89% 50% 2 1 0 0 0% 0% Average Days on Market* Average Sale Price to List Price Ratio* 18 104% 108% 16 *The source for all slides is the Toronto Real Estate Board. Some statistics are not reported when the number of transactions is two (2) or less. Statistics are updated on a monthly basis. Quarterly community statistics in this report may not match quarterly sums calculated from past TREB publications. Fourth Quarter 2011 18
- 20. Toronto Real Estate Board Toronto C03: Oakwood-Vaughan Average Selling Price Number of Transactions* Average/Median Selling Price (,000s)* Median Selling Price 31 $470 $448 $415 $407 13 0 0 0 0 Number of New Listings* Sales-to-New Listings Ratio* 46 67% 59% 22 0 0 0 0 0% 0% 0% 0% Average Days on Market* Average Sale Price to List Price Ratio* 30 98% 102% 20 *The source for all slides is the Toronto Real Estate Board. Some statistics are not reported when the number of transactions is two (2) or less. Statistics are updated on a monthly basis. Quarterly community statistics in this report may not match quarterly sums calculated from past TREB publications. Fourth Quarter 2011 19
- 21. Toronto Real Estate Board Toronto C03: Forest Hill South Average Selling Price Number of Transactions* Average/Median Selling Price (,000s)* Median Selling Price 22 $2,352 19 $1,885 $518 $444 3 $316 $321 1 0 0 Number of New Listings* Sales-to-New Listings Ratio* 32 32 100% 69% 59% 60% 5 1 0 0 0% 0% Average Days on Market* Average Sale Price to List Price Ratio* 45 96% 98% 99% 39 26 *The source for all slides is the Toronto Real Estate Board. Some statistics are not reported when the number of transactions is two (2) or less. Statistics are updated on a monthly basis. Quarterly community statistics in this report may not match quarterly sums calculated from past TREB publications. Fourth Quarter 2011 20
- 22. Toronto Real Estate Board Toronto C03: Yonge-Eglinton Average Selling Price Number of Transactions* Average/Median Selling Price (,000s)* Median Selling Price 6 $1,084 5 $971 $687 $715 2 2 0 0 Number of New Listings* Sales-to-New Listings Ratio* 12 200% 200% 6 83% 50% 1 1 0 0 0% 0% Average Days on Market* Average Sale Price to List Price Ratio* 100% 106% 12 10 *The source for all slides is the Toronto Real Estate Board. Some statistics are not reported when the number of transactions is two (2) or less. Statistics are updated on a monthly basis. Quarterly community statistics in this report may not match quarterly sums calculated from past TREB publications. Fourth Quarter 2011 21
- 23. Toronto Real Estate Board Toronto C04 Community Breakdown ALL HOME TYPES, FOURTH QUARTER 2011 SUMMARY OF EXISTING HOME TRANSACTIONS TORONTO C04 COMMUNITY BREAKDOWN Sales Dollar Volume Average Price Median Price New Listings Active Listings Avg. SP/LP Avg. DOM Toronto C04 224 $238,443,692 $1,064,481 $967,500 350 143 100% 24 Englemount-Lawrence 32 $19,826,300 $619,572 $521,000 57 32 96% 32 Bedford Park-Nortown 75 $90,984,797 $1,213,131 $1,215,000 143 72 98% 28 Lawrence Park North 61 $60,347,715 $989,307 $881,000 72 7 103% 14 Lawrence Park South 39 $55,024,980 $1,410,897 $1,360,000 54 18 99% 22 Forest Hill North 17 $12,259,900 $721,171 $601,000 24 14 101% 30 *The source for all slides is the Toronto Real Estate Board. Some statistics are not reported when the number of transactions is two (2) or less. Statistics are updated on a monthly basis. Quarterly community statistics in this report may not match quarterly sums calculated from past TREB publications. Fourth Quarter 2011 22
- 24. Toronto Real Estate Board Toronto C04: Englemount-Lawrence Average Selling Price Number of Transactions* Average/Median Selling Price (,000s)* Median Selling Price 18 $837 $683 12 $351 $345 0 1 0 1 Number of New Listings* Sales-to-New Listings Ratio* 31 58% 55% 50% 50% 22 2 2 0 0 0% 0% Average Days on Market* Average Sale Price to List Price Ratio* 33 96% 96% 25 *The source for all slides is the Toronto Real Estate Board. Some statistics are not reported when the number of transactions is two (2) or less. Statistics are updated on a monthly basis. Quarterly community statistics in this report may not match quarterly sums calculated from past TREB publications. Fourth Quarter 2011 23
- 25. Toronto Real Estate Board Toronto C04: Bedford Park-Nortown Average Selling Price Number of Transactions* Average/Median Selling Price (,000s)* Median Selling Price 64 $1,334 $1,261 $512 $435 11 0 0 0 0 Number of New Listings* Sales-to-New Listings Ratio* 112 57% 41% 27 1 1 2 0 0% 0% 0% 0% Average Days on Market* Average Sale Price to List Price Ratio* 28 28 98% 99% *The source for all slides is the Toronto Real Estate Board. Some statistics are not reported when the number of transactions is two (2) or less. Statistics are updated on a monthly basis. Quarterly community statistics in this report may not match quarterly sums calculated from past TREB publications. Fourth Quarter 2011 24
- 26. Toronto Real Estate Board Toronto C04: Lawrence Park North Average Selling Price Number of Transactions* Average/Median Selling Price (,000s)* Median Selling Price 46 $1,052 $919 $940 $707 $712 $500 10 4 0 1 0 Number of New Listings* Sales-to-New Listings Ratio* 54 100% 100% 85% 77% 13 1 4 0 0 0% 0% Average Days on Market* Average Sale Price to List Price Ratio* 104% 104% 99% 22 15 7 *The source for all slides is the Toronto Real Estate Board. Some statistics are not reported when the number of transactions is two (2) or less. Statistics are updated on a monthly basis. Quarterly community statistics in this report may not match quarterly sums calculated from past TREB publications. Fourth Quarter 2011 25
- 27. Toronto Real Estate Board Toronto C04: Lawrence Park South Average Selling Price Number of Transactions* Average/Median Selling Price (,000s)* Median Selling Price 31 $1,592 $1,405 $623 $610 7 1 0 0 0 Number of New Listings* Sales-to-New Listings Ratio* 41 76% 58% 12 0 1 0 0 0% 0% 0% 0% Average Days on Market* Average Sale Price to List Price Ratio* 42 99% 99% 15 *The source for all slides is the Toronto Real Estate Board. Some statistics are not reported when the number of transactions is two (2) or less. Statistics are updated on a monthly basis. Quarterly community statistics in this report may not match quarterly sums calculated from past TREB publications. Fourth Quarter 2011 26
- 28. Toronto Real Estate Board Toronto C04: Forest Hill North Average Selling Price Number of Transactions* Average/Median Selling Price (,000s)* Median Selling Price 8 $1,241 $1,250 7 1 1 $202 $192 0 0 Number of New Listings* Sales-to-New Listings Ratio* 14 100% 100% 88% 8 57% 1 1 0 0 0% 0% Average Days on Market* Average Sale Price to List Price Ratio* 40 102% 98% 24 *The source for all slides is the Toronto Real Estate Board. Some statistics are not reported when the number of transactions is two (2) or less. Statistics are updated on a monthly basis. Quarterly community statistics in this report may not match quarterly sums calculated from past TREB publications. Fourth Quarter 2011 27
- 29. Toronto Real Estate Board Toronto C06 Community Breakdown ALL HOME TYPES, FOURTH QUARTER 2011 SUMMARY OF EXISTING HOME TRANSACTIONS TORONTO C06 COMMUNITY BREAKDOWN Sales Dollar Volume Average Price Median Price New Listings Active Listings Avg. SP/LP Avg. DOM Toronto C06 59 $36,642,850 $621,065 $568,000 89 49 99% 31 Bathurst Manor 24 $13,665,070 $569,378 $575,000 43 21 99% 26 Clanton Park 35 $22,977,780 $656,508 $557,000 46 28 98% 35 *The source for all slides is the Toronto Real Estate Board. Some statistics are not reported when the number of transactions is two (2) or less. Statistics are updated on a monthly basis. Quarterly community statistics in this report may not match quarterly sums calculated from past TREB publications. Fourth Quarter 2011 28
- 30. Toronto Real Estate Board Toronto C06: Bathurst Manor Average Selling Price Number of Transactions* Average/Median Selling Price (,000s)* Median Selling Price 16 $691 $625 7 $319 $325 0 0 1 0 Number of New Listings* Sales-to-New Listings Ratio* 28 57% 47% 15 0 0 0 0 0% 0% 0% 0% Average Days on Market* Average Sale Price to List Price Ratio* 36 99% 98% 20 *The source for all slides is the Toronto Real Estate Board. Some statistics are not reported when the number of transactions is two (2) or less. Statistics are updated on a monthly basis. Quarterly community statistics in this report may not match quarterly sums calculated from past TREB publications. Fourth Quarter 2011 29
- 31. Toronto Real Estate Board Toronto C06: Clanton Park Average Selling Price Number of Transactions* Average/Median Selling Price (,000s)* Median Selling Price 20 $889 $721 15 $347 $336 0 0 0 0 Number of New Listings* Sales-to-New Listings Ratio* 29 88% 69% 17 0 0 0 0 0% 0% 0% 0% Average Days on Market* Average Sale Price to List Price Ratio* 46 98% 99% 26 *The source for all slides is the Toronto Real Estate Board. Some statistics are not reported when the number of transactions is two (2) or less. Statistics are updated on a monthly basis. Quarterly community statistics in this report may not match quarterly sums calculated from past TREB publications. Fourth Quarter 2011 30
- 32. Toronto Real Estate Board Toronto C07 Community Breakdown ALL HOME TYPES, FOURTH QUARTER 2011 SUMMARY OF EXISTING HOME TRANSACTIONS TORONTO C07 COMMUNITY BREAKDOWN Sales Dollar Volume Average Price Median Price New Listings Active Listings Avg. SP/LP Avg. DOM Toronto C07 268 $138,557,456 $517,005 $394,500 383 152 99% 24 Westminster-Branson 57 $20,829,600 $365,432 $309,000 71 23 97% 23 Newtonbrook West 80 $45,614,379 $570,180 $570,000 111 52 99% 22 Willowdale West 79 $38,244,500 $484,108 $374,000 125 45 99% 27 Lansing-Westgate 52 $33,868,977 $651,326 $649,900 76 32 100% 21 *The source for all slides is the Toronto Real Estate Board. Some statistics are not reported when the number of transactions is two (2) or less. Statistics are updated on a monthly basis. Quarterly community statistics in this report may not match quarterly sums calculated from past TREB publications. Fourth Quarter 2011 31
- 33. Toronto Real Estate Board Toronto C07: Westminster-Branson Average Selling Price Number of Transactions* Average/Median Selling Price (,000s)* Median Selling Price 34 $709 $710 $465 $472 $353 $363 $264 $271 9 9 4 1 0 Number of New Listings* Sales-to-New Listings Ratio* 45 100% 90% 90% 80% 76% 10 10 5 1 0 0% Average Days on Market* Average Sale Price to List Price Ratio* 26 27 97% 98% 98% 97% 22 17 *The source for all slides is the Toronto Real Estate Board. Some statistics are not reported when the number of transactions is two (2) or less. Statistics are updated on a monthly basis. Quarterly community statistics in this report may not match quarterly sums calculated from past TREB publications. Fourth Quarter 2011 32