Monthly Coffee Market Report - September 2013 (Relatório do Mercado de café mensal - setembro 2013)
•
1 j'aime•771 vues

Monthly Coffee Market Report - September 2013 (Relatório do Mercado de café mensal - setembro 2013)

Recommandé
Recommandé
Contenu connexe
Plus de Revista Cafeicultura
Plus de Revista Cafeicultura (20)
Dernier
Dernier (20)
Monthly Coffee Market Report - September 2013 (Relatório do Mercado de café mensal - setembro 2013)
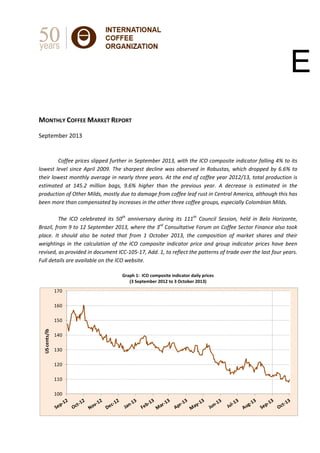
- 1. MONTHLY COFFEE MARKET REPORT September 2013 Coffee prices slipped further in September 2013, with the ICO composite indicator falling 4% to its lowest level since April 2009. The sharpest decline was observed in Robustas, which dropped by 6.6% to their lowest monthly average in nearly three years. At the end of coffee year 2012/13, total production is estimated at 145.2 million bags, 9.6% higher than the previous year. A decrease is estimated in the production of Other Milds, mostly due to damage from coffee leaf rust in Central America, although this has been more than compensated by increases in the other three coffee groups, especially Colombian Milds. The ICO celebrated its 50th anniversary during its 111th Council Session, held in Belo Horizonte, Brazil, from 9 to 12 September 2013, where the 3rd Consultative Forum on Coffee Sector Finance also took place. It should also be noted that from 1 October 2013, the composition of market shares and their weightings in the calculation of the ICO composite indicator price and group indicator prices have been revised, as provided in document ICC‐105‐17, Add. 1, to reflect the patterns of trade over the last four years. Full details are available on the ICO website. Graph 1: ICO composite indicator daily prices (3 September 2012 to 3 October 2013) 100 110 120 130 140 150 160 170 US cents/lb E
- 2. 2 Monthly Coffee Market Report – September 2013 Price movements Coffee prices fell across the board in September, with the monthly average of the ICO composite indicator dropping 4% to 111.82 US cents/lb, its lowest level since April 2009. The most significant decline was recorded in Robustas, which fell by 6.6% to 87.78 US cents/lb, their lowest average since October 2010. Colombian Milds, Other Milds and Brazilian Naturals all fell by 3.2%, 2.1% and 3.6%, respectively (Graph 2). As a result, the arbitrage between New York and London widened considerably over the course of the month, now standing at around the same level as September 2008 (Graph 3). Graph 2: ICO group indicator daily prices (3 September 2012 to 3 October 2013) Graph 3: Arbitrage between New York and London futures markets (Monthly: September 2003 to September 2013) Market fundamentals Crop year 2012/13 has now finished in all exporting countries. On the basis of information currently available, total production is estimated at 145.2 million bags (all figures for 2012/13 are estimates). This is 12.8 million bags more than 2011/12, representing a 9.6% increase. Robustas jumped by 11.6% to 56.4 million bags, while Arabicas provisionally registered an 8.4% increase to reach 88.8 million bags. Graph 4 shows total production by all exporting countries since 2002/03. Graph 4: Total production by all exporting countries (Crop years 2002/03 to 2012/13*) *Estimated 80 100 120 140 160 180 200 220 US cents/lb Colombian Milds Other Milds Brazilian Naturals Robustas 0 20 40 60 80 100 120 140 160 180 200 US cents/lb 41.1 42.6 39.8 42.1 47.5 45.9 49.7 50.1 49.1 50.6 56.4 81.9 63.5 76.2 69.0 80.7 73.8 78.9 72.9 84.2 81.9 88.8 123.0 106.1 116.0 111.0 128.3 119.8 128.6 122.9 133.4 132.5 145.2 0 20 40 60 80 100 120 140 160 Million bags Robusta Arabica
- 3. Monthly Coffee Market Report – September 2013 3 Crop year 2012/13 was an on year in the Brazilian cycle of production, which increased by 16.9% to 50.83 million bags. Arabica production in Brazil increased by 19.1% to 38.34 million bags and Robustas by 10.5% to 12.48 million. According to CONAB, the Brazilian Government Agency responsible for crop forecasts, total production in 2013/14 will fall by 6.5% to 47.54 million bags, comprising 36.67 million bags of Arabica and 10.88 million of Robusta. Elsewhere in South America, Colombia is continuing its recovery following four years of below‐average production, with a total crop in 2012/13 estimated at 10 million bags, 30.7% higher than the previous year. Production in Peru, however, fell by 17.2% to 4.5 million bags, with coffee leaf rust reportedly affecting up to 40% of the coffee area. Damage from coffee leaf rust has also been a significant factor in Mexico and Central America, with total production in the region down 14.7% from 20.3 million bags in 2011/12 to an estimated 17.3 million in 2012/13. The biggest decline is provisionally expected in Nicaragua, down 39.3%, followed by Guatemala (‐18.2%), Honduras (‐17%) and Mexico (‐14.5%). However, higher production is estimated in Costa Rica (+14.5%) and El Salvador (+7.9%). In Asia and Oceania, total coffee production for 2012/13 is estimated at 42.3 million bags, an 11.3% increase on 2011/12. Production in Vietnam is expected to maintain a level of around 22 million bags. In Indonesia, on the other hand, production has soared by 74.7% to 12.7 million bags, compared to 7.3 million in 2011/12. Production in India is relatively unchanged, up from 5.2 to 5.3 million bags, but decreases are expected in Papua New Guinea (‐49.3%) and Thailand (‐39.9%). Coffee production in Africa in 2012/13 increased in the majority of countries, with total production in the region up 16.6% to reach some 18.4 million bags, its highest level since 1999/2000. The region’s leading producer is Ethiopia, which increased by 19.1% in 2012/13 to 8.1 million bags. Uganda accounted for 3.2 million bags, up 13.6% on the previous year. Production in Côte d'Ivoire reached 2 million bags, up 6.1%, and Tanzania more than doubled from 534,000 bags in 2011/12 to 1.1 million in 2012/13. Graph 5 shows production in selected African countries in crop years 2011/12 and 2012/13. Full production data are available in Table 3. Graph 5: Production in selected African countries (Crop years 2011/12 and 2012/13*) *Estimated Total exports in August 2013 were 8.6 million bags, 6.4% lower than August 2012. This decrease was mostly attributable to lower shipments of Washed Arabicas from Central America, as well as a slight drop in exports of Robustas. However, total exports for the first eleven months of coffee year 2012/13 (October to August) were 2.7% higher than the same period last year at 102.4 million bags. Certified stocks at the end of September 2013 fell to 1.25 million bags on the London futures market, less than a fifth of their level two years ago. New York certified stocks were relatively unchanged at 3.13 million bags. Finally, world consumption in calendar year 2012 is maintained at 142 million bags, representing an average annual growth rate of 2.4% over the last four years. +19% +14% +6% +108% +3% +11% 0 2 4 6 8 10 Million bags 2011/12 2012/13*
- 4. 4 Monthly Coffee Market Report – September 2013 Table 1: ICO indicator prices and futures prices (US cents/lb) * Average price for 2 nd and 3 rd positions Table 2: Price differentials (US cents/lb) * Average price for 2 nd and 3 rd positions ICO Composite Colombian Milds Other Milds Brazilian Naturals Robustas New York* London* Monthly averages Sep‐12 151.28 190.10 178.98 166.53 104.95 175.36 94.65 Oct‐12 147.12 181.39 173.32 161.20 104.47 170.43 94.66 Nov‐12 136.35 170.08 159.91 148.25 97.67 155.72 87.32 Dec‐12 131.31 164.40 152.74 140.69 96.59 149.58 85.94 Jan‐13 135.38 169.19 157.29 145.17 99.69 154.28 88.85 Feb‐13 131.51 161.70 149.46 136.63 104.03 144.89 94.41 Mar‐13 131.38 161.53 149.78 133.61 106.26 141.43 97.22 Apr‐13 129.55 161.76 149.81 132.62 101.68 139.91 93.15 May‐13 126.96 158.35 147.19 130.29 99.18 138.64 91.07 Jun‐13 117.58 147.55 138.26 120.01 90.79 126.37 81.82 Jul‐13 118.93 147.46 138.39 119.47 95.21 125.27 85.34 Aug‐13 116.45 143.26 135.15 116.81 94.01 122.31 84.10 Sep‐13 111.82 138.60 132.28 112.65 87.78 119.55 77.89 % change between Sep‐13 and Aug‐13 ‐4.0 ‐3.2 ‐2.1 ‐3.6 ‐6.6 ‐2.3 ‐7.4 Annual averages 2008 124.25 144.32 139.78 126.59 105.28 136.46 97.17 2009 115.67 177.43 143.84 115.33 74.58 128.40 67.69 2010 147.24 225.46 195.96 153.68 78.74 165.20 71.98 2011 210.39 283.84 271.07 247.61 109.21 256.36 101.23 2012 156.34 202.08 186.47 174.97 102.82 179.22 91.87 % change between Sep‐13 and 2012 average ‐28.5 ‐31.4 ‐29.1 ‐35.6 ‐14.6 ‐33.3 ‐15.2 Volatility (%) Aug‐13 6.0 6.3 6.0 7.6 5.1 6.9 5.3 Sep‐13 5.2 5.1 5.3 6.0 5.0 7.2 6.2 Variation between Sep‐13 and Aug‐13 ‐0.7 ‐1.2 ‐0.7 ‐1.6 ‐0.2 0.3 0.9 Colombian Milds Other Milds Colombian Milds Brazilian Naturals Colombian Milds Robustas Other Milds Brazilian Naturals Other Milds Robustas Brazilian Naturals Robustas New York* London* Sep‐12 11.12 23.57 85.15 12.45 74.03 61.58 80.71 Oct‐12 8.07 20.19 76.92 12.12 68.85 56.73 75.77 Nov‐12 10.17 21.83 72.41 11.66 62.24 50.58 68.40 Dec‐12 11.66 23.71 67.81 12.05 56.15 44.10 63.64 Jan‐13 11.90 24.02 69.50 12.12 57.60 45.48 65.43 Feb‐13 12.24 25.07 57.67 12.83 45.43 32.60 50.48 Mar‐13 11.75 27.92 55.27 16.17 43.52 27.35 44.21 Apr‐13 11.95 29.14 60.08 17.19 48.13 30.94 46.76 May‐13 11.16 28.06 59.17 16.90 48.01 31.11 47.57 Jun‐13 9.29 27.54 56.76 18.25 47.47 29.22 44.55 Jul‐13 9.07 27.99 52.25 18.92 43.18 24.26 39.93 Aug‐13 8.11 26.45 49.25 18.34 41.14 22.80 38.21 Sep‐13 6.32 25.95 50.82 19.63 44.50 24.87 41.66 % change between Sep‐13 and Aug‐13 ‐22.1 ‐1.9 3.2 7.0 8.2 9.1 9.0
- 5. Monthly Coffee Market Report – September 2013 5 Table 3: Total production in exporting countries In thousand bags * Estimated Crop year commencing 2009 2010 2011 2012* % change 2011‐12 TOTAL 122 941 133 358 132 483 145 241 9.6 Colombian Milds 9 160 9 722 8 705 11 488 32.0 Other Milds 26 526 28 873 32 082 28 276 ‐11.9 Brazilian Naturals 37 194 45 627 41 120 49 050 19.3 Robustas 50 061 49 135 50 576 56 427 11.6 Arabicas 72 879 84 223 81 907 88 814 8.4 Robustas 50 061 49 135 50 576 56 427 11.6 Africa 16 000 16 123 15 771 18 384 16.6 Cameroon 902 503 574 635 10.7 Côte d'Ivoire 1 795 982 1 886 2 000 6.1 Ethiopia 6 931 7 500 6 798 8 100 19.1 Kenya 630 658 747 767 2.7 Tanzania 675 846 534 1 109 107.6 Uganda 2 845 3 203 2 817 3 200 13.6 Others 2 222 2 429 2 414 2 572 6.5 Arabicas 9 153 10 142 9 068 11 062 22.0 Robustas 6 847 5 981 6 703 7 322 9.2 Asia & Oceania 37 211 36 321 38 012 42 300 11.3 India 4 794 5 033 5 233 5 303 1.3 Indonesia 11 380 9 129 7 287 12 730 74.7 Papua New Guinea 1 038 870 1 414 717 ‐49.3 Thailand 795 828 831 499 ‐39.9 Vietnam 17 825 19 467 22 289 22 000 ‐1.3 Others 1 379 994 959 1 050 9.5 Arabicas 5 185 5 315 6 087 6 398 5.1 Robustas 32 026 31 006 31 926 35 901 12.5 Mexico & Central America 16 685 18 021 20 298 17 312 ‐14.7 Costa Rica 1 304 1 392 1 462 1 674 14.5 El Salvador 1 065 1 814 1 152 1 242 7.9 Guatemala 3 835 3 950 3 840 3 143 ‐18.2 Honduras 3 603 4 331 5 903 4 900 ‐17.0 Mexico 4 109 4 001 4 563 3 900 ‐14.5 Nicaragua 1 871 1 634 2 210 1 342 ‐39.3 Others 899 899 1 168 1 111 ‐4.9 Arabicas 16 553 17 835 20 062 17 134 ‐14.6 Robustas 132 187 236 178 ‐24.6 South America 53 045 62 893 58 403 67 246 15.1 Brazil 39 470 48 095 43 484 50 826 16.9 Colombia 8 098 8 523 7 653 10 000 30.7 Ecuador 813 854 825 828 0.3 Peru 3 286 4 069 5 373 4 450 ‐17.2 Others 1 377 1 353 1 067 1 142 7.0 Arabicas 41 989 50 931 46 691 54 220 16.1 Robustas 11 056 11 962 11 712 13 026 11.2
- 6. 6 Monthly Coffee Market Report – September 2013 Table 4: Total exports of all forms of coffee by exporting countries In thousand bags Full trade statistics for all exporting countries are available on the ICO website at www.ico.org/trade_statistics.asp Table 5: Certified stocks on the New York and London futures markets In million bags Table 6: Total coffee consumption in selected countries In thousand bags * Estimated 2011/12 2012/13 % change TOTAL 9 221 8 630 ‐6.4 99 668 102 397 2.7 Colombian Milds 666 1 001 50.3 7 778 9 487 22.0 Other Milds 2 567 2 107 ‐17.9 25 464 23 599 ‐7.3 Brazilian Naturals 2 696 2 547 ‐5.5 28 448 30 485 7.2 Robustas 3 292 2 974 ‐9.7 37 978 38 826 2.2 Arabicas 5 929 5 655 ‐4.6 61 690 63 571 3.0 Robustas 3 292 2 974 ‐9.7 37 978 38 826 2.2 August 2012 August 2013 % change October ‐ August Sep‐12 Oct‐12 Nov‐12 Dec‐12 Jan‐13 Feb‐13 Mar‐13 Apr‐13 May‐13 Jun‐13 Jul‐13 Aug‐13 Sep‐13 London 2.17 1.94 1.82 1.78 1.77 1.89 2.05 2.11 2.08 2.00 1.64 1.32 1.25 New York 2.43 2.72 2.82 2.90 2.96 3.03 3.09 3.10 3.11 3.09 3.11 3.15 3.13 Calendar years 2009 2010 2011 2012* Average annual growth rate (2009 ‐ 2012*) World total 132 270 137 025 139 050 142 000 2.4 Exporting countries 39 616 40 910 42 397 43 467 3.1 Traditional markets 69 204 71 004 70 717 71 404 1.0 Emerging markets 23 449 25 111 25 936 27 129 5.0