The implications of heterogeneous vascular patterning on radiation therapy response

1. The document discusses a computational model that simulates tumor growth and response to radiation therapy. It accounts for heterogeneous vascular patterning in tissue which can impact oxygen distribution, cell behavior, and treatment response. 2. The model represents tissue at a microscopic scale using a lattice-based cellular automaton. It models oxygen diffusion and consumption, as well as cell proliferation, migration, quiescence and death based on local oxygen levels. 3. The model can incorporate patient-specific vessel patterns reconstructed from medical images to simulate their effects on tumor oxygenation and radiation therapy outcomes at a personalized level. This could help optimize treatment plans accounting for tissue-level heterogeneity.

Recommandé
Recommandé
Contenu connexe
Similaire à The implications of heterogeneous vascular patterning on radiation therapy response
Similaire à The implications of heterogeneous vascular patterning on radiation therapy response (20)
Dernier
Dernier (20)
The implications of heterogeneous vascular patterning on radiation therapy response
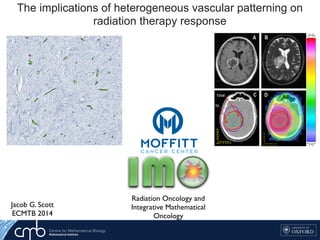
- 1. The implications of heterogeneous vascular patterning on radiation therapy response Jacob G. Scott ECMTB 2014 Key Factor Christopher McFarland 1Harvard-MIT Division of Health Oncology, *contributed equally Background: Metastasis is a highly lethal and poorly understood process that accounts for the majority cancer deaths Patterns of metastatic spread are not explained by deterministic explain these patterns We develop a stochastic model at the genomic level and use population genetics techniques to explore this phenomenon Feature of Model O Population size determined by fitness of cells La Key F Christopher 1Harvard-MIT Div Oncology, *contri Background: Metastasis is a highly lethal and poorly understood process that accounts for the majority cancer deaths Patterns of metastatic spread are not explained by deterministic Feature of Radiation Oncology and Integrative Mathematical Oncology occupied 30%, the intermediate region 20% and the periphery 50% of the total T1Gd visible tumour volume. These regions were incorporated in the virtual tumour model (Figure 7). The low, intermediate and high vascularity voxels from Part 1 were assigned Figure 5: Patient 4 tumour and dose distribution. A: One slice of the T1Gd MRI. The dark core and light periphery can be clearly seen. B: One slice of the T2 MRI. C: Part of the hand-drawn structures matrix, showing the T1Gd and T2 tumour outlines, plus 2 cm margins around them, giving the clinically targetted region. D: A slice of the dose distribution. Colormap is given on the right. F c t A d i p h g o
- 2. 4910 Figure 2. Image of the concentration (in mM) of the contrast agent in the central the tumour. affect radiation therapy efficacy Macroscopic hypoxia correlates with radiocontrast uptake, and dose modulation is efficacious, in silico1 Patient-Specific Radiotherapy for Glioblastoma •Radiation dose/fraction is known to depend heavily on local oxygen concentration as well as intrinsic cell parameters •Our ability to quantify these parameters in patients is maturing, but has not translated to the clinic Cell diffusivity and S
- 3. We use a suite of mathematical and computational models to bridge a range of spatial and temporal scales. TIME/SPATIAL SCALE CELLULAR DETAIL Evolutionary Game Theory Reaction Diffusion Models Hybrid Cellular Automata Cellular Potts Model Immersed Boundary Model Hybrid Cellular Automata Non-spatial continuum Reaction Diffusion Network Theory
- 4. m (2.4) that the VCP depends not only on the actualy oxygen concentration riences, but also on the total number of cells. In the following sections we ach of these factors individually, beginning with the number of cells within which we will call the carrying capacity. ygen dependence d the changes in the radiation parameters, α and β, with oxygen we use the oxygen enhancement ratio (OER): αi = αmax OERαi (pi) , βi = βmax OERβi (pi)2 , (2.5) nd βmax are the values of α and β under fully oxygenated conditions and re the values of α, β and oxygen, p, in compartment i. We can further find function of the oxygen concentration by using the relation established by correlation by Chapman et al. [22], and Palcic and Skarsgard [62]: OERi = (OERmax − OERmin)Km pi + Km + OERmin (2.6) oxygen concentration in compartment i, Km = 3.28 and OERαmin =OERβmin = There is little information about how β changes in glioblastoma with oxy- o for now, we will assume that the α β ratio for maximally sensitive cells ant at 10 Gy−1 (this is reported in the literature ranging from 8.64 [25] to 31 Oxygen dependence and the changes in the radiation parameters, α and β, with oxygen we use the the oxygen enhancement ratio (OER): αi = αmax OERαi (pi) , βi = βmax OERβi (pi)2 , (2.5) x and βmax are the values of α and β under fully oxygenated conditions and pi are the values of α, β and oxygen, p, in compartment i. We can further find s a function of the oxygen concentration by using the relation established by tal correlation by Chapman et al. [22], and Palcic and Skarsgard [62]: OERi = (OERmax − OERmin)Km pi + Km + OERmin (2.6) the oxygen concentration in compartment i, Km = 3.28 and OERαmin =OERβmin = 6]. There is little information about how β changes in glioblastoma with oxy- n, so for now, we will assume that the α β ratio for maximally sensitive cells nstant at 10 Gy−1 (this is reported in the literature ranging from 8.64 [25] to 31 he basics of radiobiological modeling, to include tumor control ear-quadratic model of surviving fraction (SF) [15, 31], the ement ratio (OER) and linear energy transfer (LET). SF = e−n(αd+βd2) (2.1) nd β refer to the radiobiologic parameters associated (phe- kill secondary to ‘single hit’ events (α) and ‘double hit’ events r fraction of radiation and n to the number of fractions. trol probability e that considers the total number of surviving cells in a tumour, apter, in the total number of surviving cells in our domain. We sure, based on the TCP, which we will call the Voxel Control derstand the effect of radiation on a distribution of cells, we vival probability of each discrete subpopulation of cells in the ed by their proliferative state, and their microenvironmental allow Nt ij to be the number of cells of type i, where i ∈ {S, D} 30 image credit: http://www.eyephysics.com/tdf/models.htm Radiation Biology Primer TCP = e−SFN0
- 5. ∂c(x, t) ∂t = Dc∇2 c(x, t) − fc(x, t), (1.1) entration of oxygen at a given time t and position x, Dc is the ygen, which we assume to be constant (providing linear, isotropic governed by Michaelis-Menten kinetics and is defined as: µir(c, t) if there is a cell of type i at x at time t, 0 otherwise, (1.2) nd the labels H, S, P and T are used to refer to healthy, TIC, TAC y. Here µi is defined as the cell type-specific oxygen consumption T ), which modulates r(c, t), the oxygen dependent consumption r(c, t) = rc c(x, t) c(x, t) + Km e the maximal uptate rate and effective Michaelis-Menten con- upplement equation (1.1) with the following initial and boundary ith the oxygen in the domain set to c(x, 0) = c0 and all lattice mal cells. In the case of a cancer simulation, we replace the center e TIC. Vessels are placed throughout the domain at a prescribed 5 nt of oxygen equal to that carried in the arterial blood. This oxygen is then allowed ffuse into the surrounding tissue. he spatiotemporal evolution of the oxygen field is described by the reaction-diffusion al differential equation (PDE) ∂c(x, t) ∂t = Dc∇2 c(x, t) − fc(x, t), (1.1) e c(x, t) is the concentration of oxygen at a given time t and position x, Dc is the ion coefficient of oxygen, which we assume to be constant (providing linear, isotropic ion) and fc(x, t) is governed by Michaelis-Menten kinetics and is defined as: fc(x, t) = µir(c, t) if there is a cell of type i at x at time t, 0 otherwise, (1.2) e i ∈ {H, S, P, T} and the labels H, S, P and T are used to refer to healthy, TIC, TAC TD cells respectively. Here µi is defined as the cell type-specific oxygen consumption ant (µH, µS, µP , µT ), which modulates r(c, t), the oxygen dependent consumption defined as r(c, t) = rc c(x, t) c(x, t) + Km e rc and Km denote the maximal uptate rate and effective Michaelis-Menten con- respectively. We supplement equation (1.1) with the following initial and boundary tions. We begin with the oxygen in the domain set to c(x, 0) = c0 and all lattice s occupied by normal cells. In the case of a cancer simulation, we replace the center e point with a single TIC. Vessels are placed throughout the domain at a prescribed 5 source of oxygen occupying one lattice point, are placed randomly ce at the start of a given simulation, with a specified spatial density we neglect vascular remodelling. Each vessel is assumed to carry an ual to that carried in the arterial blood. This oxygen is then allowed rrounding tissue. ral evolution of the oxygen field is described by the reaction-diffusion quation (PDE) ∂c(x, t) ∂t = Dc∇2 c(x, t) − fc(x, t), (1.1) concentration of oxygen at a given time t and position x, Dc is the f oxygen, which we assume to be constant (providing linear, isotropic ) is governed by Michaelis-Menten kinetics and is defined as: = µir(c, t) if there is a cell of type i at x at time t, 0 otherwise, (1.2) } and the labels H, S, P and T are used to refer to healthy, TIC, TAC vely. Here µi is defined as the cell type-specific oxygen consumption P , µT ), which modulates r(c, t), the oxygen dependent consumption r(c, t) = rc c(x, t) c(x, t) + Km note the maximal uptate rate and effective Michaelis-Menten con- We supplement equation (1.1) with the following initial and boundary n with the oxygen in the domain set to c(x, 0) = c0 and all lattice ormal cells. In the case of a cancer simulation, we replace the center ingle TIC. Vessels are placed throughout the domain at a prescribed ll diameters [33] and the information from the literature concerning the ratio of r to normal oxygen consumption (see Section 1.2.2.1). ntroducing the non-dimensional variables ˜x = x/L, ˜t = t/τ and ˜c = c/c0, we define ew non-dimensional parameters ˜Dc = Dcτ L2 , ˜rc = τn0rc c0 . (1.3) otational convenience, we henceforth drop the tildes and refer to the non-dimensional meters only as DC and rc. See Table 1.1 for a full list of parameter estimates and ndix ?? for our procedure for esimating the cancer cell oxygen consumption rate. .3 Numerical solution der to solve equation (1.1) numerically, we discretize space and time by considering k∆t, xi = i∆x and yj = j∆x and approximate the concentration of oxygen at tep k and position (i∆x, j∆x) by ck i,j ≈ c(xi, yj, tk). We use a central difference oximation for the Laplacian and thus approximate equation (1.1) by ck+1 i,j − ck i,j ∆t = DC ∆x2 ck i+1,j + ck i−1,j + ck i,j+1 + ck i,j−1 − 4ck i,j − fc k i,j , (1.4) e fc k i,j is the cell-specific oxygen consumption µcellrc at time k given a cell at on (i∆x, j∆x) as discussed in equation 1.2. We then rearrange equation (1.4) to n a solution for ck+1 i,j , yielding rc Maximal oxygen consumption rate 2.3 × 10⁻¹⁶ mol cells−1 s −1 [32] c0 Background oxygen concentration 1.7 × 10⁻⁸ mol cm −2 [6] ∆x Average cell diameter 50µm [25] τ Average cell doubling time 16h [19] cap Hypoxic threshold 0.1 [20] rp Proliferative oxygen consumption 5 × rc [32] Km Effective Michaelis- Menten constant 0.8mmHg [54] n0 Cancer cell density 1.6 × 10⁵ cells cm −2 [21] s TIC symmetric division probability 0 ≤ s ≤ 1 Model-specific a TAC proliferative capacity 0 − 10 Model-specific µcancer/µH Cancer metabolic ratio 2 [12] ck+1 i,j = ck i,j 1 − 4 DC∆t ∆x2 + DC∆t ∆x2 ck i+1,j + ck i−1,j + ck i,j+1 + ck i,j−1 − ∆t(fc)k i,j. (1.5) During each update, then, the oxygen tension in a given lattice point is updated Diffusion and uptake, exact Diffusion and uptake, numeric approximation
- 6. autophagy (directly translated as ‘self-eating’), a state in which they become resistant to nutrient starvation [91], and cells are known to die on different time scales and by different mechanisms (apoptosis vs. necrosis) depending on the magnitude and duration of the hypoxic insult. While these differences have been shown to affect tumour growth [19], as this is not the main aim of this model, we will simplify this scenario by assigning a rate, pd, for cell death at each cellular automaton update defined in Section 2.2.3, when under extreme hypoxia (i.e. c cap). 2.2.2.4 Quiescence When cells sense that there is not enough oxygen to divide, or experience contact inhi- bition, they undergo a state of quiescence during which there is no division. We model this as an oxygen threshold (c cp) below which cellular division is not possible and by the spatial constraint which requires the cell to be quiescent if there is not at least one neighbouring lattice point (Moore neighbourhood, see Figure 2.7(a)) empty or inhabited by a normal cell. When a cell senses that sufficient oxygen and a neighbouring site have become available, the state of quiescence is reversed. Figure 2.3: A summary of oxygen based cell fate threshholds. At each cellular au- tomaton update, each cell in the domain undergoes a series of fate decisions based on the local oxygen concentration. When c c , cells die at rate p , when c c c cells are quiescent
- 8. DomainSize Healthy tissue with regular vascular patterning
- 9. 1 2 3 4 5 Cancer invading into healthy tissue with regular vascular patterning 1 2 3 4 5
- 10. Cancer invading into normal tissue with irregular patterning
- 11. Heterogeneity in vessel pattern induces change in skewness and cell number
- 12. Simplest scenario, two vessels
- 13. 500 simulations of small domain at dynamic equilibrium with N randomly seeded vessels N/(domain size) Celldensity
- 14. nter and Research Institute, Tampa, FL itute, University of Oxford, Oxford, UK n efficacy e based CA ur density Oxygen concentration (mmHG) Oxygen concentration (mmHG) VesselDensity TCP TCP Oxygen concentration (mmHG) Oxygen concentration (mmHG) Tumour control probability depends not only on vessel density, but also on vessel organization TCP ~62% TCP ~75% TCP ~99% TCP ~88% our in t6
- 15. Skewness and TCP Towards patient-specific biology-driven heterogeneous radiation planning: using a computational model of tumor growth to identify novel radiation sensitivity signatures. Jacob G Scott1,2, David Basanta1, Alex G Fletcher2, Philip K Maini2, Alexander RA Anderson1 1Integrated Mathematical Oncology, H. Lee Moffitt Cancer Center and Research Institute, Tampa, FL 2Wolfson Centre for Mathematical Biology, Mathematical Institute, University of Oxford, Oxford, UK Adapting radiotherapy to hypoxic tumours 4909 Figure 1. Pre- and post-contrast T1-weighted MR images taken in the coronal plane through the head of the dog with a spontaneous sarcoma. The gross tumour volume (GTV) is enclosed by the white contour, while the tongue (T) and mandible (M) are indicated. This is reflected in figure 2, showing a corresponding image of the tracer concentration in the tumour. With respect to blood (and thus oxygen) supply, the tumour periphery may qualitatively be characterized as normoxic, while the core is probably hypoxic or necrotic. The tentative pO2 distribution (in frequency form) in the canine tumour, as obtained from the MR scaling procedure, is given in figure 3. In the same figure, the oxygen distribution obtained from Eppendorf histograph measurements (Brurberg et al 2005) is shown. The two 4910 E Malinen et al Figure 2. Image of the concentration (in mM) of the contrast agent in the central coronal plane of the tumour. Figure 3. Frequency histograms of the tumour oxygen tension in the canine patient, as determined by the Eppendorf histograph (Brurberg et al 2005) and the MR analysis. plots appear similar and rather log-normally distributed, but both have a high frequency of readings at the lowest oxygen level. The measured median and mean pO2 levels obtained from the histograph were 8.5 and 13.9 mm Hg, respectively, against 13.6 and 16.6 mm Hg, respectively, estimated from the tentative MR analysis. The correlation coefficient between the histograms was 0.88, and a rank sum test and a Kolmogorov–Smirnov test showed that the histograms were not significantly different (p values of 0.20 and 0.14, respectively). The ‘hypoxic fraction’, i.e. the fraction of pO2 readings smaller than 5 mm Hg were 0.42 and 0.28 for the histograph and MR analysis, respectively. For the current case, it is tentatively assumed that the MR analysis provides pO2-related images that are biologically relevant. The compartmental volumes and corresponding mean pO2 levels are given in table 1. In figure 4, coronal images displaying the tumour compartments are shown. It appears that the compartmental volumes vary considerably with the coronal plane position although the Biology and microenvironment affect radiation therapy efficacy Macroscopic hypoxia correlates with radiocontrast uptake, and dose modulation is efficacious, in silico1 In this work, we use a proliferation-invasion-radiotherapy Figure 1. Parameter generation for the patient-specific biomathematical model. 1. Determine radial measurements from serial T1Gd and T2/FLAIR magnetic resonance imaging. 2. Compute the invisibility index (D/r) from intra-study T1Gd and T2/FLAIR radial measurements. 3. Compute the radial velocity (2 ffiffiffiffiffiffiffi Dr p ) from serial T1Gd or T2/FLAIR radial measurements. doi:10.1371/journal.pone.0079115.g001 Patient-Specific Radiotherapy for Glioblastoma •Radiation dose/fraction is known to depend heavily on local oxygen concentration as well as intrinsic cell parameters •Our ability to quantify these parameters in patients is maturing, but has not translated to the clinic PNASPLUS XRT dose modulation using putative stem distribution3 and dynamics4 shown effective in silico and in vivo4 Cell diffusivity and replication can be inferred from MRI imaging, allowing for understanding of growth prediction and dose shape modification2 Non-invasive PET imaging reported with Several layers of heterogeneity effect radiation efficacy N Quantitative Histology yields vessel organization Microenvironmental feedback Lattice based CAStem hierarchy Non stem-driven tumour high vessel density Stem-driven tumour low vessel density Oxygen concentration (mmHG) Oxygen concentration (mmHG) VesselDensity TCP TCP Oxygen concentration (mmHG) Oxygen concentration (mmHG) Tumour control probability depends not only on vessel density, but also on vessel organization Enabling translation - information from several scales Optimized plan TCP ~62% TCP ~75% TCP ~99% TCP ~88% Mathematical model of a stem driven tumour in a heterogeneous vascular environment6
- 17. Ripley’s K(t)mulations (from Figure 3.2) that yield a cell density greater than ape. i and j, X is the variable of interest, in this case oxygen global mean of X. The matrix w is a matrix that contains the value of 1 if the elements i and j are adjacent, and 0 seful in a number of ecological contexts, for our purposes it is dre et al. CITE, the residual spatial autocorrelation between hort relative length scale on which oxygen varies as compared makes all landscapes appear to be well correlated, that is, hat approaches zero. asure is Ripley’s K, and its variance stabilized cousin, Ripley’s re functions of distance, describe, instead of adjacent elements, hin a given distance. For Ripley’s K, we have ˆK(t) = λ−1 i=j I(dij t) n , (3.8) Figure 3.3: Proportion of simulations (from Figure 3.2) that yield a cell density greater than 90%, exhibiting a sigmoid shape. of spatial units indexed by i and j, X is the variable of interest, in this case oxygen concentration and ¯X is the global mean of X. The matrix w is a matrix that contains spatial weights which take the value of 1 if the elements i and j are adjacent, and 0 otherwise. While this measure is useful in a number of ecological contexts, for our purposes it is not. As suggested by Legendre et al. CITE, the residual spatial autocorrelation between cells and oxygen, and the short relative length scale on which oxygen varies as compared to vessel presence/absence, makes all landscapes appear to be well correlated, that is, have a Moran’s I measure that approaches zero. 3.5.2.2 Ripley’s K A more appropriate measure is Ripley’s K, and its variance stabilized cousin, Ripley’s L. These measures, which are functions of distance, describe, instead of adjacent elements, the number of elements within a given distance. For Ripley’s K, we have ˆK(t) = λ−1 i=j I(dij t) n , (3.8) where λ is the average density of points in the domain, I is the indicator function which yields I(dij t) = 1 if the Euclidian distance fromi → j t, 0 otherwise. (3.9) We will utilize the variance stabilized version of this measure, ˆL(t) which is given by Figure 3.4: Our assumptions about cellular oxygen di ferences in tumour control probability. We plot two uniform (Left) and Poisson (center) and compare thes the CA (right). Each distribution is mapped on to the the TCP is calculated as per equation (3.6). The Poisson using a lambda value eqivalent to the mean of the mea CA. The CA distribution was created by averaging 20 the CA after it reached dynamic equilibrium. We find 99% and 91%, respectively. ˆL(t) = ˆK(t) π 1/2 , which has an expected value of ˆL(t) = t for homogeneou effects, we implement the correction suggested by Ripley
- 19. Ripley’s L and TCP Towards patient-specific biology-driven heterogeneous radiation planning: using a computational model of tumor growth to identify novel radiation sensitivity signatures. Jacob G Scott1,2, David Basanta1, Alex G Fletcher2, Philip K Maini2, Alexander RA Anderson1 1Integrated Mathematical Oncology, H. Lee Moffitt Cancer Center and Research Institute, Tampa, FL 2Wolfson Centre for Mathematical Biology, Mathematical Institute, University of Oxford, Oxford, UK Adapting radiotherapy to hypoxic tumours 4909 Figure 1. Pre- and post-contrast T1-weighted MR images taken in the coronal plane through the head of the dog with a spontaneous sarcoma. The gross tumour volume (GTV) is enclosed by the white contour, while the tongue (T) and mandible (M) are indicated. This is reflected in figure 2, showing a corresponding image of the tracer concentration in the tumour. With respect to blood (and thus oxygen) supply, the tumour periphery may qualitatively be characterized as normoxic, while the core is probably hypoxic or necrotic. The tentative pO2 distribution (in frequency form) in the canine tumour, as obtained from the MR scaling procedure, is given in figure 3. In the same figure, the oxygen distribution obtained from Eppendorf histograph measurements (Brurberg et al 2005) is shown. The two 4910 E Malinen et al Figure 2. Image of the concentration (in mM) of the contrast agent in the central coronal plane of the tumour. Figure 3. Frequency histograms of the tumour oxygen tension in the canine patient, as determined by the Eppendorf histograph (Brurberg et al 2005) and the MR analysis. plots appear similar and rather log-normally distributed, but both have a high frequency of readings at the lowest oxygen level. The measured median and mean pO2 levels obtained from the histograph were 8.5 and 13.9 mm Hg, respectively, against 13.6 and 16.6 mm Hg, respectively, estimated from the tentative MR analysis. The correlation coefficient between the histograms was 0.88, and a rank sum test and a Kolmogorov–Smirnov test showed that the histograms were not significantly different (p values of 0.20 and 0.14, respectively). The ‘hypoxic fraction’, i.e. the fraction of pO2 readings smaller than 5 mm Hg were 0.42 and 0.28 for the histograph and MR analysis, respectively. For the current case, it is tentatively Biology and microenvironment affect radiation therapy efficacy Macroscopic hypoxia correlates with radiocontrast uptake, and dose modulation is efficacious, in silico1 Figure 1. Parameter generation for the patient-specific biomathematical model. 1. Determine radial measurements from serial T1Gd and Patient-Specific Radiotherapy for Glioblastoma •Radiation dose/fraction is known to depend heavily on local oxygen concentration as well as intrinsic cell parameters •Our ability to quantify these parameters in patients is maturing, but has not translated to the clinic PNASPLUS XRT dose modulation using putative stem distribution3 and dynamics4 shown effective in silico and in vivo4 Cell diffusivity and replication can be inferred from MRI imaging, allowing for understanding of growth prediction and dose shape modification2 Several layers of heterogeneity effect radiation efficacy Quantitative Histology yields vessel Microenvironmental feedback Lattice based CAStem hierarchy Non stem-driven tumour high vessel density Stem-driven tumour low vessel density Oxygen concentration (mmHG) Oxygen concentration (mmHG) VesselDensity TCP TCP Oxygen concentration (mmHG) Oxygen concentration (mmHG) Tumour control probability depends not only on vessel density, but also on vessel organization Enabling translation - information from several scales TCP ~62% TCP ~75% TCP ~99% TCP ~88% Mathematical model of a stem driven tumour in a heterogeneous vascular environment6
- 20. alinen et al. Phys Med Biol 2006 2. Corwin et al. PLoS ONE 2013 3. Alfonso et al., PLoS ONE 2014 4. Leder et al, Cell 2014 5. Gaedicke et al., PNAS 2014. 6. Scott et al. PLoS Comp Bi ACKNOWLEDGEMENT: This work sponsored in part by the Moffitt Cancer Center PSOC, NIH/NCI U54CA143970 ue. (A) Representative immunohistochemistry (IHC) staining of pimonidazole in orthotopic ap water or water containing sodium bicarbonate to drink. (B) Computational segmentation ues. (C) Positive pixel analysis of segmented viable tissue showing intensity of pimonidazole orange indicates moderate staining, and red indicates strong staining. N Quantitative Histology yields vessel organization Radiomics yields vessel density Oxygen concentration (mmHG) Oxygen concentration (mmHG) Enabling translation - information from several scales Optimized plan Image credit: Unkelbach et al. doi: 10.1088/0031-9155/59/3/771
- 21. Key Factors in the Metastatic Pr from Population Gene Christopher McFarland1*, Jacob Scott2,3,*, David Basanta3, Alexand 1Harvard-MIT Division of Health Science Technology, 2H. Lee Moffitt Cancer and Resea Oncology, *contributed equally to this work Fig 1. Prevalence and significance of micrometastases are poorly understood. Most micrometastases never progress to macroscopic size. In this case, small colonies of breast endothelial cells are found in the lung of a non-metastatic breast cancer patient Background: Metastasis is a highly lethal and poorly understood process that accounts for the majority cancer deaths Patterns of metastatic spread are not explained by deterministic explain these patterns We develop a stochastic model at the genomic level and use population genetics techniques to explore this phenomenon Modeling Metastasis: A tumor was grown in silico by creating a population of single cells that stochastically undergo mitosis and cell death. Cells can gain passenger and driver mutations during division which are passed to their offspring Results: Effect of p Success of metastases inc Fig 5. Driver Mutation Passenger Mutation B(d,p)* An aliquot of 103 cells was taken from a primary tumor when it reached 5x10⁵ and 106 cells and were then allowed to deposit into a foreign stroma and observed A stromal penalty s was applied only to driver mutations acquired in the Fig 3. Results: Effect of stro Cells derived from the larger prima Metastatic success is highly depen Three regimes were observed in th metastasis was impossible (green), which only cells from certain primary We further define a value, scritical, ab Fig 4. Feature of Model Observed Phenomenon Population size determined by fitness of cells Larger Tumors more likely to metastasize Cells can acquire passenger mutations that are slightly deleterious Many micrometastases never grown to macroscopic size Cells with more mutations are less likely to metastasize Stromal environment reduces efficacy of driver mutations Certain stromal conditions prohibit metastasis Metastasis continues to mutate and evolve Metastases with same founding cell can have different fates Cells divide and acquire mutations on individual basis Large heterogeneity in probability of metastasis within primary tumor No pre-defined growth rate Late primary tumors less likely to metastasize than early tumors of equivalent size Pmet We derived a way to calculate Pmet for every cell in the 100 primary Integrative Mathematical Oncology NIH 1 U54 CA143970-01S
- 22. ~100 meters
- 23. ∂c ∂t = D ∂2 c ∂x2 (1.6) [0, L], with boundary conditions c(0, t) = c(0, L) = 1 and and initial 0. this equation using separation of variables and solving for ˜c = c + 1 ) and the boundary conditions ˜c(0, t) = ˜c(0, L) = 0 and initial condition find that the solution (see Appendix A) is given by ) = ∞ n=1 2 nπ cos nπ − 1 sin nπx L exp − n2 π2 DCt L2 . (1.7) we plot the oxygen concentation profile through the centre of a 100×100 evoid of cells at one-second intervals. The analytical solution (equation d to the numerical solution of equation (1.5) at each lattice point for , 500 and 1, 000 seconds. We find excellent agreement between the two cales and updates time scales that govern the diffusion of nutrients and that at which anaged by updating the continuous part of the model many times per This can become computationally expensive in this explicit scheme, seek to minimize this number. However, for stability, we require that ∂c ∂t = D ∂2 c ∂x2 (1.6) for t ≥ 0 and x ∈ [0, L], with boundary conditions c(0, t) = c(0, L) = 1 and and initial condition c(x, t) = 0. We can solve this equation using separation of variables and solving for ˜c = c + 1 which satisfies (1.6) and the boundary conditions ˜c(0, t) = ˜c(0, L) = 0 and initial condition ˜c(x, t) = −1. We find that the solution (see Appendix A) is given by c(x, t) = ∞ n=1 2 nπ cos nπ − 1 sin nπx L exp − n2 π2 DCt L2 . (1.7) In Figure 1.8 we plot the oxygen concentation profile through the centre of a 100×100 domain which is devoid of cells at one-second intervals. The analytical solution (equation (1.7)) is compared to the numerical solution of equation (1.5) at each lattice point for time t = 1, 10, 100, 500 and 1, 000 seconds. We find excellent agreement between the two solutions. 1.2.3.4 Time scales and updates The difference in time scales that govern the diffusion of nutrients and that at which cells operate is managed by updating the continuous part of the model many times per cellular time step. This can become computationally expensive in this explicit scheme, and therefore, we seek to minimize this number. However, for stability, we require that the ∆tDc/∆x2 term from equation (1.5) is less than 0.25 [56]. We therefore choose ∆tDc/∆x2 = 0.1, which equates to updating oxygen every 0.25 seconds, or approximately 230, 400 times per cell cycle based on the parameters chosen (see Table 1.1). While we assume the average cell cycle time to be τ = 16 hours, it is well known that cells in tissues are not synchronized, and also that cell fate decisions such as apoptosis are made on shorter time scales. To model this heterogeneity in division time and to more accurately match the finer time scale associated with cell death due to microenvironmental cues ∂c ∂t = D ∂2 c ∂x2 (1.6) for t ≥ 0 and x ∈ [0, L], with boundary conditions c(0, t) = c(0, L) = 1 and and initial condition c(x, t) = 0. We can solve this equation using separation of variables and solving for ˜c = c + 1 which satisfies (1.6) and the boundary conditions ˜c(0, t) = ˜c(0, L) = 0 and initial condition ˜c(x, t) = −1. We find that the solution (see Appendix A) is given by c(x, t) = ∞ n=1 2 nπ cos nπ − 1 sin nπx L exp − n2 π2 DCt L2 . (1.7) In Figure 1.8 we plot the oxygen concentation profile through the centre of a 100×100 domain which is devoid of cells at one-second intervals. The analytical solution (equation (1.7)) is compared to the numerical solution of equation (1.5) at each lattice point for time t = 1, 10, 100, 500 and 1, 000 seconds. We find excellent agreement between the two solutions. 1.2.3.4 Time scales and updates The difference in time scales that govern the diffusion of nutrients and that at which cells operate is managed by updating the continuous part of the model many times per cellular time step. This can become computationally expensive in this explicit scheme, and therefore, we seek to minimize this number. However, for stability, we require that the ∆tDc/∆x2 term from equation (1.5) is less than 0.25 [56]. We therefore choose ∆tDc/∆x2 = 0.1, which equates to updating oxygen every 0.25 seconds, or approximately 230, 400 times per cell cycle based on the parameters chosen (see Table 1.1). While we assume the average cell cycle time to be τ = 16 hours, it is well known that cells in tissues are not synchronized, and also that cell fate decisions such as apoptosis are made on shorter time scales. To model this heterogeneity in division time and to more accurately match the finer time scale associated with cell death due to microenvironmental cues ∂c ∂t = for t ≥ 0 and x ∈ [0, L], with boundary con condition c(x, t) = 0. We can solve this equation using separa which satisfies (1.6) and the boundary condit ˜c(x, t) = −1. We find that the solution (see c(x, t) = ∞ n=1 2 nπ cos nπ − 1 In Figure 1.8 we plot the oxygen concenta domain which is devoid of cells at one-second (1.7)) is compared to the numerical solutio time t = 1, 10, 100, 500 and 1, 000 seconds. W solutions. 1.2.3.4 Time scales and updates The difference in time scales that govern t cells operate is managed by updating the co cellular time step. This can become compu and therefore, we seek to minimize this num the ∆tDc/∆x2 term from equation (1.5) i ∆tDc/∆x2 = 0.1, which equates to updating 230, 400 times per cell cycle based on the p assume the average cell cycle time to be τ = are not synchronized, and also that cell fa shorter time scales. To model this heterogen match the finer time scale associated with [68], we choose to update the HCA 100 t ∂c ∂t = D ∂ c ∂x2 (1.6) for t ≥ 0 and x ∈ [0, L], with boundary conditions c(0, t) = c(0, L) = 1 and and initial condition c(x, t) = 0. We can solve this equation using separation of variables and solving for ˜c = c + 1 which satisfies (1.6) and the boundary conditions ˜c(0, t) = ˜c(0, L) = 0 and initial condition ˜c(x, t) = −1. We find that the solution (see Appendix A) is given by c(x, t) = ∞ n=1 2 nπ cos nπ − 1 sin nπx L exp − n2 π2 DCt L2 . (1.7) In Figure 1.8 we plot the oxygen concentation profile through the centre of a 100×100 domain which is devoid of cells at one-second intervals. The analytical solution (equation (1.7)) is compared to the numerical solution of equation (1.5) at each lattice point for time t = 1, 10, 100, 500 and 1, 000 seconds. We find excellent agreement between the two solutions. 1.2.3.4 Time scales and updates The difference in time scales that govern the diffusion of nutrients and that at which cells operate is managed by updating the continuous part of the model many times per cellular time step. This can become computationally expensive in this explicit scheme, and therefore, we seek to minimize this number. However, for stability, we require that the ∆tDc/∆x2 term from equation (1.5) is less than 0.25 [56]. We therefore choose ∆tDc/∆x2 = 0.1, which equates to updating oxygen every 0.25 seconds, or approximately 230, 400 times per cell cycle based on the parameters chosen (see Table 1.1). While we assume the average cell cycle time to be τ = 16 hours, it is well known that cells in tissues are not synchronized, and also that cell fate decisions such as apoptosis are made on shorter time scales. To model this heterogeneity in division time and to more accurately match the finer time scale associated with cell death due to microenvironmental cues Check of numerics