Gta office market dashboard 2011 q2 booklet
•
0 j'aime•634 vues

office space toronto, toronto office space, office search toronto, office space in toronto, office rentals toronto, commercial office space, commercial real estate toronto, office rent toronto, toronto offices for lease
Recommandé

Recommandé
Contenu connexe
Plus de Chris Fyvie
Plus de Chris Fyvie (20)
Dernier
Dernier (20)
Gta office market dashboard 2011 q2 booklet
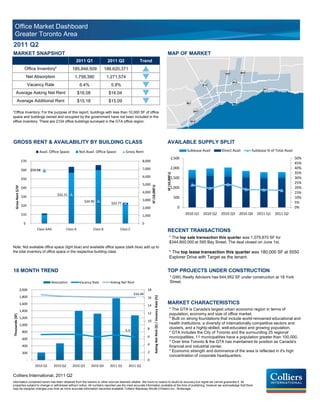
- 1. Office Market Dashboard Greater Toronto Area 2011 Q2 MARKET SNAPSHOT MAP OF MARKET 2011 Q1 2011 Q2 Trend Office Inventory* 185,846,509 186,620,371 p Net Absorption 1,758,390 1,271,574 q Vacancy Rate 6.4% 5.9% q Average Asking Net Rent $16.08 $16.04 q Average Additional Rent $15.18 $15.09 q *Office Inventory: For the purpose of this report, buildings with less than 10,000 SF of office space and buildings owned and occupied by the government have not been included in the office inventory. There are 2124 office buildings surveyed in the GTA office region. GROSS RENT & AVAILABILITY BY BUILDING CLASS AVAILABLE SUPPLY SPLIT Avail. Office Space Not Avail. Office Space Gross Rent Sublease Avail Direct Avail Sublease % of Total Avail. 2,500 50% $70 8,000 45% $60 7,000 2,000 40% $59.98 35% SF (10,000's) 6,000 1,500 30% $50 5,000 25% SF (10,000's) 1,000 20% Gross Rent $/SF $40 4,000 15% $32.31 $30 500 10% $24.90 3,000 $22.77 5% $20 0 2,000 0% $10 1,000 2010 Q1 2010 Q2 2010 Q3 2010 Q4 2011 Q1 2011 Q2 $- 0 Class AAA Class A Class B Class C RECENT TRANSACTIONS * The top sale transaction this quarter was 1,079,870 SF for $344,800,000 at 595 Bay Street. The deal closed on June 1st. Note: Not available office space (light blue) and available office space (dark blue) add up to the total inventory of office space in the respective building class. * The top lease transaction this quarter was 180,000 SF at 5550 Explorer Drive with Target as the tenant. 18 MONTH TREND TOP PROJECTS UNDER CONSTRUCTION * GWL Realty Advisors has 644,952 SF under construction at 18 York Absorption Vacancy Rate Asking Net Rent Street. 2,000 18 $16.04 1,800 Asking Net Rent ($) / Vacancy Rate (%) 16 1,600 14 MARKET CHARACTERISTICS 1,400 * The GTA is Canada's largest urban economic region in terms of 12 population, economy and size of office market. Thousands (SF) 1,200 * Built on strong foundations that include world-renowned educational and 10 1,000 health institutions, a diversity of internationally competitive sectors and 8 clusters, and a highly-skilled, well-educated and growing population. 800 5.9 * GTA includes the City of Toronto and the surrounding 25 regional 6 municipalities. 11 municipalities have a population greater than 100,000. 600 * Over time Toronto & the GTA has maintained its position as Canada's 400 4 financial and industrial center. 200 2 * Economic strength and dominance of the area is reflected in it's high concentration of corporate headquarters. - 0 2010 Q1 2010 Q2 2010 Q3 2010 Q4 2011 Q1 2011 Q2 Colliers International, 2011 Q2 Information contained herein has been obtained from the owners or other sources deemed reliable. We have no reason to doubt its accuracy but regret we cannot guarantee it. All properties subject to change or withdrawal without notice. All numbers reported use the most accurate information available at the time of publishing, however we acknowledge that there may be marginal changes over time as more accurate information becomes available. Colliers Macaulay Nicolls (Ontario) Inc., Brokerage.