
Signaler
Partager
Télécharger pour lire hors ligne
Recommandé
Outline from Series on Prayer By Charles e. Whisnant, Rivers of JoyBiblical prayer gods sovereignty study notes 10 20
Biblical prayer gods sovereignty study notes 10 20Rivers of Joy Baptist Church, Pastor/Teacher Charles e Whisnant
Contenu connexe
En vedette
Outline from Series on Prayer By Charles e. Whisnant, Rivers of JoyBiblical prayer gods sovereignty study notes 10 20
Biblical prayer gods sovereignty study notes 10 20Rivers of Joy Baptist Church, Pastor/Teacher Charles e Whisnant
En vedette (12)
Weekly Verde Valley Real Estate Transaction Report
Weekly Verde Valley Real Estate Transaction Report
Biblical prayer gods sovereignty study notes 10 20
Biblical prayer gods sovereignty study notes 10 20
Plus de Chaba Tamasi
Plus de Chaba Tamasi (20)
Dernier
Dernier (20)
Explore Dual Citizenship in Africa | Citizenship Benefits & Requirements
Explore Dual Citizenship in Africa | Citizenship Benefits & Requirements
Low rate ↬Call girls in Sabzi Mandi Delhi | 8447779280}Escort Service In All ...
Low rate ↬Call girls in Sabzi Mandi Delhi | 8447779280}Escort Service In All ...
MEQ Mainstreet Equity Corp Q2 2024 Investor Presentation
MEQ Mainstreet Equity Corp Q2 2024 Investor Presentation
BPTP THE AMAARIO For The Royals Of Tomorrow in Sector 37D Gurgaon Dwarka Expr...
BPTP THE AMAARIO For The Royals Of Tomorrow in Sector 37D Gurgaon Dwarka Expr...
Call girls in Shakti Nagar Delhi~8447779280°/=@/ Short 1500 Night 6000}ESCORT...
Call girls in Shakti Nagar Delhi~8447779280°/=@/ Short 1500 Night 6000}ESCORT...
Bptp The Amaario Launch Luxury Project Sector 37D Gurgaon Dwarka Expressway...
Bptp The Amaario Launch Luxury Project Sector 37D Gurgaon Dwarka Expressway...
~Call Girls In Roop Nagar {8447779280}(Low Price) Escort Service In Delhi
~Call Girls In Roop Nagar {8447779280}(Low Price) Escort Service In Delhi
Low Rate ✨➥9711108085▻✨Call Girls In East Of Kailash (E.K) (Delhi)
Low Rate ✨➥9711108085▻✨Call Girls In East Of Kailash (E.K) (Delhi)
Call Girls in Maurice Nagar (Delhi) ꧁8447779280꧂ Female Escorts Service in De...
Call Girls in Maurice Nagar (Delhi) ꧁8447779280꧂ Female Escorts Service in De...
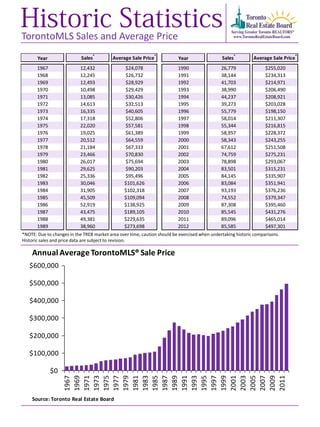
Treb historic statistics
- 1. TorontoMLS Sales and Average Price *NOTE: Due to changes in the TREB market area over time, caution should be exercised when undertaking historic comparisons. Historic sales and price data are subject to revision. Year Sales * Average Sale Price * Year Sales * Average Sale Price * 1967 12,432 $24,078 1990 26,779 $255,020 1968 12,245 $26,732 1991 38,144 $234,313 1969 12,493 $28,929 1992 41,703 $214,971 1970 10,498 $29,429 1993 38,990 $206,490 1971 13,085 $30,426 1994 44,237 $208,921 1972 14,613 $32,513 1995 39,273 $203,028 1973 16,335 $40,605 1996 55,779 $198,150 1974 17,318 $52,806 1997 58,014 $211,307 1975 22,020 $57,581 1998 55,344 $216,815 1976 19,025 $61,389 1999 58,957 $228,372 1977 20,512 $64,559 2000 58,343 $243,255 1978 21,184 $67,333 2001 67,612 $251,508 1979 23,466 $70,830 2002 74,759 $275,231 1980 26,017 $75,694 2003 78,898 $293,067 1981 29,625 $90,203 2004 83,501 $315,231 1982 25,336 $95,496 2005 84,145 $335,907 1983 30,046 $101,626 2006 83,084 $351,941 1984 31,905 $102,318 2007 93,193 $376,236 1985 45,509 $109,094 2008 74,552 $379,347 1986 52,919 $138,925 2009 87,308 $395,460 1987 43,475 $189,105 2010 85,545 $431,276 1988 49,381 $229,635 2011 89,096 $465,014 1989 38,960 $273,698 2012 85,585 $497,301 $0 $100,000 $200,000 $300,000 $400,000 $500,000 $600,000 1967 1969 1971 1973 1975 1977 1979 1981 1983 1985 1987 1989 1991 1993 1995 1997 1999 2001 2003 2005 2007 2009 2011 Source: Toronto Real Estate Board Annual AverageTorontoMLS®Sale Price