Stock Research Report for Onyx Pharma Inc ONXX as of 9/22/11 - Chaikin Power Tools
•
0 j'aime•170 vues

To order a free Chaikin Power Gauge stock research report for ONXX go to http://www.chaikinpowertools.com/reports

Recommandé
Contenu connexe
En vedette
En vedette (15)
Plus de Dan Oconnor
Plus de Dan Oconnor (10)
Dernier
Dernier (20)
Stock Research Report for Onyx Pharma Inc ONXX as of 9/22/11 - Chaikin Power Tools
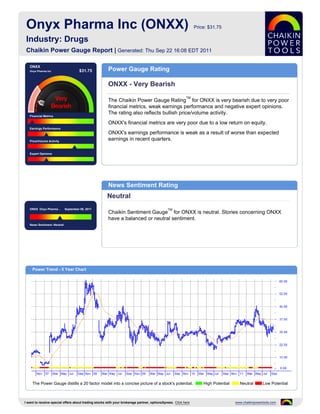
- 1. Onyx Pharma Inc (ONXX) Price: $31.75 Industry: Drugs Chaikin Power Gauge Report | Generated: Thu Sep 22 16:08 EDT 2011 ONXX Onyx Pharma Inc $31.75 Power Gauge Rating ONXX - Very Bearish TM The Chaikin Power Gauge Rating for ONXX is very bearish due to very poor financial metrics, weak earnings performance and negative expert opinions. The rating also reflects bullish price/volume activity. Financial Metrics ONXX's financial metrics are very poor due to a low return on equity. Earnings Performance ONXX's earnings performance is weak as a result of worse than expected Price/Volume Activity earnings in recent quarters. Expert Opinions News Sentiment Rating Neutral ONXX Onyx Pharma .. September 09, 2011 TM Chaikin Sentiment Gauge for ONXX is neutral. Stories concerning ONXX have a balanced or neutral sentiment. News Sentiment :Neutral Power Trend - 5 Year Chart The Power Gauge distills a 20 factor model into a concise picture of a stock's potential. High Potential Neutral Low Potential I want to receive special offers about trading stocks with your brokerage partner, optionsXpress. Click here www.chaikinpowertools.com
- 2. Financials & Earnings Financial Metrics Financial Metrics Rating LT Debt/Equity Ratio Very Bearish Price to Book Value ONXX's financial metrics are very poor. The company yields a relatively low return on shareholder's equity and is carrying too much long term debt. Return on Equity The rank is based on a high long term debt to equity ratio, high price to book value ratio and low return on equity. Price to Sales Ratio Business Value Assets and Liabilities Valuation Returns Ratio TTM Ratio TTM Ratio TTM Current Ratio 12.30 Price/Book 3.24 Return on Invest -3.4% LT Debt/Equity 0.22 Price/Sales 6.22 Return on Equity -4.2% Earnings Performance Earnings Performance Rating Earnings Growth Bearish Earnings Surprise ONXX's earnings performance has been weak. The company has not met analysts' earnings estimates and has a history of weak earnings growth. Earnings Trend The rank is based on worse than expected earnings in recent quarters and consistent earnings over the past 5 years. Projected P/E Ratio Earnings Consistency 5 Year Revenue and Earnings Growth EPS Estimates 12/06 12/07 12/08 12/09 12/10 Factor Actual EPS Prev EST EPS Current Change Revenue(M) 0.25 - 194.34 251.39 324.52 Quarterly EPS $0.66 $-0.32 -0.98 Rev % Growth -75.00% - - 29.35% 29.09% Yearly EPS $-1.35 $-1.76 -0.41 EPS $-2.20 $-0.67 $0.03 $0.27 $-1.35 Factor Actual EPS Growth Est EPS Growth Change EPS % Growth 16.67% 69.55% 104.48% 800.00% -600.00% 3-5 year EPS -5.52% 43.00% +48.52 EPS Surprise EPS Quarterly Results Estimate Actual Difference % Difference FY Qtr 1 Qtr 2 Qtr 3 Qtr 4 Total Latest Qtr $-0.34 $-0.43 $-0.09 -26.47 12/09 $0.07 $0.16 $0.14 $-0.09 $0.28 1 Qtr Ago $-0.29 $-0.31 $-0.02 -6.90 12/10 $-0.19 $-1.55 $0.66 $-0.27 $-1.35 2 Qtr Ago $-0.11 $-0.36 $-0.25 -227.27 12/11 $-0.78 $-0.86 - - - 3 Qtr Ago $-0.04 $0.66 $0.70 1750.00 Fiscal Year End Month is December. I want to receive special offers about trading stocks with your brokerage partner, optionsXpress. Click here www.chaikinpowertools.com
- 3. Price Trend & Expert Opinions Price/Volume Activity Price/Volume Activity Rating Relative Strength vs Market Bullish Chaikin Money Flow Price and volume activity for ONXX is bullish. ONXX has outperformed the S&P 500 over 26 weeks and is experiencing sustained buying. Price Trend The rank for ONXX is based on its price strength versus the market, positive Price Trend ROC Chaikin money flow, a positive Chaikin price trend and a decreasing volume trend. Volume Trend Relative Strength vs S&P500 Index Chaikin Money Flow Chart shows whether ONXX is performing better or worse than the market. Chaikin Money Flow analyzes supply and demand for a company's stock. Price Activity Price Activity Volume Activity Factor Value Factor Value Factor Value 52 Week High 45.37 % Change Price - 4 Weeks 0.00% Average Volume 20 Days 694,041 52 Week Low 25.53 % Change Price - 24 Weeks -6.59% Average Volume 90 Days 863,598 % Change YTD Rel S&P 500 -8.33% % Change Price - 4 Wks Rel to S&P 0.93% Chaikin Money Flow Persistency 58% % Change Price - 24 Wks Rel to S&P 6.92% Expert Opinions Expert Opinions Earnings Estimate Revisions Bearish Short Interest Expert opinions about ONXX are negative. Analysts are lowering their EPS estimates for ONXX and short interest in ONXX is high. Insider Activity The rank for ONXX is based on analysts revising earnings estimates downward, a high short interest ratio, insiders purchasing stock, optimistic analyst opinions and Analyst Opinions price strength of the stock versus the Drugs industry group. Relative Strength vs Industry Earnings Estimate Revisions Analyst Recommendations EPS Estimates Revision Summary Current 7 Days Ago % Change Factor Value Last Week Last 4 Weeks Current Qtr -0.32 -0.32 0.00% Mean this Week Buy Up Down Up Down Next Qtr -0.56 -0.56 0.00% Mean Last Week Buy Curr Qtr 0 0 0 0 Curr Yr 0 0 1 0 Current 30 Days Ago % Change Change -0.06 Next Qtr 0 0 0 0 Current FY -1.76 -1.94 0.18 Mean 5 Weeks Ago Buy Next Yr 0 0 0 0 I want to receive special offers about trading stocks with your brokerage partner, optionsXpress. Click here www.chaikinpowertools.com
- 4. The Company & Its Competitors ONXX's Competitors in Drugs News Headlines for ONXX Company Power Historic EPS Projected EPS Profit Margin PEG PE Revenue(M) Pfizer files for US approval of kidney cancer Gauge growth growth drug - Jun 28, 2011 ONXX -5.52% 43.00% -24.19% - - 325 Onyx Pharmaceuticals Receives Fast Track FRX 9.84% -2.00% 26.36% -4.20 6.98 4,420 Designation for Carfilzomib; Company Initiates Rolling NDA Submission for Accelerated WCRX 45.93% 10.78% 4.28% 0.38 4.20 2,974 Approval - Jan 31, 2011 ENDP 15.95% 13.22% 12.13% 0.46 7.08 1,716 Apricus, FDA agree on liver cancer drug study - Nov 22, 2010 SHPGY 17.38% 15.68% 17.66% 1.13 19.71 3,471 SBIO JAK2 Inhibitor 10 18 - Oct 18, 2010 ELN 19.58% - -6.04% - - 1,170 Onyx Pharmaceuticals Provides Status Update VRX 7.07% 16.53% -9.29% 0.86 27.07 1,181 on Carfilzomib - Oct 7, 2010 Company Details Company Profile ONYX PHARMA INC Onyx Pharmaceuticals, Inc is developing innovative products for the treatment of cancer. 249 E. GRAND AVE. SOUTH SAN FRANCISCO, CA 94080 USA Phone: 650-266-0000 Fax: 650-266-0100 Website: http://http://www.onyx- pharm.com/ Full Time Employees: 299 Sector: Medical Power Gauge Ratings are created using a relative ranking system that assigns a rank of 0 to 100 (100 being the highest) to each stock in the universe. Rank is calculated by evaluating each of the stocks factors and combining them into a single number using a weighting formula. A stock's rank ranges from 100-0, where 100 is the strongest, and a rank of 95 indicates the stock is better than 95% of the stocks in the universe. Chaikin Stock Research(CSR) is not registered as a securities broker dealer or investment advisor with either the U.S. Securities and Exchange Commission or with any state securities regulatory authority. CSR is not responsible for trades executed by users of this research report, our web site or mobile app based on the information included herein. The information presented in this report does not represent a recommendation to buy or sell stocks or any financial instrument nor is it intended as an endorsement of any security or investment. The information in this report is generic by nature and is not personalized to the specific financial situation of any individual. The user bears complete responsibility for their own investment research and should seek the advice of a qualified investment professional before making any investment decisions. Copyright (c) 1978-(Present) by ZACKS Investment Research, Inc ("ZACKS"). The information, data, analyses and opinions contained herein (1) includes the confidential and proprietary information of ZACKS, (2) may not be copied or redistributed, for any purpose, (3) does not constitute investment advice offered by ZACKS, (4) are provided solely for informational purposes, and (5) are not warranted or represented to be correct, complete, accurate or timely. ZACKS shall not be responsible for investment decisions, damages or other losses resulting from, or related to, use of this information, data, analyses or opinions. Past performance is no guarantee of future performance. ZACKS is not affiliated with Chaikin Power Tools. This report from Chaikin Power Tools is for informational purposes only and is not a recommendation to buy or sell securities. LM 2.3 DS 3.0 LS 2.1 Data Provided by ZACKS Investment Research, Inc., www.zacks.com Special offers to trade stocks from optionsXpress: www.chaikinpowertools.com