Stock Research Report for Yamana Gold Inc AUY as of 9/22/11 - Chaikin Power Tools
•
0 j'aime•141 vues

To order a free Chaikin Power Gauge stock research report for AUY go to http://www.chaikinpowertools.com/reports

Recommandé
Recommandé
Contenu connexe
Dernier
Dernier (20)
En vedette
En vedette (20)
Stock Research Report for Yamana Gold Inc AUY as of 9/22/11 - Chaikin Power Tools
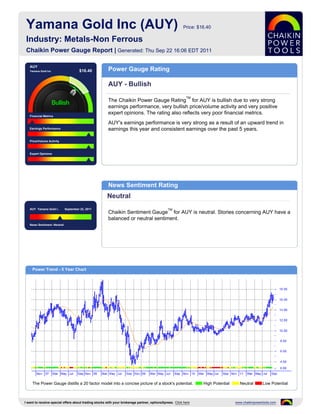
- 1. Yamana Gold Inc (AUY) Price: $16.40 Industry: Metals-Non Ferrous Chaikin Power Gauge Report | Generated: Thu Sep 22 16:06 EDT 2011 AUY Yamana Gold Inc $16.40 Power Gauge Rating AUY - Bullish TM The Chaikin Power Gauge Rating for AUY is bullish due to very strong earnings performance, very bullish price/volume activity and very positive expert opinions. The rating also reflects very poor financial metrics. Financial Metrics AUY's earnings performance is very strong as a result of an upward trend in Earnings Performance earnings this year and consistent earnings over the past 5 years. Price/Volume Activity Expert Opinions News Sentiment Rating Neutral AUY Yamana Gold I.. September 22, 2011 TM Chaikin Sentiment Gauge for AUY is neutral. Stories concerning AUY have a balanced or neutral sentiment. News Sentiment :Neutral Power Trend - 5 Year Chart The Power Gauge distills a 20 factor model into a concise picture of a stock's potential. High Potential Neutral Low Potential I want to receive special offers about trading stocks with your brokerage partner, optionsXpress. Click here www.chaikinpowertools.com
- 2. Financials & Earnings Financial Metrics Financial Metrics Rating LT Debt/Equity Ratio Very Bearish Price to Book Value AUY's financial metrics are very poor. The company generates relatively low free cash flow relative to market capitalization and is carrying too much long term Return on Equity debt. The rank is based on a high long term debt to equity ratio and relatively low cash Price to Sales Ratio flow. Business Value Assets and Liabilities Valuation Returns Ratio TTM Ratio TTM Ratio TTM Current Ratio 2.75 Price/Book 1.66 Return on Invest 8.1% LT Debt/Equity 0.07 Price/Sales 7.25 Return on Equity 8.7% Earnings Performance Earnings Performance Rating Earnings Growth Very Bullish Earnings Surprise AUY's earnings performance has been very strong. The company experienced superior earnings growth in the past 12 months and has a stable 5 year earnings trend. Earnings Trend The rank is based on an upward trend in earnings this year and consistent Projected P/E Ratio earnings over the past 5 years. Earnings Consistency 5 Year Revenue and Earnings Growth EPS Estimates 12/06 12/07 12/08 12/09 12/10 Factor Actual EPS Prev EST EPS Current Change Revenue(M) 169.21 747.09 1,054.61 1,183.31 1,686.80 Quarterly EPS $0.17 $0.27 +0.10 Rev % Growth 267.54% 341.53% 41.16% 12.20% 42.55% Yearly EPS $0.61 $1.02 +0.41 EPS $-0.25 $0.38 $0.63 $0.29 $0.61 Factor Actual EPS Growth Est EPS Growth Change EPS % Growth -733.33% 252.00% 65.79% -53.97% 110.34% 3-5 year EPS 141.00% 13.50% -127.50 EPS Surprise EPS Quarterly Results Estimate Actual Difference % Difference FY Qtr 1 Qtr 2 Qtr 3 Qtr 4 Total Latest Qtr $0.24 $0.25 $0.01 4.17 12/09 $0.12 $0.01 $0.08 $0.05 $0.26 1 Qtr Ago $0.22 $0.20 $-0.02 -9.09 12/10 $0.11 $0.12 $0.17 $0.22 $0.62 2 Qtr Ago $0.21 $0.23 $0.02 9.52 12/11 $0.20 $0.26 - - - 3 Qtr Ago $0.15 $0.16 $0.01 6.67 Fiscal Year End Month is December. I want to receive special offers about trading stocks with your brokerage partner, optionsXpress. Click here www.chaikinpowertools.com
- 3. Price Trend & Expert Opinions Price/Volume Activity Price/Volume Activity Rating Relative Strength vs Market Very Bullish Chaikin Money Flow Price and volume activity for AUY is very bullish. AUY has outperformed the S&P 500 over 26 weeks and has a rising price trend. Price Trend The rank for AUY is based on its price strength versus the market, positive Price Trend ROC Chaikin money flow, a positive Chaikin price trend, a negative Chaikin price trend ROC and an increasing volume trend. Volume Trend Relative Strength vs S&P500 Index Chaikin Money Flow Chart shows whether AUY is performing better or worse than the market. Chaikin Money Flow analyzes supply and demand for a company's stock. Price Activity Price Activity Volume Activity Factor Value Factor Value Factor Value 52 Week High 17.39 % Change Price - 4 Weeks 9.12% Average Volume 20 Days 12,044,977 52 Week Low 10.60 % Change Price - 24 Weeks 26.35% Average Volume 90 Days 10,587,996 % Change YTD Rel S&P 500 30.41% % Change Price - 4 Wks Rel to S&P 10.13% Chaikin Money Flow Persistency 50% % Change Price - 24 Wks Rel to S&P 44.62% Expert Opinions Expert Opinions Earnings Estimate Revisions Very Bullish Short Interest Expert opinions about AUY are very positive. Analysts are raising their EPS estimates for AUY and shorting of AUY is low. Insider Activity The rank for AUY is based on analysts revising earnings estimates upward, a low short interest ratio, optimistic analyst opinions and price strength of the stock Analyst Opinions versus the Metals-Non Ferrous industry group. Relative Strength vs Industry Earnings Estimate Revisions Analyst Recommendations EPS Estimates Revision Summary Current 7 Days Ago % Change Factor Value Last Week Last 4 Weeks Current Qtr 0.27 0.27 0.00% Mean this Week Buy Up Down Up Down Next Qtr 0.30 0.30 0.00% Mean Last Week Buy Curr Qtr 0 0 2 0 Curr Yr 0 0 4 0 Current 30 Days Ago % Change Change 0.00 Next Qtr 0 0 2 0 Current FY 1.02 1.00 0.02 Mean 5 Weeks Ago Buy Next Yr 0 0 5 0 I want to receive special offers about trading stocks with your brokerage partner, optionsXpress. Click here www.chaikinpowertools.com
- 4. The Company & Its Competitors AUY's Competitors in Metals-Non Ferrous News Headlines for AUY Company Power Historic EPS Projected EPS Profit Margin PEG PE Revenue(M) Yamana Provides Notice of Second Quarter Gauge growth growth Financial Results - Jul 12, 2011 AUY 141.00% 13.50% 30.61% 1.19 19.52 1,687 YAMANA GOLD INC - Yamana Acquires Shares VALE 37.13% -2.40% 43.83% -2.05 5.54 45,293 of Aura Minerals - Mar 24, 2011 YAMANA ACQUIRES SHARES OF AURA BBL 10.29% 14.58% - 0.48 - 71,739 MINERALS - Mar 23, 2011 BHP 15.41% 16.16% - 0.50 - 71,739 Tara Minerals Announces Cancellation of Tentative Merger Agreement With Tara Gold RIO 26.89% 16.81% - 0.35 - 56,576 Resources - Mar 7, 2011 TCK 22.54% 9.20% 18.33% 0.72 9.03 9,452 Company Details Company Profile YAMANA GOLD INC Yamana Gold is a Canadian gold producer with significant gold production, gold and 150 YORK ST copper-gold development stage properties, exploration properties and land positions in all TORONTO, A6 major mineral areas in Brazil. CAN Phone: 4168150220 Fax: 416-815-0021 Website: http://http://www.yamana.com/ Full Time Employees: 1,124 Sector: Basic Materials Power Gauge Ratings are created using a relative ranking system that assigns a rank of 0 to 100 (100 being the highest) to each stock in the universe. Rank is calculated by evaluating each of the stocks factors and combining them into a single number using a weighting formula. A stock's rank ranges from 100-0, where 100 is the strongest, and a rank of 95 indicates the stock is better than 95% of the stocks in the universe. Chaikin Stock Research(CSR) is not registered as a securities broker dealer or investment advisor with either the U.S. Securities and Exchange Commission or with any state securities regulatory authority. CSR is not responsible for trades executed by users of this research report, our web site or mobile app based on the information included herein. The information presented in this report does not represent a recommendation to buy or sell stocks or any financial instrument nor is it intended as an endorsement of any security or investment. The information in this report is generic by nature and is not personalized to the specific financial situation of any individual. The user bears complete responsibility for their own investment research and should seek the advice of a qualified investment professional before making any investment decisions. Copyright (c) 1978-(Present) by ZACKS Investment Research, Inc ("ZACKS"). The information, data, analyses and opinions contained herein (1) includes the confidential and proprietary information of ZACKS, (2) may not be copied or redistributed, for any purpose, (3) does not constitute investment advice offered by ZACKS, (4) are provided solely for informational purposes, and (5) are not warranted or represented to be correct, complete, accurate or timely. ZACKS shall not be responsible for investment decisions, damages or other losses resulting from, or related to, use of this information, data, analyses or opinions. Past performance is no guarantee of future performance. ZACKS is not affiliated with Chaikin Power Tools. This report from Chaikin Power Tools is for informational purposes only and is not a recommendation to buy or sell securities. LM 2.3 DS 3.0 LS 2.1 Data Provided by ZACKS Investment Research, Inc., www.zacks.com Special offers to trade stocks from optionsXpress: www.chaikinpowertools.com