Stock Research Report for Yamana Gold Inc EWBC as of 11/17/11 - Chaikin Power Tools
•
1 j'aime•172 vues

To order a Chaikin Power Gauge stock research report for EWBC go to http://www.chaikinpowertools.com/reports

Recommandé
Contenu connexe
En vedette
En vedette (14)
Plus de Dan Oconnor
Plus de Dan Oconnor (10)
Dernier
Dernier (20)
Stock Research Report for Yamana Gold Inc EWBC as of 11/17/11 - Chaikin Power Tools
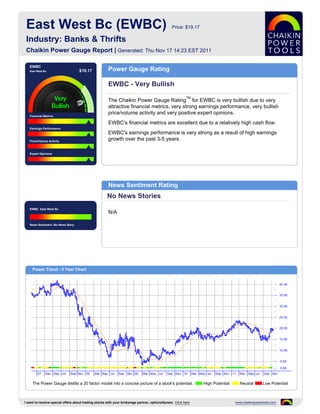
- 1. East West Bc (EWBC) Price: $19.17 Industry: Banks & Thrifts Chaikin Power Gauge Report | Generated: Thu Nov 17 14:23 EST 2011 EWBC East West Bc $19.17 Power Gauge Rating EWBC - Very Bullish TM The Chaikin Power Gauge Rating for EWBC is very bullish due to very attractive financial metrics, very strong earnings performance, very bullish price/volume activity and very positive expert opinions. Financial Metrics EWBC's financial metrics are excellent due to a relatively high cash flow. Earnings Performance EWBC's earnings performance is very strong as a result of high earnings Price/Volume Activity growth over the past 3-5 years. Expert Opinions News Sentiment Rating No News Stories EWBC East West Bc N/A News Sentiment :No News Story Power Trend - 5 Year Chart The Power Gauge distills a 20 factor model into a concise picture of a stock's potential. High Potential Neutral Low Potential I want to receive special offers about trading stocks with your brokerage partner, optionsXpress. Click here www.chaikinpowertools.com
- 2. Financials & Earnings Financial Metrics Financial Metrics Rating LT Debt/Equity Ratio Very Bullish Price to Book Value EWBC's financial metrics are excellent. The company generates high free cash flow relative to market capitalization and may be undervalued. Return on Equity The rank is based on a low price to book value, low price to sales ratio and relatively high cash flow. Price to Sales Ratio Business Value Assets and Liabilities Valuation Returns Ratio TTM Ratio TTM Ratio TTM Current Ratio 0.87 Price/Book 1.31 Return on Invest 7.4% LT Debt/Equity 0.71 Price/Sales 2.52 Return on Equity 11.1% Earnings Performance Earnings Performance Rating Earnings Growth Very Bullish Earnings Surprise EWBC's earnings performance has been very strong. The company has a history of strong earnings growth and has a stable 5 year earnings trend. Earnings Trend The rank is based on high earnings growth over the past 3-5 years, better than expected earnings in recent quarters, a relatively poor trend in earnings this year, Projected P/E Ratio a relatively low projected P/E ratio and consistent earnings over the past 5 years. Earnings Consistency 5 Year Revenue and Earnings Growth EPS Estimates 12/06 12/07 12/08 12/09 12/10 Factor Actual EPS Prev EST EPS Current Change Revenue(M) 694.41 824.88 639.80 1,119.36 1,135.10 Quarterly EPS $0.22 $0.41 +0.19 Rev % Growth 57.44% 18.79% -22.44% 74.96% 1.41% Yearly EPS $0.88 $1.58 +0.70 EPS $2.40 $2.63 $-0.94 $0.35 $0.88 Factor Actual EPS Growth Est EPS Growth Change EPS % Growth 18.23% 9.58% -135.74% 137.23% 151.43% 3-5 year EPS 26.03% 9.25% -16.78 EPS Surprise EPS Quarterly Results Estimate Actual Difference % Difference FY Qtr 1 Qtr 2 Qtr 3 Qtr 4 Total Latest Qtr $0.39 $0.41 $0.02 5.13 12/09 $-0.50 $-1.83 $-0.91 $2.49 $-0.75 1 Qtr Ago $0.37 $0.39 $0.02 5.41 12/10 $0.17 $0.21 $0.27 $0.22 $0.87 2 Qtr Ago $0.34 $0.37 $0.03 8.82 12/11 $0.37 $0.40 $0.41 - - 3 Qtr Ago $0.29 $0.22 $-0.07 -24.14 Fiscal Year End Month is December. I want to receive special offers about trading stocks with your brokerage partner, optionsXpress. Click here www.chaikinpowertools.com
- 3. Price Trend & Expert Opinions Price/Volume Activity Price/Volume Activity Rating Relative Strength vs Market Very Bullish Chaikin Money Flow Price and volume activity for EWBC is very bullish. EWBC is trading on higher volume than its 90 day average volume and has outperformed the S&P 500 over Price Trend 26 weeks. Price Trend ROC The rank for EWBC is based on its price strength versus the market, positive Chaikin money flow, a positive Chaikin price trend, a negative Chaikin price trend ROC and an increasing volume trend. Volume Trend Relative Strength vs S&P500 Index Chaikin Money Flow Chart shows whether EWBC is performing better or worse than the market. Chaikin Money Flow analyzes supply and demand for a company's stock. Price Activity Price Activity Volume Activity Factor Value Factor Value Factor Value 52 Week High 23.64 % Change Price - 4 Weeks 14.30% Average Volume 20 Days 2,101,511 52 Week Low 14.23 % Change Price - 24 Weeks 1.78% Average Volume 90 Days 1,623,578 % Change YTD Rel S&P 500 0.22% % Change Price - 4 Wks Rel to S&P 11.80% Chaikin Money Flow Persistency 57% % Change Price - 24 Wks Rel to S&P 8.17% Expert Opinions Expert Opinions Earnings Estimate Revisions Very Bullish Short Interest Expert opinions about EWBC are very positive. Insiders are net buyers of EWBC's stock and analysts's opinions on EWBC have been more positive Insider Activity recently. The rank for EWBC is based on a low short interest ratio, insiders purchasing Analyst Opinions stock, optimistic analyst opinions and price strength of the stock versus the Banks & Thrifts industry group. Relative Strength vs Industry Earnings Estimate Revisions Analyst Recommendations EPS Estimates Revision Summary Current 7 Days Ago % Change Factor Value Last Week Last 4 Weeks Current Qtr 0.41 0.41 0.00% Mean this Week Buy Up Down Up Down Next Qtr 0.42 0.42 0.00% Mean Last Week Buy Curr Qtr 0 0 7 1 Curr Yr 0 0 12 1 Current 30 Days Ago % Change Change 0.00 Next Qtr 0 1 4 5 Current FY 1.57 1.55 0.02 Mean 5 Weeks Ago Buy Next Yr 0 0 5 2 I want to receive special offers about trading stocks with your brokerage partner, optionsXpress. Click here www.chaikinpowertools.com
- 4. The Company & Its Competitors EWBC's Competitors in Banks & Thrifts News Headlines for EWBC Company Power Historic EPS Projected EPS Profit Margin PEG PE Revenue(M) No significant news stories at this time. Gauge growth growth EWBC 26.03% 9.25% 21.31% 1.32 13.80 1,135 UMPQ 12.57% 11.00% 10.36% 1.69 21.74 564 CATY 14.49% 8.00% 17.45% 1.55 13.78 522 ZION 5.27% 8.20% 5.94% 2.22 - 2,760 GBCI 10.64% 9.50% 3.39% 2.54 18.92 376 SIVB 12.01% 11.28% 16.77% 1.20 12.76 709 CYN 5.89% 8.83% 14.21% 1.48 13.49 1,192 BOH 0.36% 7.80% 24.95% 1.60 12.39 721 Company Details Company Profile EAST WEST BC East West Bancorp, Inc. is the holding company for East West Bank, East West Capital 135 N. LOS ROBLES AVE. 7TH Trust I, East West Capital Trust II and Risk Services, Inc. FLOOR PASADENA, CA 91101 USA Phone: 6267686000 Website: http://http://www.eastwestbank.com Full Time Employees: 2,131 Sector: Finance Power Gauge Ratings are created using a relative ranking system that assigns a rank of 0 to 100 (100 being the highest) to each stock in the universe. Rank is calculated by evaluating each of the stocks factors and combining them into a single number using a weighting formula. A stock's rank ranges from 100-0, where 100 is the strongest, and a rank of 95 indicates the stock is better than 95% of the stocks in the universe. Chaikin Stock Research(CSR) is not registered as a securities broker dealer or investment advisor with either the U.S. Securities and Exchange Commission or with any state securities regulatory authority. CSR is not responsible for trades executed by users of this research report, our web site or mobile app based on the information included herein. The information presented in this report does not represent a recommendation to buy or sell stocks or any financial instrument nor is it intended as an endorsement of any security or investment. The information in this report is generic by nature and is not personalized to the specific financial situation of any individual. The user bears complete responsibility for their own investment research and should seek the advice of a qualified investment professional before making any investment decisions. Copyright (c) 1978-(Present) by ZACKS Investment Research, Inc ("ZACKS"). The information, data, analyses and opinions contained herein (1) includes the confidential and proprietary information of ZACKS, (2) may not be copied or redistributed, for any purpose, (3) does not constitute investment advice offered by ZACKS, (4) are provided solely for informational purposes, and (5) are not warranted or represented to be correct, complete, accurate or timely. ZACKS shall not be responsible for investment decisions, damages or other losses resulting from, or related to, use of this information, data, analyses or opinions. Past performance is no guarantee of future performance. ZACKS is not affiliated with Chaikin Power Tools. This report from Chaikin Power Tools is for informational purposes only and is not a recommendation to buy or sell securities. LM 2.3 DS 3.0 LS 2.1 Data Provided by ZACKS Investment Research, Inc., www.zacks.com Special offers to trade stocks from optionsXpress: www.chaikinpowertools.com