Contenu connexe
Similaire à H W 2010 Q3 De 12 Mo
Similaire à H W 2010 Q3 De 12 Mo (20)
H W 2010 Q3 De 12 Mo
- 1. A.L. Wagner Appraisal Group
Presents
THE CHICAGOLAND QUARTERLY HOUSING REPORT
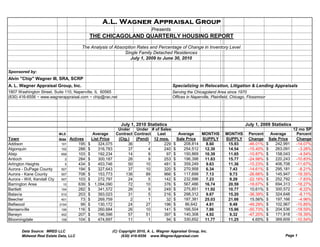
The Analysis of Absorption Rates and Percentage of Change in Inventory Level
Single Family Detached Residences
July 1, 2009 to June 30, 2010
Sponsored by:
Alvin "Chip" Wagner III, SRA, SCRP
A. L. Wagner Appraisal Group, Inc. Specializing in Relocation, Litigation & Lending Appraisals
1807 Washington Street, Suite 110, Naperville, IL 60565 Serving the Chicagoland Area since 1970
(630) 416-6556 ~ www.wagnerappraisal.com ~ chip@rac.net Offices in Naperville, Plainfield, Chicago, Flossmoor
July 1, 2010 Statistics July 1, 2009 Statistics
Under Under # of Sales 12 mo SP
MLS Average Contract Contract Last Average MONTHS MONTHS Percent Average Percent
Town Area Actives List Price (Ctg.) (Pend) 12 mos. Sale Price SUPPLY SUPPLY Change Sale Price Change
Addison 101 195 $ 324,075 36 7 229 $ 208,814 8.60 15.93 -46.01% $ 242,991 -14.07%
Algonquin 102 288 $ 316,783 37 4 240 $ 254,512 12.30 14.54 -15.40% $ 263,091 -3.26%
Alsip 658 103 $ 192,234 14 8 97 $ 150,869 10.39 11.65 -10.87% $ 158,043 -4.54%
Antioch 2 284 $ 300,187 26 9 253 $ 196,398 11.83 15.77 -24.98% $ 220,243 -10.83%
Arlington Heights 5 434 $ 453,746 50 10 481 $ 359,249 9.63 11.36 -15.23% $ 406,708 -11.67%
Aurora - DuPage County 507 194 $ 327,643 37 10 320 $ 270,958 6.34 7.43 -14.61% $ 295,181 -8.21%
Aurora - Kane County 507 708 $ 153,773 136 89 966 $ 117,699 7.13 9.73 -26.66% $ 145,947 -19.35%
Aurora - Will, Kendall Cty 507 103 $ 272,797 24 5 142 $ 232,996 7.23 9.29 -22.18% $ 252,792 -7.83%
Barrington Area 10 639 $ 1,094,090 72 10 376 $ 567,486 16.74 20.59 -18.67% $ 694,313 -18.27%
Bartlett 104 282 $ 341,572 26 9 249 $ 275,851 11.92 10.77 10.61% $ 300,572 -8.22%
Batavia 510 203 $ 393,023 31 5 216 $ 298,312 9.67 15.20 -36.39% $ 324,648 -8.11%
Beecher 401 73 $ 269,759 2 1 32 $ 187,381 25.03 21.66 15.56% $ 197,166 -4.96%
Bellwood 2104 99 $ 130,172 24 27 196 $ 86,642 4.81 9.49 -49.29% $ 102,967 -15.85%
Bensenville 106 116 $ 260,684 26 10 141 $ 166,504 7.86 15.96 -50.73% $ 204,536 -18.59%
Berwyn 402 207 $ 196,596 57 51 397 $ 140,308 4.92 9.32 -47.20% $ 171,918 -18.39%
Bloomingdale 108 104 $ 474,697 11 1 94 $ 330,652 11.77 11.25 4.65% $ 369,609 -10.54%
Data Source: MRED LLC (C) Copyright 2010, A. L. Wagner Appraisal Group, Inc.
Midwest Real Estate Data, LLC (630) 416-6556 www.WagnerAppraisal.com Page 1
- 2. July 1, 2010 Statistics July 1, 2009 Statistics
Under Under # of Sales 12 mo SP
MLS Average Contract Contract Last Average MONTHS MONTHS Percent Average Percent
Town Area Actives List Price (Ctg.) (Pend) 12 mos. Sale Price SUPPLY SUPPLY Change Sale Price Change
Blue Island 406 99 $ 126,927 17 16 80 $ 90,532 10.51 11.59 -9.30% $ 103,174 -12.25%
Bolingbrook 440 415 $ 236,635 87 31 574 $ 191,757 7.20 9.26 -22.32% $ 215,345 -10.95%
Bridgeview 455 47 $ 210,321 12 8 59 $ 177,632 7.14 10.95 -34.79% $ 200,133 -11.24%
Broadview 155 52 $ 173,498 10 6 73 $ 105,949 7.01 11.13 -37.01% $ 129,710 -18.32%
Brookfield 513 97 $ 242,612 18 6 164 $ 216,367 6.19 10.76 -42.43% $ 243,520 -11.15%
Buffalo Grove 89 172 $ 419,879 43 12 255 $ 365,115 6.66 9.43 -29.38% $ 379,478 -3.78%
Burbank 454 173 $ 216,537 45 16 212 $ 185,362 7.60 13.92 -45.36% $ 200,189 -7.41%
Burnham 633 14 $ 81,079 2 4 31 $ 47,089 4.54 10.62 -57.23% $ 60,068 -21.61%
Burr Ridge 522 193 $ 1,339,566 18 0 92 $ 795,101 21.05 29.49 -28.61% $ 794,093 0.13%
Calumet City 409 239 $ 96,873 34 46 329 $ 63,121 7.01 10.04 -30.14% $ 67,095 -5.92%
Calumet Park 643 39 $ 84,526 2 12 67 $ 51,901 5.78 5.85 -1.17% $ 65,506 -20.77%
Carol Stream 188 159 $ 268,684 22 5 159 $ 230,630 10.26 8.49 20.88% $ 251,266 -8.21%
Carpentersville 110 279 $ 170,964 65 24 315 $ 118,628 8.29 10.63 -22.05% $ 143,212 -17.17%
Cary 13 225 $ 355,278 19 2 209 $ 232,460 11.74 14.38 -18.34% $ 272,381 -14.66%
Channahon 410 110 $ 273,167 12 3 103 $ 203,293 11.19 14.72 -24.01% $ 223,081 -8.87%
Chicago Heights 411 184 $ 111,493 27 28 249 $ 61,488 7.26 10.20 -28.81% $ 60,690 1.31%
Chicago Ridge 415 42 $ 225,952 3 3 36 $ 174,288 12.00 5.76 108.33% $ 187,331 -6.96%
Cicero 650 189 $ 123,196 57 70 364 $ 93,474 4.62 9.62 -52.00% $ 108,458 -13.81%
Clarendon Hills 514 77 $ 631,844 13 1 108 $ 538,421 7.57 12.99 -41.69% $ 614,482 -12.38%
Country Club Hills 478 125 $ 144,023 29 34 214 $ 94,870 5.42 9.41 -42.45% $ 124,478 -23.79%
Countryside 527 27 $ 407,057 5 3 24 $ 255,397 10.13 22.11 -54.20% $ 351,878 -27.42%
Crestwood 446 43 $ 218,635 4 2 30 $ 186,256 14.33 9.27 54.58% $ 203,676 -8.55%
Crete 417 150 $ 254,339 16 15 137 $ 156,048 10.71 12.35 -13.25% $ 175,513 -11.09%
Crystal Lake (& Lakewood) 14 537 $ 367,922 91 18 505 $ 242,266 10.50 13.75 -23.68% $ 271,919 -10.91%
Darien 562 101 $ 426,036 9 1 110 $ 314,150 10.10 9.76 3.52% $ 337,551 -6.93%
Deerfield 15 169 $ 661,059 21 11 163 $ 515,252 10.40 13.94 -25.38% $ 580,771 -11.28%
Des Plaines 16 353 $ 354,227 63 14 371 $ 235,470 9.46 11.67 -18.97% $ 264,593 -11.01%
Dolton 419 164 $ 86,533 27 52 300 $ 49,447 5.19 7.99 -34.99% $ 62,264 -20.58%
Downers Grove 515 419 $ 491,087 47 8 407 $ 361,729 10.88 12.94 -15.86% $ 429,133 -15.71%
Elgin 123 829 $ 248,596 168 67 879 $ 169,705 8.93 14.31 -37.60% $ 191,523 -11.39%
Elk Grove Village 7 156 $ 307,701 20 4 161 $ 258,006 10.12 12.25 -17.42% $ 298,582 -13.59%
Elmhurst 126 326 $ 541,915 52 5 393 $ 423,983 8.69 10.04 -13.41% $ 457,224 -7.27%
Elmwood Park 635 144 $ 274,505 22 18 172 $ 201,455 8.15 10.79 -24.48% $ 239,647 -15.94%
Evanston 201 255 $ 695,166 62 23 376 $ 466,302 6.64 8.65 -23.24% $ 544,205 -14.32%
Evergreen Park 642 144 $ 199,973 13 12 176 $ 165,581 8.60 9.67 -11.08% $ 180,155 -8.09%
Flossmoor 422 125 $ 378,289 7 6 126 $ 221,654 10.79 14.22 -24.09% $ 264,383 -16.16%
Data Source: MRED LLC (C) Copyright 2010, A. L. Wagner Appraisal Group, Inc.
Midwest Real Estate Data, LLC (630) 416-6556 www.WagnerAppraisal.com Page 2
- 3. July 1, 2010 Statistics July 1, 2009 Statistics
Under Under # of Sales 12 mo SP
MLS Average Contract Contract Last Average MONTHS MONTHS Percent Average Percent
Town Area Actives List Price (Ctg.) (Pend) 12 mos. Sale Price SUPPLY SUPPLY Change Sale Price Change
Forest Park 130 50 $ 272,622 6 1 53 $ 234,577 10.00 12.00 -16.67% $ 262,739 -10.72%
Fox Lake 20 90 $ 295,637 6 4 57 $ 153,802 16.12 22.08 -27.00% $ 201,683 -23.74%
Fox River Grove 21 59 $ 303,953 4 1 35 $ 228,144 17.70 13.89 27.39% $ 302,187 -24.50%
Frankfort 423 269 $ 478,459 22 5 249 $ 336,407 11.70 14.83 -21.13% $ 351,942 -4.41%
Franklin Park 131 106 $ 208,220 26 14 172 $ 144,873 6.00 17.11 -64.94% $ 176,161 -17.76%
Geneva 134 229 $ 468,486 45 1 308 $ 344,307 7.76 10.44 -25.63% $ 368,749 -6.63%
Glen Ellyn 137 311 $ 565,931 49 5 334 $ 425,122 9.62 14.02 -31.40% $ 447,388 -4.98%
Glencoe 22 132 $ 1,749,959 12 10 106 $ 1,058,964 12.38 15.89 -22.12% $ 1,178,364 -10.13%
Glendale Heights 139 125 $ 216,860 43 9 225 $ 157,658 5.42 9.45 -42.71% $ 177,350 -11.10%
Glenview 25 393 $ 750,008 58 30 396 $ 593,103 9.74 14.86 -34.44% $ 637,718 -7.00%
Glenwood 425 39 $ 146,818 5 14 95 $ 106,005 4.11 8.65 -52.51% $ 107,941 -1.79%
Gurnee 31 265 $ 339,251 35 6 266 $ 274,292 10.36 11.43 -9.40% $ 305,489 -10.21%
Hanover Park 103 135 $ 199,428 35 11 190 $ 161,990 6.86 7.96 -13.81% $ 183,336 -11.64%
Harvey 426 157 $ 57,510 8 28 244 $ 22,648 6.73 8.00 -15.89% $ 24,476 -7.47%
Harwood Heights 656 57 $ 303,028 12 2 38 $ 259,632 13.15 14.61 -9.96% $ 241,611 7.46%
Hazel Crest 429 98 $ 116,258 9 22 146 $ 74,712 6.64 8.74 -23.99% $ 77,470 -3.56%
Hickory Hills 457 65 $ 254,611 8 2 68 $ 216,061 10.00 12.79 -21.79% $ 242,783 -11.01%
Highland Park 35 312 $ 977,704 45 10 297 $ 612,314 10.64 18.43 -42.29% $ 704,442 -13.08%
Hillside 162 48 $ 168,142 18 3 52 $ 135,448 7.89 10.89 -27.54% $ 172,428 -21.45%
Hinkley 520 23 $ 237,204 3 0 12 $ 158,979 18.40 21.18 -13.11% $ 233,192 -31.82%
Hinsdale 521 236 $ 1,277,187 34 6 261 $ 936,239 9.41 16.37 -42.52% $ 1,059,768 -11.66%
Hoffman Estates 194 207 $ 331,446 40 15 272 $ 285,557 7.60 9.15 -16.95% $ 306,555 -6.85%
Homer Glen 500 232 $ 495,279 19 6 154 $ 346,979 15.55 22.84 -31.89% $ 351,347 -1.24%
Homewood 430 121 $ 179,750 23 11 204 $ 148,224 6.10 7.58 -19.47% $ 164,212 -9.74%
Indian Head Park 531 14 $ 486,071 2 0 9 $ 503,367 15.27 36.00 -57.58% $ 614,750 -18.12%
Inverness 7167 110 $ 991,911 16 2 56 $ 630,566 17.84 20.82 -14.31% $ 659,113 -4.33%
Itasca 143 56 $ 524,612 4 1 57 $ 328,875 10.84 32.13 -66.27% $ 325,717 0.97%
Joliet 499 707 $ 165,724 114 72 902 $ 125,619 7.80 10.58 -26.30% $ 142,558 -11.88%
Justice 458 39 $ 220,232 4 2 43 $ 148,876 9.55 13.85 -31.02% $ 197,172 -24.49%
Kenilworth 43 47 $ 2,076,794 2 3 35 $ 1,380,334 14.10 39.79 -64.56% $ 2,173,038 -36.48%
LaGrange Park 526 64 $ 374,519 13 2 91 $ 346,835 7.25 5.54 30.82% $ 344,341 0.72%
LaGrange 525 111 $ 618,088 10 6 161 $ 428,933 7.53 8.33 -9.69% $ 501,872 -14.53%
Lake Bluff 44 108 $ 1,285,643 17 5 81 $ 606,256 12.58 22.63 -44.40% $ 638,971 -5.12%
Lake Forest 45 352 $ 1,847,948 36 13 201 $ 1,014,022 16.90 25.37 -33.41% $ 1,174,352 -13.65%
Lake In The Hills 156 173 $ 299,234 40 10 239 $ 215,671 7.18 7.35 -2.33% $ 208,749 3.32%
Lake Villa & Lindenhurst 46 289 $ 298,507 50 10 292 $ 229,577 9.85 12.48 -21.06% $ 253,358 -9.39%
Data Source: MRED LLC (C) Copyright 2010, A. L. Wagner Appraisal Group, Inc.
Midwest Real Estate Data, LLC (630) 416-6556 www.WagnerAppraisal.com Page 3
- 4. July 1, 2010 Statistics July 1, 2009 Statistics
Under Under # of Sales 12 mo SP
MLS Average Contract Contract Last Average MONTHS MONTHS Percent Average Percent
Town Area Actives List Price (Ctg.) (Pend) 12 mos. Sale Price SUPPLY SUPPLY Change Sale Price Change
Lansing 438 281 $ 143,339 22 25 244 $ 102,731 11.59 12.98 -10.72% $ 116,736 -12.00%
Lemont 439 186 $ 518,213 19 7 131 $ 358,506 14.22 19.87 -28.45% $ 412,937 -13.18%
Libertyville & Green Oaks 48 285 $ 655,389 32 3 248 $ 461,860 12.08 14.94 -19.10% $ 503,222 -8.22%
Lincolnshire 69 92 $ 716,741 22 5 65 $ 589,062 12.00 16.80 -28.57% $ 551,377 6.83%
Lincolnwood 645 111 $ 649,443 32 8 103 $ 386,036 9.31 16.17 -42.39% $ 471,167 -18.07%
Lisle 532 146 $ 422,305 16 0 114 $ 340,694 13.48 11.43 17.92% $ 357,419 -4.68%
Lockport 495 238 $ 280,094 39 15 246 $ 198,788 9.52 14.22 -33.03% $ 224,876 -11.60%
Lombard 148 283 $ 308,216 36 10 289 $ 246,711 10.14 9.07 11.81% $ 280,531 -12.06%
Lynwood 5411 74 $ 233,133 10 9 65 $ 169,491 10.57 12.71 -16.80% $ 202,197 -16.18%
Lyons 534 51 $ 181,989 11 7 79 $ 127,695 6.31 12.55 -49.71% $ 155,825 -18.05%
Markham 4426 105 $ 86,024 8 29 163 $ 48,815 6.30 7.23 -12.92% $ 54,972 -11.20%
Matteson 443 130 $ 203,841 33 14 220 $ 158,112 5.84 8.36 -30.13% $ 178,960 -11.65%
Maywood 153 132 $ 115,027 25 29 179 $ 67,767 6.80 9.39 -27.57% $ 75,403 -10.13%
Medinah 157 32 $ 468,396 3 1 32 $ 278,831 10.67 16.91 -36.92% $ 400,283 -30.34%
Melrose Park 160 78 $ 204,787 21 14 106 $ 127,801 6.64 14.40 -53.90% $ 166,247 -23.13%
McHenry 50 606 $ 292,575 63 16 447 $ 180,253 13.83 16.28 -15.06% $ 198,663 -9.27%
Minooka 447 121 $ 298,118 8 9 94 $ 185,050 13.08 14.91 -12.24% $ 206,412 -10.35%
Midlothian 445 80 $ 168,107 9 6 114 $ 137,440 7.44 10.11 -26.36% $ 139,875 -1.74%
Mokena 448 153 $ 433,983 20 5 118 $ 318,303 12.84 11.63 10.36% $ 368,754 -13.68%
Monee 449 79 $ 410,441 9 5 82 $ 214,969 9.88 10.30 -4.13% $ 225,436 -4.64%
Montgomery 538 180 $ 198,980 32 16 327 $ 161,997 5.76 7.04 -18.13% $ 191,199 -15.27%
Morton Grove 53 134 $ 373,680 28 11 189 $ 279,004 7.05 11.11 -36.49% $ 329,029 -15.20%
Mt. Prospect 56 230 $ 367,433 48 7 330 $ 295,549 7.17 10.35 -30.73% $ 324,742 -8.99%
Mundelein 60 304 $ 339,597 45 10 270 $ 248,098 11.22 14.78 -24.04% $ 250,586 -0.99%
Naperville 540 955 $ 609,918 195 20 1,241 $ 434,456 7.87 9.75 -19.23% $ 463,915 -6.35%
New Lenox 451 222 $ 349,110 20 9 211 $ 261,417 11.10 14.04 -20.94% $ 310,559 -15.82%
Niles 648 130 $ 366,981 24 6 170 $ 282,739 7.80 12.08 -35.41% $ 322,988 -12.46%
Norridge 634 84 $ 403,696 14 3 136 $ 285,421 6.59 12.60 -47.71% $ 284,242 0.41%
North Aurora 542 123 $ 287,453 20 4 157 $ 242,673 8.15 12.97 -37.13% $ 277,025 -12.40%
North Chicago 64 66 $ 97,153 11 8 68 $ 51,646 9.10 9.74 -6.56% $ 69,300 -25.48%
North Riverside 547 37 $ 237,685 5 1 45 $ 219,151 8.71 6.86 26.96% $ 225,144 -2.66%
Northbrook 62 299 $ 762,642 53 13 320 $ 525,209 9.30 13.18 -29.50% $ 618,809 -15.13%
Northfield 7193 71 $ 1,038,452 5 4 47 $ 726,343 15.21 25.80 -41.03% $ 914,727 -20.59%
Northlake 164 59 $ 176,776 13 17 118 $ 129,431 4.78 13.01 -63.24% $ 160,176 -19.19%
Oak Brook 523 121 $ 1,730,452 9 5 56 $ 1,069,920 20.74 34.36 -39.64% $ 1,280,601 -16.45%
Oak Forest 452 119 $ 227,798 23 11 194 $ 177,843 6.26 8.84 -29.11% $ 179,402 -0.87%
Data Source: MRED LLC (C) Copyright 2010, A. L. Wagner Appraisal Group, Inc.
Midwest Real Estate Data, LLC (630) 416-6556 www.WagnerAppraisal.com Page 4
- 5. July 1, 2010 Statistics July 1, 2009 Statistics
Under Under # of Sales 12 mo SP
MLS Average Contract Contract Last Average MONTHS MONTHS Percent Average Percent
Town Area Actives List Price (Ctg.) (Pend) 12 mos. Sale Price SUPPLY SUPPLY Change Sale Price Change
Oak Lawn 453 253 $ 252,215 41 13 361 $ 203,356 7.32 10.62 -31.08% $ 209,746 -3.05%
Oak Park 302 222 $ 504,002 53 18 363 $ 409,432 6.14 6.74 -8.93% $ 447,515 -8.51%
Olympia Fields 461 55 $ 272,263 6 8 54 $ 203,693 9.71 11.83 -17.93% $ 193,091 5.49%
Orland Park 462 298 $ 473,527 39 8 314 $ 344,456 9.91 10.67 -7.20% $ 369,803 -6.85%
Oswego 543 257 $ 331,122 54 13 319 $ 253,608 7.99 9.63 -17.07% $ 263,807 -3.87%
Palatine 67 316 $ 457,611 49 9 330 $ 364,564 9.77 12.26 -20.28% $ 379,260 -3.87%
Palos Heights 463 85 $ 446,721 6 2 79 $ 280,520 11.72 12.00 -2.30% $ 333,055 -15.77%
Palos Hills 465 47 $ 326,795 16 0 59 $ 233,094 7.52 8.24 -8.72% $ 247,669 -5.89%
Palos Park 464 82 $ 807,539 3 1 58 $ 367,280 15.87 26.63 -40.41% $ 594,530 -38.22%
Park Forest 466 168 $ 91,253 27 29 248 $ 59,032 6.63 9.16 -27.62% $ 70,370 -16.11%
Park Ridge 68 292 $ 616,600 43 11 338 $ 430,452 8.94 15.23 -41.32% $ 489,734 -12.10%
Peotone 468 48 $ 264,077 7 1 40 $ 172,576 12.00 20.92 -42.65% $ 223,807 -22.89%
Plainfield 544 701 $ 306,872 142 48 914 $ 231,601 7.62 9.65 -21.08% $ 253,899 -8.78%
Posen 469 36 $ 121,307 9 4 50 $ 91,665 6.86 12.00 -42.86% $ 112,387 -18.44%
Prospect Heights 70 55 $ 491,553 10 3 48 $ 352,904 10.82 14.44 -25.09% $ 364,892 -3.29%
Richton Park 471 78 $ 166,992 26 16 126 $ 110,171 5.57 8.78 -36.55% $ 127,927 -13.88%
River Forest 305 97 $ 855,090 11 7 81 $ 675,574 11.76 13.33 -11.82% $ 889,940 -24.09%
River Grove 171 50 $ 206,842 18 7 68 $ 178,008 6.45 12.39 -47.92% $ 203,772 -12.64%
Riverdale 627 86 $ 67,525 5 13 134 $ 33,673 6.79 9.50 -28.50% $ 48,199 -30.14%
Riverside 546 90 $ 521,337 11 2 82 $ 422,029 11.37 16.59 -31.47% $ 431,200 -2.13%
Rolling Meadows 8 76 $ 292,732 24 3 117 $ 243,675 6.33 9.76 -35.09% $ 267,552 -8.92%
Romeoville 494 172 $ 197,446 61 20 391 $ 149,790 4.37 7.61 -42.55% $ 169,431 -11.59%
Roselle & Keeneyville 172 133 $ 337,855 21 11 127 $ 272,017 10.04 13.11 -23.42% $ 308,927 -11.95%
Round Lake 73 354 $ 161,556 118 45 535 $ 122,350 6.09 8.53 -28.69% $ 145,833 -16.10%
Sauk Village 414 68 $ 80,523 9 16 136 $ 40,864 5.07 9.32 -45.64% $ 54,166 -24.56%
Schaumburg 193 226 $ 391,004 30 12 257 $ 314,248 9.07 8.77 3.39% $ 311,729 0.81%
Shorewood 496 131 $ 294,764 19 7 139 $ 253,985 9.53 12.00 -20.61% $ 266,612 -4.74%
Skokie 76 224 $ 366,822 61 25 361 $ 296,616 6.01 11.16 -46.11% $ 315,905 -6.11%
South Elgin 177 124 $ 316,117 34 2 137 $ 235,549 8.60 11.19 -23.17% $ 279,166 -15.62%
South Holland 473 181 $ 151,598 34 38 282 $ 99,831 6.14 9.66 -36.48% $ 119,714 -16.61%
St. Charles 174 544 $ 616,417 81 12 467 $ 379,439 11.66 14.80 -21.23% $ 435,739 -12.92%
Steger 475 64 $ 180,640 7 4 78 $ 91,933 8.63 11.68 -26.12% $ 95,814 -4.05%
Stickney 404 55 $ 191,483 16 9 90 $ 157,452 5.74 10.68 -46.29% $ 167,675 -6.10%
Streamwood 107 210 $ 238,012 51 14 283 $ 175,664 7.24 11.07 -34.61% $ 201,881 -12.99%
Sugar Grove 554 107 $ 352,396 10 2 99 $ 298,083 11.57 19.40 -40.36% $ 344,302 -13.42%
Summit 501 48 $ 157,115 4 7 48 $ 107,122 9.76 26.09 -62.58% $ 121,026 -11.49%
Data Source: MRED LLC (C) Copyright 2010, A. L. Wagner Appraisal Group, Inc.
Midwest Real Estate Data, LLC (630) 416-6556 www.WagnerAppraisal.com Page 5
- 6. July 1, 2010 Statistics July 1, 2009 Statistics
Under Under # of Sales 12 mo SP
MLS Average Contract Contract Last Average MONTHS MONTHS Percent Average Percent
Town Area Actives List Price (Ctg.) (Pend) 12 mos. Sale Price SUPPLY SUPPLY Change Sale Price Change
Thornton 476 17 $ 139,653 1 3 19 $ 85,198 8.87 10.96 -19.05% $ 123,921 -31.25%
Tinley Park 477 202 $ 292,003 32 7 254 $ 256,238 8.27 10.52 -21.35% $ 257,718 -0.57%
University Park 5466 37 $ 151,033 7 9 65 $ 75,835 5.48 9.76 -43.84% $ 86,208 -12.03%
Vernon Hills 61 125 $ 469,959 21 0 122 $ 442,209 10.49 11.34 -7.48% $ 433,235 2.07%
Villa Park 186 138 $ 258,570 23 6 198 $ 214,732 7.30 8.95 -18.50% $ 215,017 -0.13%
Warrenville 555 66 $ 348,188 10 4 77 $ 240,633 8.70 10.94 -20.42% $ 239,242 0.58%
Waukegan & Park City 85 344 $ 127,942 71 44 546 $ 84,145 6.25 9.63 -35.15% $ 97,658 -13.84%
Wayne 184 46 $ 1,051,914 4 0 23 $ 533,120 20.44 42.75 -52.18% $ 497,429 7.18%
West Chicago 185 253 $ 295,115 41 10 232 $ 205,179 10.73 14.92 -28.08% $ 228,040 -10.03%
Westchester 154 157 $ 263,750 20 10 191 $ 212,287 8.52 10.88 -21.61% $ 234,797 -9.59%
Western Springs 558 101 $ 718,060 19 2 107 $ 549,578 9.47 10.24 -7.52% $ 678,954 -19.06%
Westmont 559 116 $ 366,251 14 6 142 $ 319,767 8.59 12.20 -29.55% $ 330,062 -3.12%
Wheaton 187 418 $ 489,130 63 8 436 $ 366,725 9.89 11.70 -15.46% $ 419,446 -12.57%
Wheeling 90 100 $ 260,334 36 5 132 $ 205,764 6.94 10.52 -34.08% $ 237,791 -13.47%
Willow Springs 480 49 $ 378,867 2 1 18 $ 417,417 28.00 8.80 218.18% $ 349,944 19.28%
Willowbrook 516 55 $ 708,478 4 1 53 $ 402,267 11.38 19.89 -42.80% $ 491,268 -18.12%
Wilmette 91 182 $ 934,889 31 28 279 $ 789,807 6.46 10.81 -40.25% $ 886,179 -10.87%
Winfield 190 86 $ 435,715 7 0 61 $ 349,415 15.18 12.79 18.66% $ 369,101 -5.33%
Winnetka 93 202 $ 2,185,847 22 33 182 $ 1,309,557 10.23 15.90 -35.69% $ 1,515,707 -13.60%
Wood Dale 191 102 $ 354,387 17 1 81 $ 234,142 12.36 15.39 -19.66% $ 298,583 -21.58%
Woodridge 517 135 $ 326,029 15 5 166 $ 274,357 8.71 7.39 17.78% $ 287,129 -4.45%
Woodstock & Greenwood 98 295 $ 364,290 39 7 211 $ 209,786 13.77 20.90 -34.09% $ 253,218 -17.15%
Worth 482 48 $ 216,143 10 3 65 $ 158,305 7.38 16.17 -54.34% $ 211,647 -25.20%
Yorkville 560 223 $ 341,113 27 11 225 $ 231,349 10.17 13.07 -22.14% $ 271,007 -14.63%
Zion 99 198 $ 159,951 31 15 230 $ 93,763 8.61 10.11 -14.85% $ 103,237 -9.18%
City of CHICAGO 8000 6,177 $ 378,652 1,004 858 9,327 $ 225,772 6.62 9.76 -32.13% $ 249,357 -9.46%
TOTALS (all areas in report): 8099 39,035 $ 421,970 6,354 3,063 46,926 $ 264,705 8.31 11.32 -26.53% $ 292,646 -9.55%
ALL AREAS ALL 43,846 $ 412,773 6,933 3,264 51,179 $ 260,353 8.57 11.59 -26.02% $ 288,116 -9.64%
(including areas not listed above)
A balanced market typically has a 3.00 to 4.00 months supply. Less than that is undersupplied, more is oversupplied.
Average Sales Price changes may be exaggerated if significant amount of New Construction is reported in the MLS.
Average Sales Price noted from previous year to current year should not be construed as Appreciation - it is percent of change of average sales price.
Data Source: MRED LLC (C) Copyright 2010, A. L. Wagner Appraisal Group, Inc.
Midwest Real Estate Data, LLC (630) 416-6556 www.WagnerAppraisal.com Page 6