Eluru Call Girls Service ☎ ️93326-06886 ❤️🔥 Enjoy 24/7 Escort Service
Lesson 2 2
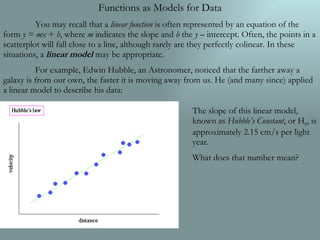
1. Functions as Models for Data You may recall that a linear function is often represented by an equation of the form y = mx + b , where m indicates the slope and b the y – intercept. Often, the points in a scatterplot will fall close to a line, although rarely are they perfectly colinear. In these situations, a linear model may be appropriate. For example, Edwin Hubble, an Astronomer, noticed that the farther away a galaxy is from our own, the faster it is moving away from us. He (and many since) applied a linear model to describe his data: The slope of this linear model, known as Hubble’s Constant , or H 0 , is approximately 2.15 cm/s per light year. What does that number mean?
2. How good is the line of best fit? For the following sets of data, does it appear that one might have a “better” line of fit? The measure of how well a line of best fit corresponds to the data is called the correlation coefficient .
3. Finding the correlation coefficient, r , is as simple as evaluating the following formula: where x and y are the means of the x and y values of all of the points, and s x and s y are the standard deviations of the x and y values. In your notes, take five minutes to write (in words, not symbols) what you think the formula means. Explain as many pieces of it as you can, and don’t worry if you can’t decipher the whole thing.
4. r is always a number between –1 and 1. The closer r is to -1 or 1, the stronger the linear correlation of the data. In other words, the absolute value of r determines the strength of the correlation, and the sign indicates whether the correlation (and slope) is positive or negative. Here are some scatterplots, along with their respective r values, so we can get a sense of what different values of r look like:
5. We can find a decent linear model by drawing a scatterplot and fitting a line by hand, but your calculator happens to be pretty good at this too… Let’s find the equation of a line of best fit for the following data: x y 0 3 6 2 8 7 6 2 0.2 5 10.5 5.2 16.1 13.4 11.1 5.1