Economy... at a glance July-August 2020 Círculo de Empresarios
•
0 j'aime•41 vues

Monthly summary of the state of the national and international economy

Recommandé
Recommandé
Contenu connexe
Tendances
Tendances (19)
Similaire à Economy... at a glance July-August 2020 Círculo de Empresarios
Similaire à Economy... at a glance July-August 2020 Círculo de Empresarios (20)
Plus de Círculo de Empresarios
Plus de Círculo de Empresarios (20)
Dernier
Dernier (20)
Economy... at a glance July-August 2020 Círculo de Empresarios
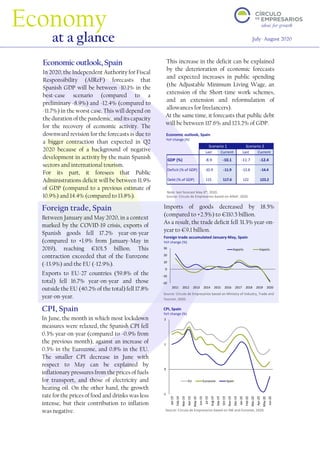
- 1. Source: Círculo de Empresarios based on INE and Eurostat, 2020. Economic outlook, Spain YoY change (%) Last Current Last Current GDP (%) -8.9 -10.1 -11.7 -12.4 Deficit (% of GDP) -10.9 -11.9 -13.8 -14.4 Debt (% of GDP) 115 117.6 122 123.2 Scenario 1 Scenario 2 -20 -10 0 10 20 30 2011 2012 2013 2014 2015 2016 2017 2018 2019 2020 Exports Imports -1 0 1 2 Jan-19 Feb-19 Mar-19 Apr-19 May-19 Jun-19 Jul-19 Aug-19 Sep-19 Oct-19 Nov-19 Dec-19 Jan-20 Feb-20 Mar-20 Apr-20 May-20 Jun-20 EU Eurozone Spain Economic outlook, Spain In 2020, the Independent Authority for Fiscal Responsibility (AIReF) forecasts that Spanish GDP will be between -10.1% in the best-case scenario (compared to a preliminary -8.9%) and -12.4% (compared to -11.7%) in the worst case. This will depend on the duration of the pandemic, and its capacity for the recovery of economic activity. The downward revision for the forecasts is due to a bigger contraction than expected in Q2 2020 because of a background of negative development in activity by the main Spanish sectors and international tourism. For its part, it foresees that Public Administrations deficit will be between 11.9% of GDP (compared to a previous estimate of 10.9%) and 14.4% (compared to 13.8%). This increase in the deficit can be explained by the deterioration of economic forecasts and expected increases in public spending (the Adjustable Minimum Living Wage, an extension of the Short-time work schemes, and an extension and reformulation of allowances for freelancers). At the same time, it forecasts that public debt will be between 117.6% and 123.2% of GDP. Foreign trade, Spain Between January and May 2020, in a context marked by the COVID-19 crisis, exports of Spanish goods fell 17.2% year-on-year (compared to +1.9% from January-May in 2019), reaching €101.5 billion. This contraction exceeded that of the Eurozone (-13.9%) and the EU (-12.9%). Exports to EU-27 countries (59.8% of the total) fell 16.7% year-on-year and those outside the EU (40.2% of the total) fell 17.8% year-on-year. Imports of goods decreased by 18.5% (compared to +2.5%) to €110.5 billion. As a result, the trade deficit fell 31.3% year-on- year to €9.1 billion. CPI, Spain In June, the month in which most lockdown measures were relaxed, the Spanish CPI fell 0.3% year-on-year (compared to -0.9% from the previous month), against an increase of 0.3% in the Eurozone, and 0.8% in the EU. The smaller CPI decrease in June with respect to May can be explained by inflationary pressures from the prices of fuels for transport, and those of electricity and heating oil. On the other hand, the growth rate for the prices of food and drinks was less intense, but their contribution to inflation was negative. Economy at a glance July- August 2020 Source: Círculo de Empresarios based on AIReF, 2020. CPI, Spain YoY change (%) Foreign trade accumulated January-May, Spain YoY change (%) Source: Círculo de Empresarios based on Ministry of Industry, Trade and Tourism, 2020. Note: last forecast May 6th, 2020.
- 2. ‘Economy at a glance’, a publication of the Círculo de Empresarios produced by its Department of the Economy, contains information and opinion from reliable sources. However, the Círculo de Empresarios does not guarantee its accuracy and does not take responsibility for any errors or omissions. This document is merely informative. As a result, the Círculo de Empresarios is not responsible for any uses that may be made of the publication. The opinions and estimates of the Department can be modified without prior warning. www.circulodeempresarios.org -10.7 11.5 -15 -10 -5 0 5 10 15 Q32007 Q22008 Q12009 Q42009 Q32010 Q22011 Q12012 Q42012 Q32013 Q22014 Q12015 Q42015 Q32016 Q22017 Q12018 Q42018 Q32019 Q22020 50 60 70 80 90 100 110 120 Jan-15 May-15 Sep-15 Jan-16 May-16 Sep-16 Jan-17 May-17 Sep-17 Jan-18 May-18 Sep-18 Jan-19 May-19 Sep-19 Jan-20 May-20 Manufacturing industry Construction Service sector Monthly GDP Exports Imports 2019 2020 Var. 2019- 2020 (%) 2019 2020 Var. 2019- 2020 (%) Luxembourg 7.2 4.9 -31.3 9.9 7.1 -27.6 France 216.5 169.1 -21.9 248.8 201.8 -18.9 Portugal 25.6 20.9 -18.3 34.0 27.5 -19.1 Slovakia 34.2 27.3 -20.2 34.0 28.2 -17.1 Spain 122.5 101.5 -17.2 135.6 110.6 -18.5 Italy 197.0 165.6 -16.0 180.6 148.8 -17.6 Romania 29.2 23.6 -19.2 35.9 31.0 -13.6 Finland 28.1 23.0 -18.0 27.9 24.3 -12.7 Greece 14.1 12.2 -13.5 23.5 19.6 -16.5 Czech rep 74.6 63.1 -14.3 66.5 58.6 -12.1 Foreign trade in goods, EU In May, EU goods exports slumped 29.7% year-on-year, to €129.8 billion, following 5 months of consecutive falls. Imports fell 26.2% year-on-year to €122.6 billion, accumulating three months of decreases. As a result, the EU trade deficit fell 61.5% year-on-year to $7.1 billion (0.04% of GDP). From January to May, exports fell 12.9% compared to the same period in 2019 (to €767.7 billion) and imports by 12.7% (€712.9 billion). Countries in the region that have suffered the biggest negative impact in trade flows during this period are: Monthly GDP, UK In May, British GDP registered a positive monthly rate of 1.8% after the historic collapse in March and April (-6.9% and -20.3% respectively). Growth in May was less than the 5.5% forecast by Reuters, indicating a slower economic recovery than expected. By sectors, industry grew 8.5% monthly, and construction by 8.2%. However, in spite of this development, production in construction and manufacturing industry was 39% and 22% (respectively) below the levels fof February. The services sector rose slightly by 0.8%, far from the 4.9% forecast before the reopening of businesses in May. The sector remains 24.4% below levels prior to the crisis. Economic recovery, China In Q2 2020, during the process of economic reopening after overcoming the first wave of cases, Chinese GDP bounced back with 11.5% quarterly, compensating for the 10.7% fall registered in Q1 2020. In year-on-year terms, the Chinese economy grew by 3.2% compared to -6.8% in the previous quarter. Although the advance would suggest a ‘V’ shaped recovery, available economic data up until now shows inconsistent improvement. While supply remains stable, internal demand is still showing signs of weakness. Industrial production registered a yearly increase of 4.4% after a fall of 7.7% in the previous quarter. On the other hand, retail trade fell 3.9% (-9.4% in Q2 2020). The weakness of domestic consumption was also reflected in the foreign sector. Exports showed a slight year-on-year increase of 0.2% (compared to -13.4% in Q1 2020), although imports shrank 9.7% (compared to -2.9% in Q1 2020). Source: Círculo de Empresarios based on Oxford Economics, 2020. Monthly GDP, UK Index 2016 = 100 Source: Círculo de Empresarios based on ONS, 2020. Foreign trade, accumulated January-May Billions of € and variation % 2019-2020 Source: Círculo de Empresarios based on Eurostat, 2020. GDP, China QoQ change (%)