Economy... at a glance October 2020
•
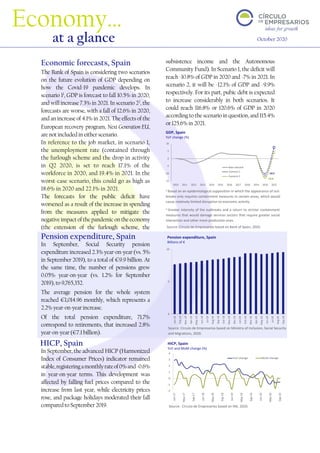
0 j'aime•55 vues

Monthly summary of the state of the Spanish and international economy

Recommandé
Recommandé
Contenu connexe
Tendances
Tendances (20)
Similaire à Economy... at a glance October 2020
Similaire à Economy... at a glance October 2020 (20)
Plus de Círculo de Empresarios
Plus de Círculo de Empresarios (20)
Dernier
Dernier (20)
Economy... at a glance October 2020
- 1. Source: Círculo de Empresarios based on INE, 2020. -10.5 -12.6 -15 -10 -5 0 5 10 2010 2011 2012 2013 2014 2015 2016 2017 2018 2019 2020 2021 Base scenario Scenario 1 Scenario 2 -2 -1 0 1 2 3 4 Jan-17 May-17 Sep-17 Jan-18 May-18 Sep-18 Jan-19 May-19 Sep-19 Jan-20 May-20 Sep-20 YoY change MoM change 8 9 10 Jan-19 Feb-19 Mar-19 Apr-19 May-19 Jun-19 Jul-19 Aug-19 Sep-19 Oct-19 Nov-19 Dec-19 Jan-20 Feb-20 Mar-20 Apr-20 May-20 Jun-20 Jul-20 Aug-20 Sep-20 Economic forecasts, Spain The Bank of Spain is considering two scenarios on the future evolution of GDP depending on how the Covid-19 pandemic develops. In scenario 11 , GDP is forecast to fall 10.5% in 2020, and will increase 7.3% in 2021. In scenario 22 , the forecasts are worse, with a fall of 12.6% in 2020, and an increase of 4.1% in 2021. The effects of the European recovery program, Next Generation EU, are not included in either scenario. In reference to the job market, in scenario 1, the unemployment rate (contained through the furlough scheme and the drop in activity in Q2 2020, is set to reach 17.1% of the workforce in 2020, and 19.4% in 2021. In the worst-case scenario, this could go as high as 18.6% in 2020 and 22.1% in 2021. The forecasts for the public deficit have worsened as a result of the increase in spending from the measures applied to mitigate the negativeimpactofthepandemicontheeconomy (the extension of the furlough scheme, the subsistence income and the Autonomous Community Fund). In Scenario 1, the deficit will reach -10.8% of GDP in 2020 and -7% in 2021. In scenario 2, it will be -12.1% of GDP and -9.9% respectively. For its part, pubic debt is expected to increase considerably in both scenarios. It could reach 116.8% or 120.6% of GDP in 2020 according to the scenario in question, and 115.4% or 125.6% in 2021. Pension expenditure, Spain In September, Social Security pension expenditure increased 2.3% year-on-year (vs. 5% in September 2019), to a total of €9.9 billion. At the same time, the number of pensions grew 0.05% year-on-year (vs. 1.2% for September 2019), to 9,765,352. The average pension for the whole system reached €1,014.96 monthly, which represents a 2.2% year-on-year increase. Of the total pension expenditure, 71.7% correspond to retirements, that increased 2.8% year-on-year (€7.1 billion). HICP, Spain In September, the advanced HICP (Harmonized Index of Consumer Prices) indicator remained stable,registeringamonthlyrateof0%and-0.6% in year-on-year terms. This development was affected by falling fuel prices compared to the increase from last year, while electricity prices rose, and package holidays moderated their fall compared to September 2019. Economy… at a glance October 2020 Source: Círculo de Empresarios based on Bank of Spain, 2020. Pension expenditure, Spain Billions of € Source: Círculo de Empresarios based on Ministry of Inclusion, Social Security and Migrations, 2020. GDP, Spain YoY change (%) 1 Based on an epidemiological supposition in which the appearance of out- breaks only requires containment measures in certain areas, which would cause relatively limited disruption to economic activity. 2 Greater intensity of the outbreaks and a return to stricter containment measures that would damage services sectors that require greater social interaction and other more productive ones. HICP, Spain YoY and MoM change (%)
- 2. ‘Economy at a glance’, a publication of the Círculo de Empresarios produced by its Department of the Economy, contains information and opinion from reliable sources. However, the Círculo de Empresarios does not guarantee its accuracy and does not take responsibility for any errors or omissions. This document is merely informative. As a result, the Círculo de Empresarios is not responsible for any uses that may be made of the publication. The opinions and estimates of the Department can be modified without prior warning. www.circulodeempresarios.org -40 -30 -20 -10 0 Services Industry Construction Q1 2020 Q2 2020 1st Semester 2020 25 35 45 55 Feb-18 Apr-18 Jun-18 Aug-18 Oct-18 Dec-18 Feb-19 Apr-19 Jun-19 Aug-19 Oct-19 Dec-19 Feb-20 Apr-20 Jun-20 Aug-20 Manufacturing PMI 60 70 80 90 100 110 Oct-19 Nov-19 Dec-19 Jan-20 Feb-20 Mar-20 Apr-20 May-20 Jun-20 Jul-20 Aug-20 Sep-20 Eurozone Germany Spain France Italy Economic sentiment In September, the Eurozone Economic Sentiment Indicator (ESI) improved for the fifth consecutive month, although at a slower rate due to the uncertainty generated by the new wave of Covid-19 cases. Specifically, the ESI advanced 3.6 points to 91.1, still below the levels prior to the crisis. By sectors, the confidence of the service sector stands out, which although increasing 6.1 points, remains in negative levels (-11.1), fundamentally due to the uncertainty generated in business as a result of the new outbreaks. By countries, the main economies in the region presented a mixed performance. In Germany, the index increase was below the European average, but despite this, it was consolidated in higher values (1.2 points to 95.5). In Italy and France, the index improved significantly, registering increases of 8.4 and 5.8 points respectively (to 89 and 96.6 points). For its part, Spain registered a slight increase of 1.6 points, reaching 89.7 points. GDP, UK In Q2 2020, according to definitive data published by the Office for National Statistics (the ONS), the British economy contracted 19.8% quarterly (-20.4% in the initial estimate). In year-on-year terms, the fall was 21.5%. This represents the second quarter of GDP contraction accumulated by the UK, and takes it back to 2003 levels. By demand components, household consumption fell 23.6% quarterly, and gross fixed capital formation by 21.6%. By sectors, the construction industry was the sector most affected with a quarterly drop of 35.7%, followed by the service sector (-19.2%) and the industrial sector (-16.3%). In comparison to the main European economies, the UK is the country whose GDP fellthemostinQ2,aheadofSpain(-17.8%)and France (-13.8%). Industrial activity, China In September, China’s manufacturing PMI registered a slight increase to 51.5 points (vs. 51 points in August). This represents 7 consecutive increases that the index has accumulated according to data published by China’s National Bureau of Statistics. In the sub-indexes, production and new orders increased positively. On the other hand, job creation and the supply of raw materials is still registering values below 50 points. GDP evolution by sectors, UK QoQ change (%) Source: Círculo de Empresarios based on ONS, 2020. Source: Círculo de Empresarios based on European Commission, 2020. Manufacturing PMI, China Points Economic Sentiment (ISE), Eurozone Points Source: Círculo de Empresarios based on National Bureau of Statistics of China, 2020.