Cb legislative session january 2013 crosstabs same sex marriage
•
1 j'aime•408 vues


Recommandé
Recommandé
Contenu connexe
Tendances
Tendances (20)
En vedette
En vedette (20)
Similaire à Cb legislative session january 2013 crosstabs same sex marriage
Similaire à Cb legislative session january 2013 crosstabs same sex marriage (20)
Plus de Honolulu Civil Beat
Plus de Honolulu Civil Beat (20)
Cb legislative session january 2013 crosstabs same sex marriage
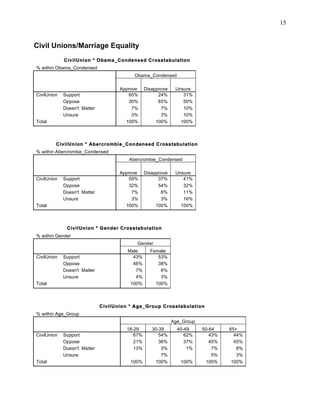
- 1. 15 Civil Unions/Marriage Equality CivilUnion * Obama_Condensed Crosstabulation % within Obama_Condensed Obama_Condensed Approve Disapprove Unsure CivilUnion Support 60% 24% 31% Oppose 30% 65% 50% Doesn't Matter 7% 7% 10% Unsure 3% 3% 10% Total 100% 100% 100% CivilUnion * Abercrombie_Condensed Crosstabulation % within Abercrombie_Condensed Abercrombie_Condensed Approve Disapprove Unsure CivilUnion Support 59% 37% 41% Oppose 32% 54% 32% Doesn't Matter 7% 6% 11% Unsure 3% 3% 16% Total 100% 100% 100% CivilUnion * Gender Crosstabulation % within Gender Gender Male Female CivilUnion Support 43% 53% Oppose 46% 38% Doesn't Matter 7% 6% Unsure 4% 3% Total 100% 100% CivilUnion * Age_Group Crosstabulation % within Age_Group Age_Group 18-29 30-39 40-49 50-64 65+ CivilUnion Support 67% 54% 62% 43% 44% Oppose 21% 36% 37% 45% 45% Doesn't Matter 13% 3% 1% 7% 8% Unsure 7% 5% 3% Total 100% 100% 100% 100% 100%
- 2. 16 CivilUnion * Race_Ethncity Crosstabulation % within Race_Ethncity Race_Ethncity Caucasian Japanese Filipino Hawaiian Chinese Hispanic/Latino Other/Mixed CivilUnion Support 63% 46% 37% 38% 34% 29% 48% Oppose 30% 45% 55% 51% 49% 57% 37% Doesn't Matter 6% 4% 3% 9% 10% 14% 10% Unsure 1% 5% 5% 2% 7% 5% Total 100% 100% 100% 100% 100% 100% 100% CivilUnion * PhoneType Crosstabulation % within PhoneType PhoneType Both Cell Landline CivilUnion Support 50% 48% 41% Oppose 41% 42% 41% Doesn't Matter 6% 9% 11% Unsure 3% 1% 7% Total 100% 100% 100% CivilUnion * Politics Crosstabulation % within Politics Politics Liberal/Progressive Moderate Conservative Unsure CivilUnion Support 80% 55% 18% 35% Oppose 13% 39% 71% 46% Doesn't 3% 6% 7% 12% Matter Unsure 4% 1% 4% 7% Total 100% 100% 100% 100% CivilUnion * Party_ID Crosstabulation % within Party_ID Party_ID Democrat Republican Independent Unsure CivilUnion Support 67% 24% 36% 48% Oppose 23% 69% 54% 31% Doesn't Matter 6% 5% 8% 3% Unsure 3% 2% 3% 17% Total 100% 100% 100% 100%
- 3. 17 CivilUnion * Education Crosstabulation % within Education Education High No School College Graduate degree Degree Degree Degree CivilUnion Support 38% 39% 47% 63% Oppose 25% 51% 47% 24% Doesn't Matter 25% 8% 3% 9% Unsure 13% 2% 4% 4% Total 100% 100% 100% 100% CivilUnion * Relationship Crosstabulation % within Relationship Relationship Married Partner Single Div/Sep Widowed CivilUnion Support 48% 56% 54% 42% 49% Oppose 43% 24% 36% 52% 42% Doesn't Matter 5% 16% 6% 3% 8% Unsure 4% 4% 4% 3% 1% Total 100% 100% 100% 100% 100% CivilUnion * Military_Family Crosstabulation % within Military_Family Military_Family Yes No CivilUnion Support 45% 50% Oppose 44% 41% Doesn't Matter 6% 6% Unsure 5% 3% Total 100% 100% CivilUnion * Union_Household Crosstabulation % within Union_Household Union_Household Yes No CivilUnion Support 51% 48% Oppose 41% 42% Doesn't Matter 6% 6% Unsure 3% 4% Total 100% 100%
- 4. 18 CivilUnion * Income Crosstabulation % within Income Income $50,000 $50,000- $100,000 or Less $100,000 or More CivilUnion Support 41% 51% 63% Oppose 48% 38% 31% Doesn't Matter 7% 7% 2% Unsure 3% 4% 4% Total 100% 100% 100% CivilUnion * Voted2008 Crosstabulation % within Voted2008 Voted2008 No Yes CivilUnion Support 31% 49% Oppose 54% 41% Doesn't Matter 9% 7% Unsure 6% 3% Total 100% 100% CivilUnion * Voted2010 Crosstabulation % within Voted2010 Voted2010 No Yes CivilUnion Support 35% 50% Oppose 45% 41% Doesn't Matter 14% 6% Unsure 6% 3% Total 100% 100%
- 5. 19 Marriage * Obama_Condensed Crosstabulation % within Obama_Condensed Obama_Condensed Approve Disapprove Unsure Marriage Yes 54% 18% 33% No 38% 77% 52% Doesn't Matter 7% 4% 5% Unsure 2% 1% 10% Total 100% 100% 100% Marriage * Abercrombie_Condensed Crosstabulation % within Abercrombie_Condensed Abercrombie_Condensed Approve Disapprove Unsure Marriage Yes 53% 32% 38% No 41% 60% 43% Doesn't Matter 6% 5% 7% Unsure 1% 3% 13% Total 100% 100% 100% Marriage * Gender Crosstabulation % within Gender Gender Male Female Marriage Yes 38% 47% No 56% 43% Doesn't Matter 4% 7% Unsure 2% 3% Total 100% 100% Marriage * Age_Group Crosstabulation % within Age_Group Age_Group 18-29 30-39 40-49 50-64 65+ Marriage Yes 67% 58% 59% 37% 35% No 21% 37% 36% 55% 56% Doesn't Matter 13% 4% 4% 8% Unsure 5% 4% 1% Total 100% 100% 100% 100% 100%
- 6. 20 Marriage * Race_Ethncity Crosstabulation % within Race_Ethncity Race_Ethncity Caucasian Japanese Filipino Hawaiian Chinese Hispanic/Latino Other/Mixed Marriage Yes 53% 42% 34% 34% 31% 38% 44% No 43% 49% 59% 57% 55% 63% 44% Doesn't Matter 2% 5% 6% 9% 11% 11% Unsure 2% 4% 1% 3% 1% Total 100% 100% 100% 100% 100% 100% 100% Marriage * PhoneType Crosstabulation % within PhoneType PhoneType Both Cell Landline Marriage Yes 44% 42% 38% No 48% 51% 54% Doesn't Matter 5% 7% 7% Unsure 3% 2% Total 100% 100% 100% Marriage * Politics Crosstabulation % within Politics Politics Liberal/Progressive Moderate Conservative Unsure Marriage Yes 73% 47% 13% 34% No 22% 45% 83% 48% Doesn't Matter 3% 6% 3% 13% Unsure 3% 2% 1% 5% Total 100% 100% 100% 100% Marriage * Party_ID Crosstabulation % within Party_ID Party_ID Democrat Republican Independent Unsure Marriage Yes 61% 18% 31% 48% No 31% 82% 57% 41% Doesn't Matter 6% 1% 9% Unsure 2% 3% 10% Total 100% 100% 100% 100%
- 7. 21 Marriage * Education Crosstabulation % within Education Education High No School College Graduate degree Degree Degree Degree Marriage Yes 19% 35% 44% 53% No 50% 56% 52% 38% Doesn't Matter 31% 7% 4% 4% Unsure 2% 1% 5% Total 100% 100% 100% 100% Marriage * Relationship Crosstabulation % within Relationship Relationship Married Partner Single Div/Sep Widowed Marriage Yes 42% 52% 49% 35% 44% No 51% 32% 45% 57% 48% Doesn't Matter 4% 16% 5% 5% 6% Unsure 3% 2% 3% 1% Total 100% 100% 100% 100% 100% Marriage * Military_Family Crosstabulation % within Military_Family Military_Family Yes No Marriage Yes 39% 44% No 54% 48% Doesn't Matter 5% 5% Unsure 2% 2% Total 100% 100% Marriage * Union_Household Crosstabulation % within Union_Household Union_Household Yes No Marriage Yes 45% 43% No 47% 50% Doesn't Matter 5% 5% Unsure 3% 2% Total 100% 100%
- 8. 22 Marriage * Income Crosstabulation % within Income Income $50,000 $50,000- $100,000 or Less $100,000 or More Marriage Yes 34% 48% 55% No 58% 45% 38% Doesn't Matter 7% 4% 4% Unsure 0% 4% 3% Total 100% 100% 100% Marriage * Voted2008 Crosstabulation % within Voted2008 Voted2008 No Yes Marriage Yes 25% 43% No 70% 48% Doesn't Matter 3% 6% Unsure 2% 3% Total 100% 100% Marriage * Voted2010 Crosstabulation % within Voted2010 Voted2010 No Yes Marriage Yes 33% 44% No 58% 48% Doesn't Matter 5% 6% Unsure 5% 2% Total 100% 100%
- 9. 23 MarriageDecide * Obama_Condensed Crosstabulation % within Obama_Condensed Obama_Condensed Approve Disapprove Unsure MarriageDecide Voters 53% 76% 48% Legislature/Governor 15% 7% Courts 9% 4% 2% Federal 15% 11% 19% Other/Unsure 8% 3% 31% Total 100% 100% 100% MarriageDecide * Abercrombie_Condensed Crosstabulation % within Abercrombie_Condensed Abercrombie_Condensed Approve Disapprove Unsure MarriageDecide Voters 53% 70% 40% Legislature/Governor 16% 9% 2% Courts 10% 4% 11% Federal 16% 11% 13% Other/Unsure 6% 6% 35% Total 100% 100% 100% MarriageDecide * Gender Crosstabulation % within Gender Gender Male Female MarriageDecide Voters 62% 58% Legislature/Governor 12% 11% Courts 6% 8% Federal 14% 14% Other/Unsure 7% 9% Total 100% 100% MarriageDecide * Age_Group Crosstabulation % within Age_Group Age_Group 18-29 30-39 40-49 50-64 65+ MarriageDecide Voters 58% 43% 53% 66% 61% Legislature/Governor 8% 18% 19% 9% 10% Courts 5% 10% 11% 5% 6% Federal 8% 15% 16% 14% 14% Other/Unsure 21% 13% 1% 5% 9% Total 100% 100% 100% 100% 100%
- 10. 24 MarriageDecide * Race_Ethncity Crosstabulation % within Race_Ethncity Race_Ethncity Caucasian Japanese Filipino Hawaiian Chinese Hispanic/Latino Other/Mixed MarriageDecide Voters 60% 59% 59% 60% 64% 71% 62% Legislature/Governor 11% 16% 14% 11% 7% 14% 9% Courts 8% 3% 7% 4% 10% 0% 8% Federal 18% 13% 10% 13% 13% 14% 9% Other/Unsure 2% 9% 9% 11% 7% 13% Total 100% 100% 100% 100% 100% 100% 100% MarriageDecide * PhoneType Crosstabulation % within PhoneType PhoneType Both Cell Landline MarriageDecide Voters 62% 56% 49% Legislature/Governor 13% 7% 7% Courts 6% 7% 12% Federal 13% 18% 16% Other/Unsure 6% 12% 16% Total 100% 100% 100% MarriageDecide * Politics Crosstabulation % within Politics Politics Liberal/Progressive Moderate Conservative Unsure MarriageDecide Voters 41% 64% 79% 55% Legislature/Governor 22% 12% 6% 5% Courts 12% 5% 3% 8% Federal 15% 13% 9% 18% Other/Unsure 11% 5% 3% 14% Total 100% 100% 100% 100% MarriageDecide * Party_ID Crosstabulation % within Party_ID Party_ID Democrat Republican Independent Unsure MarriageDecide Voters 50% 74% 69% 48% Legislature/Governor 17% 5% 9% Courts 11% 3% 3% 3% Federal 12% 13% 15% 14% Other/Unsure 9% 4% 3% 34% Total 100% 100% 100% 100%
- 11. 25 MarriageDecide * Education Crosstabulation % within Education Education High No School College Graduate degree Degree Degree Degree MarriageDecide Voters 41% 63% 65% 51% Legislature/Governor 18% 7% 8% 24% Courts 5% 8% 8% Federal 18% 15% 14% 11% Other/Unsure 24% 10% 6% 7% Total 100% 100% 100% 100% MarriageDecide * Relationship Crosstabulation % within Relationship Relationship Married Partner Single Div/Sep Widowed MarriageDecide Voters 62% 50% 54% 69% 60% Legislature/Governor 11% 15% 15% 10% 12% Courts 8% 4% 3% 3% 6% Federal 12% 19% 16% 14% 13% Other/Unsure 7% 12% 12% 3% 9% Total 100% 100% 100% 100% 100% MarriageDecide * Military_Family Crosstabulation % within Military_Family Military_Family Yes No MarriageDecide Voters 63% 59% Legislature/Governor 11% 12% Courts 6% 7% Federal 14% 14% Other/Unsure 7% 8% Total 100% 100% MarriageDecide * Union_Household Crosstabulation % within Union_Household Union_Household Yes No MarriageDecide Voters 56% 62% Legislature/Governor 14% 11% Courts 9% 6% Federal 13% 14% Other/Unsure 7% 8% Total 100% 100%
- 12. 26 MarriageDecide * Income Crosstabulation % within Income Income $50,000 $50,000- $100,000 or Less $100,000 or More MarriageDecide Voters 55% 65% 57% Legislature/Governor 14% 11% 14% Courts 5% 8% 9% Federal 19% 11% 11% Other/Unsure 7% 5% 9% Total 100% 100% 100% MarriageDecide * Voted2008 Crosstabulation % within Voted2008 Voted2008 No Yes MarriageDecide Voters 72% 58% Legislature/Governor 5% 13% Courts 2% 8% Federal 11% 14% Other/Unsure 11% 7% Total 100% 100% MarriageDecide * Voted2010 Crosstabulation % within Voted2010 Voted2010 No Yes MarriageDecide Voters 61% 58% Legislature/Governor 10% 12% Courts 5% 7% Federal 13% 14% Other/Unsure 11% 7% Total 100% 100%
- 13. 27 CivilUnion * Marriage Crosstabulation % within Marriage Marriage Doesn't Yes No Matter Unsure CivilUnion Support 95% 11% 29% 25% Oppose 4% 78% 14% 6% Doesn't Matter 1% 7% 52% 13% Unsure 0% 4% 5% 56% Total 100% 100% 100% 100% CivilUnion * MarriageDecide Crosstabulation % within MarriageDecide MarriageDecide Voters Legislature/Governor Courts Federal Other/Unsure CivilUnion Support 38% 71% 62% 63% 43% Oppose 53% 18% 24% 31% 28% Doesn't Matter 6% 10% 10% 4% 10% Unsure 2% 1% 4% 2% 19% Total 100% 100% 100% 100% 100% Marriage * CivilUnion Crosstabulation % within CivilUnion CivilUnion Doesn't Support Oppose Matter Unsure Marriage Yes 84% 4% 4% 4% No 11% 94% 49% 54% Doesn't Matter 4% 2% 43% 8% Unsure 1% 0% 4% 35% Total 100% 100% 100% 100% Marriage * MarriageDecide Crosstabulation % within MarriageDecide MarriageDecide Voters Legislature/Governor Courts Federal Other/Unsure Marriage Yes 32% 73% 61% 53% 36% No 61% 24% 31% 39% 39% Doesn't Matter 5% 1% 8% 6% 14% Unsure 2% 1% 2% 12% Total 100% 100% 100% 100% 100%
- 14. 28 MarriageDecide * CivilUnion Crosstabulation % within CivilUnion CivilUnion Doesn't Support Oppose Matter Unsure MarriageDecide Voters 48% 75% 54% 38% Legislature/Governor 17% 5% 16% 4% Courts 9% 4% 10% 8% Federal 18% 10% 8% 8% Other/Unsure 7% 5% 12% 42% Total 100% 100% 100% 100% MarriageDecide * Marriage Crosstabulation % within Marriage Marriage Doesn't Yes No Matter Unsure MarriageDecide Voters 45% 73% 55% 41% Legislature/Governor 20% 6% 2% 6% Courts 10% 5% 10% Federal 17% 11% 14% 12% Other/Unsure 7% 6% 19% 41% Total 100% 100% 100% 100%