Citizenship entry
•
0 j'aime•216 vues

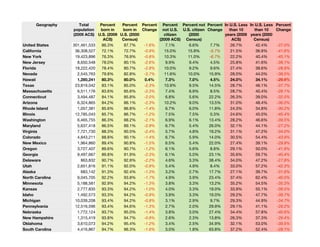
The document provides demographic data for states and counties in the US, including total population, percentage of population born in the US, percentage who are not US citizens, and percentages of population living in the US for less than 10 years. It shows that states on the west coast like California and states in the northeast like New York have lower percentages of population born in the US and higher percentages born abroad compared to other states. At the county level, it provides similar data for counties in Hawaii, showing Honolulu County has a lower percentage of population born in the US compared to other Hawaii counties.

Recommandé
Contenu connexe
Tendances
Tendances (20)
En vedette
Similaire à Citizenship entry
Similaire à Citizenship entry (20)
Plus de Honolulu Civil Beat
Plus de Honolulu Civil Beat (20)
Citizenship entry
- 1. Geography Total Percent Percent Percent Percent Percent not Percent In U.S. Less In U.S. Less Percent population born in born in Change not U.S. U.S. citizen Change than 10 than 10 Change (2009 ACS) U.S. (2009 U.S. (2000 citizen (2000 years (2009 years (2000 ACS) Census) (2009 ACS) Census) ACS) Census) United States 301,461,533 86.3% 87.7% -1.6% 7.1% 6.6% 7.7% 26.7% 42.4% -37.0% California 36,308,527 72.1% 72.7% -0.9% 15.0% 15.9% -5.7% 21.5% 36.9% -41.6% New York 19,423,896 76.3% 76.9% -0.8% 10.3% 11.0% -6.7% 22.2% 40.4% -45.1% New Jersey 8,650,548 78.0% 80.1% -2.6% 9.9% 9.4% 4.5% 25.8% 41.6% -38.1% Florida 18,222,420 78.4% 80.7% -2.8% 10.0% 9.2% 9.6% 27.4% 38.6% -28.9% Nevada 2,545,763 79.8% 82.8% -3.7% 11.6% 10.0% 15.9% 28.0% 44.0% -36.5% Hawaii 1,280,241 80.3% 80.0% 0.4% 7.3% 7.0% 4.5% 24.0% 34.1% -29.6% Texas 23,819,042 83.1% 85.0% -2.3% 10.9% 9.5% 14.5% 28.7% 46.1% -37.7% Massachusetts 6,511,176 83.6% 85.6% -2.3% 7.4% 6.9% 8.5% 28.7% 40.4% -29.1% Connecticut 3,494,487 84.1% 85.8% -2.0% 6.8% 5.6% 22.2% 26.3% 39.0% -32.5% Arizona 6,324,865 84.2% 86.1% -2.3% 10.2% 9.0% 13.5% 31.0% 48.4% -36.0% Rhode Island 1,057,381 85.6% 86.8% -1.4% 6.7% 6.0% 11.8% 24.3% 34.8% -30.2% Illinois 12,785,043 85.7% 86.7% -1.2% 7.5% 7.5% 0.3% 24.6% 45.0% -45.4% Washington 6,465,755 86.3% 88.2% -2.1% 6.9% 6.1% 13.4% 28.2% 46.6% -39.5% Maryland 5,637,418 86.5% 89.1% -2.9% 6.7% 5.4% 26.0% 32.1% 44.1% -27.2% Virginia 7,721,730 88.3% 90.5% -2.4% 5.7% 4.8% 19.2% 31.1% 47.2% -34.0% Colorado 4,843,211 88.8% 90.1% -1.4% 6.7% 5.9% 14.0% 30.5% 54.4% -43.9% New Mexico 1,964,860 89.4% 90.8% -1.5% 6.5% 5.4% 22.0% 27.4% 39.1% -29.9% Oregon 3,727,407 89.6% 90.7% -1.2% 6.1% 5.6% 8.8% 29.1% 50.0% -41.9% Georgia 9,497,667 89.8% 91.9% -2.3% 6.1% 5.0% 23.1% 35.6% 59.7% -40.4% Delaware 863,832 90.7% 92.8% -2.2% 4.6% 3.3% 38.4% 34.0% 47.2% -27.9% Utah 2,651,816 91.1% 92.0% -0.9% 5.4% 4.9% 8.4% 33.0% 57.2% -42.3% Alaska 683,142 91.3% 92.4% -1.3% 3.2% 2.7% 17.7% 27.1% 39.7% -31.6% North Carolina 9,045,705 92.2% 93.8% -1.7% 4.9% 3.9% 23.4% 37.4% 62.4% -40.0% Minnesota 5,188,581 92.9% 94.2% -1.3% 3.8% 3.3% 13.2% 35.2% 54.5% -35.3% Kansas 2,777,835 93.3% 94.2% -1.0% 4.0% 3.3% 19.0% 33.9% 55.1% -38.5% Idaho 1,492,573 93.3% 94.2% -0.9% 3.9% 3.3% 19.0% 29.2% 47.7% -38.7% Michigan 10,039,208 93.4% 94.2% -0.8% 3.1% 2.9% 9.7% 29.3% 44.9% -34.7% Pennsylvania 12,516,596 93.4% 94.6% -1.3% 2.7% 2.0% 29.9% 29.1% 41.1% -29.2% Nebraska 1,772,124 93.7% 95.0% -1.4% 3.8% 3.0% 27.4% 34.4% 57.8% -40.6% New Hampshire 1,315,419 93.8% 94.7% -0.9% 2.6% 2.3% 13.8% 26.3% 37.3% -29.4% Oklahoma 3,610,073 94.2% 95.4% -1.2% 3.4% 2.5% 34.9% 32.1% 53.0% -39.5% South Carolina 4,416,867 94.7% 96.3% -1.6% 3.0% 1.8% 63.8% 37.2% 52.4% -29.1%
- 2. Geography Total Percent Percent Percent Percent Percent not Percent In U.S. Less In U.S. Less Percent population born in born in Change not U.S. U.S. citizen Change than 10 than 10 Change (2009 ACS) U.S. (2009 U.S. (2000 citizen (2000 years (2009 years (2000 ACS) Census) (2009 ACS) Census) ACS) Census) Wisconsin 5,599,420 95.0% 95.8% -0.8% 2.5% 2.2% 15.7% 31.0% 46.8% -33.8% Tennessee 6,158,953 95.2% 96.6% -1.4% 2.8% 1.9% 51.6% 38.1% 57.7% -34.1% Indiana 6,342,469 95.3% 96.4% -1.1% 2.7% 1.9% 41.5% 36.0% 52.2% -31.2% Arkansas 2,838,143 95.4% 96.7% -1.3% 2.8% 1.9% 46.4% 33.0% 55.3% -40.4% Vermont 620,414 95.4% 95.4% 0.0% 1.7% 1.8% -4.2% 21.6% 35.3% -39.0% Maine 1,316,380 95.7% 96.2% -0.5% 1.6% 1.3% 21.6% 21.6% 28.3% -23.6% Ohio 11,511,858 95.7% 96.4% -0.7% 1.9% 1.5% 25.2% 30.4% 42.2% -27.9% Iowa 2,978,880 95.8% 96.5% -0.7% 2.4% 2.1% 16.1% 33.0% 57.5% -42.5% Missouri 5,904,382 95.8% 96.7% -0.9% 2.0% 1.6% 28.2% 33.5% 52.4% -36.1% Louisiana 4,411,546 96.3% 96.8% -0.5% 1.7% 1.3% 27.4% 29.0% 37.0% -21.6% Alabama 4,633,360 96.3% 97.3% -1.0% 2.0% 1.2% 60.8% 36.9% 53.0% -30.4% Wyoming 523,949 96.5% 97.0% -0.5% 1.8% 1.2% 47.2% 31.7% 37.8% -16.3% Kentucky 4,252,000 96.6% 97.5% -0.9% 1.9% 1.3% 41.9% 41.0% 58.8% -30.3% North Dakota 639,725 97.1% 97.5% -0.4% 1.3% 1.1% 24.5% 39.0% 52.3% -25.6% South Dakota 796,513 97.2% 97.7% -0.5% 1.3% 1.1% 25.7% 34.0% 55.0% -38.3% Montana 956,257 97.3% 97.4% -0.2% 0.9% 0.8% 15.0% 23.1% 29.0% -20.2% Mississippi 2,922,240 97.5% 98.1% -0.6% 1.3% 0.8% 52.1% 37.4% 49.6% -24.6% West Virginia 1,811,403 98.3% 98.6% -0.2% 0.6% 0.5% 28.9% 26.9% 35.7% -24.5% Hawaii County 172,370 87.3% 88.3% -1.2% 5.9% 5.0% 19.9% 27.3% 37.3% -26.8% Honolulu County 902,564 78.2% 77.8% 0.5% 7.7% 7.5% 3.0% 24.0% 34.0% -29.6% Kauai County 63,033 86.0% 85.9% 0.1% 5.7% 4.7% 19.9% 21.0% 27.3% -23.1% Maui County 142,196 82.1% 82.3% -0.2% 6.9% 6.7% 1.8% 22.5% 35.1% -35.7% Kaumakani 620 56.1% 62.3% -9.9% 26.5% 18.8% 40.8% 20.2% 41.2% -51.0% Waipahu 36,195 56.9% 58.5% -2.7% 15.8% 13.9% 13.5% 24.7% 35.5% -30.4% Pahoa 762 58.5% 76.4% -23.4% 24.0% 8.6% 179.4% 22.8% 33.2% -31.3% Whitmore Village 3,693 62.8% 64.4% -2.6% 9.6% 11.9% -19.1% 13.7% 30.7% -55.4% Haliimaile 1,069 65.3% 50.2% 30.0% 20.1% 25.1% -19.7% 49.6% 54.0% -8.1% Ewa Villages 5,673 67.4% 61.7% 9.3% 13.3% 13.1% 1.4% 27.3% 31.7% -14.0% Kahului 22,174 68.8% 72.6% -5.3% 11.9% 10.7% 11.7% 19.3% 40.4% -52.1% Lahaina 10,134 70.6% 70.1% 0.6% 12.3% 11.2% 9.9% 20.4% 33.9% -39.7% Lanai City 2,868 70.9% 68.1% 4.0% 8.9% 9.2% -2.7% 23.4% 29.5% -20.6% Puhi 1,236 71.4% 64.8% 10.3% 6.5% 13.1% -50.5% 17.8% 31.2% -42.7% Honolulu 374,359 72.3% 71.9% 0.5% 11.5% 10.9% 5.1% 26.6% 38.3% -30.7%
- 3. Geography Total Percent Percent Percent Percent Percent not Percent In U.S. Less In U.S. Less Percent population born in born in Change not U.S. U.S. citizen Change than 10 than 10 Change (2009 ACS) U.S. (2009 U.S. (2000 citizen (2000 years (2009 years (2000 ACS) Census) (2009 ACS) Census) ACS) Census) Honokaa 2,642 72.9% 81.2% -10.3% 11.2% 6.1% 82.6% 30.3% 34.4% -12.0% Keaau 2,205 73.6% 73.2% 0.5% 13.5% 11.8% 13.9% 27.4% 40.8% -32.7% Laie 5,626 74.8% 75.1% -0.3% 16.4% 11.8% 39.6% 60.0% 50.5% 18.7% Halawa 12,850 75.0% 75.5% -0.7% 9.4% 6.0% 55.0% 26.1% 22.8% 14.7% Village Park 9,818 75.1% 69.9% 7.3% 5.7% 5.5% 4.6% 16.6% 18.5% -10.7% Ewa Gentry 4,562 75.5% 73.2% 3.2% 5.2% 8.9% -41.5% 22.8% 32.1% -29.0% Hanamaulu 3,728 75.6% 67.6% 11.9% 12.4% 14.9% -16.7% 16.8% 38.8% -56.6% Eleele 1,940 77.6% 71.6% 8.5% 7.9% 9.3% -14.3% 10.6% 32.9% -67.8% Ewa Beach 14,643 77.9% 70.0% 11.3% 6.1% 8.8% -29.8% 11.5% 25.1% -54.4% Waikoloa Village 5,802 78.1% 82.5% -5.3% 10.2% 9.6% 5.7% 10.7% 52.4% -79.6% Napili-Honokowai 7,357 78.7% 74.0% 6.4% 8.9% 10.3% -13.2% 31.4% 33.6% -6.4% Kahuku 2,336 79.6% 73.1% 8.9% 7.6% 6.8% 11.7% 11.5% 25.2% -54.2% Kilauea 2,444 79.7% 81.9% -2.7% 10.8% 7.6% 42.2% 30.3% 35.9% -15.5% Kailua (Hawaii County) 13,482 79.9% 84.8% -5.8% 11.4% 6.5% 75.5% 29.6% 45.7% -35.2% Waipio Acres 6,146 80.0% 82.0% -2.4% 6.7% 6.1% 8.6% 18.6% 19.9% -6.3% Kihei 19,809 80.2% 79.6% 0.8% 9.4% 7.9% 19.6% 33.5% 32.1% 4.3% Kapalua 382 80.4% 90.0% -10.7% 9.9% 4.0% 149.3% 30.7% 20.0% 53.3% Paia 3,212 80.4% 85.4% -5.8% 10.7% 6.5% 64.8% 38.1% 40.8% -6.5% Honalo 2,258 80.5% 90.0% -10.6% 12.3% 5.1% 143.0% 44.4% 48.8% -8.9% Kealakekua 1,895 80.6% 91.2% -11.6% 12.2% 4.5% 171.2% 37.9% 42.3% -10.5% Halaula 502 80.7% 82.8% -2.6% 8.2% 3.7% 117.9% 17.5% 22.9% -23.4% Waimalu 29,333 80.8% 82.2% -1.6% 6.5% 4.5% 45.0% 21.0% 27.3% -22.9% Iroquois Point 2,874 81.1% 90.6% -10.5% 5.3% 1.6% 229.5% 55.9% 25.0% 123.5% Hickam Housing 6,159 81.1% 84.7% -4.3% 2.8% 2.7% 6.0% 44.0% 39.4% 11.7% Koloa 2,304 81.8% 82.8% -1.2% 10.3% 4.4% 132.3% 27.4% 24.0% 14.5% Waihee-Waiehu 7,894 81.9% 77.0% 6.5% 3.9% 7.6% -49.6% 23.9% 30.8% -22.4% Holualoa 8,808 82.2% 86.3% -4.7% 11.8% 7.0% 68.9% 40.6% 55.7% -27.1% Waipio 11,843 82.2% 79.3% 3.7% 4.0% 4.8% -15.3% 10.3% 26.8% -61.8% Wahiawa 15,542 82.6% 82.4% 0.3% 4.2% 6.9% -38.8% 19.7% 40.3% -51.1% Hanapepe 2,358 83.2% 86.5% -3.7% 2.4% 3.5% -33.0% 18.7% 27.0% -30.6% Naalehu 1,271 83.6% 77.7% 7.5% 6.1% 10.1% -40.0% 29.7% 31.1% -4.7% Kalaoa 8,576 83.6% 91.7% -8.8% 5.4% 2.5% 119.7% 20.4% 19.0% 7.4% Kawela Bay 339 83.8% 82.5% 1.5% 8.3% 8.9% -6.8% 7.3% 50.0% -85.5%
- 4. Geography Total Percent Percent Percent Percent Percent not Percent In U.S. Less In U.S. Less Percent population born in born in Change not U.S. U.S. citizen Change than 10 than 10 Change (2009 ACS) U.S. (2009 U.S. (2000 citizen (2000 years (2009 years (2000 ACS) Census) (2009 ACS) Census) ACS) Census) Waikapu 1,213 83.9% 84.8% -1.0% 1.6% 3.8% -58.8% 5.1% 17.4% -70.5% Kaunakakai 2,543 84.1% 84.4% -0.4% 5.4% 4.2% 28.6% 10.9% 36.4% -70.2% Waialua 3,584 84.3% 76.5% 10.1% 2.3% 7.3% -68.6% 11.0% 25.2% -56.3% Makakilo City 15,575 84.3% 80.9% 4.3% 3.0% 4.3% -29.5% 9.5% 22.7% -58.4% Kapaa 9,821 84.6% 87.4% -3.2% 7.5% 3.7% 104.5% 33.2% 24.0% 38.2% Aiea 8,251 84.7% 83.9% 1.0% 5.2% 5.3% -2.5% 23.5% 37.5% -37.3% Kaanapali 986 84.9% 88.2% -3.7% 3.9% 5.4% -28.3% 10.7% 53.5% -79.9% Pepeekeo 1,747 84.9% 80.8% 5.1% 7.7% 6.7% 13.7% 38.8% 33.7% 15.2% Waimanalo 3,512 85.0% 81.3% 4.6% 4.9% 6.2% -21.3% 6.5% 34.3% -81.2% Paauilo 673 85.1% 87.3% -2.4% 7.3% 4.3% 69.2% 33.0% 13.0% 153.0% Kalihiwai 949 85.4% 88.0% -3.0% 6.8% 7.0% -1.9% 9.4% 34.1% -72.6% Mililani Town 27,617 85.4% 86.0% -0.7% 2.1% 3.0% -29.6% 13.0% 18.9% -31.0% Kekaha 3,124 85.4% 79.2% 7.9% 5.5% 6.2% -11.8% 13.6% 29.8% -54.2% Pearl City 27,729 85.4% 83.5% 2.3% 3.3% 4.0% -17.5% 16.3% 22.8% -28.3% Mokuleia 2,284 85.5% 94.5% -9.6% 4.5% 2.9% 56.6% 31.6% 46.6% -32.1% Pupukea 4,444 85.5% 88.0% -2.8% 6.9% 4.6% 48.9% 27.4% 28.5% -3.8% Orchidlands Estates 2,172 85.5% 79.4% 7.8% 6.1% 4.2% 44.5% 32.2% 13.3% 142.5% Nanawale Estates 1,229 85.6% 78.0% 9.8% 7.7% 10.6% -27.1% 40.1% 48.9% -18.0% Schofield Barracks 12,060 85.6% 89.2% -4.0% 2.4% 3.1% -23.2% 33.4% 50.4% -33.7% Pahala 1,373 85.7% 76.4% 12.1% 3.5% 8.7% -59.7% 1.5% 27.2% -94.4% Haiku-Pauwela 8,317 85.7% 91.4% -6.2% 6.5% 3.9% 66.7% 36.7% 37.0% -0.9% Maalaea 428 85.7% 89.2% -3.9% 6.5% 4.0% 65.0% 24.6% 7.3% 236.1% Wailea-Makena 6,589 85.8% 85.6% 0.3% 4.8% 5.9% -19.0% 13.1% 35.1% -62.8% Waimea (Hawaii County) 9,162 85.8% 89.1% -3.7% 6.6% 5.9% 12.1% 31.5% 30.2% 4.3% Papaikou 1,509 86.0% 85.2% 1.0% 5.2% 4.5% 15.3% 9.5% 36.7% -74.1% Waimea (Kauai County) 1,527 86.8% 91.2% -4.8% 9.4% 2.5% 284.1% 12.9% 22.2% -41.8% Kapaau 1,109 86.9% 91.0% -4.5% 5.5% 2.8% 94.8% 29.7% 19.1% 54.9% Waianae 11,960 87.4% 91.4% -4.5% 5.6% 3.0% 85.0% 23.5% 34.6% -31.9% Kukuihaele 350 87.7% 94.8% -7.5% 0.0% 3.6% -100.0% 0.0% 47.1% -100.0% Hawaiian Beaches 3,979 88.1% 91.4% -3.7% 7.1% 1.9% 281.4% 9.9% 23.7% -58.3% Kahaluu-Keauhou 2,969 88.2% 89.7% -1.7% 8.5% 6.1% 39.5% 44.4% 42.6% 4.3% Puako 838 88.2% 81.0% 8.9% 3.3% 9.9% -66.1% 4.0% 59.4% -93.2% Maili 5,113 88.3% 85.3% 3.5% 2.0% 2.6% -24.9% 22.4% 21.3% 5.3%
- 5. Geography Total Percent Percent Percent Percent Percent not Percent In U.S. Less In U.S. Less Percent population born in born in Change not U.S. U.S. citizen Change than 10 than 10 Change (2009 ACS) U.S. (2009 U.S. (2000 citizen (2000 years (2009 years (2000 ACS) Census) (2009 ACS) Census) ACS) Census) Captain Cook 3,242 88.4% 92.0% -3.9% 5.9% 3.9% 50.3% 36.2% 28.8% 25.5% Poipu 1,025 88.5% 91.3% -3.1% 5.5% 1.7% 213.7% 5.9% 16.5% -64.0% Lihue 6,616 88.8% 90.4% -1.8% 2.9% 2.2% 30.0% 17.5% 18.0% -3.0% Haleiwa 2,110 88.9% 86.4% 2.9% 5.6% 7.3% -23.6% 22.6% 46.6% -51.4% Leilani Estates 1,367 89.1% 85.5% 4.2% 4.0% 4.0% 1.0% 8.1% 30.6% -73.7% Omao 1,373 89.2% 82.3% 8.4% 5.0% 3.3% 53.8% 14.2% 23.3% -39.0% Kaaawa 1,078 89.3% 91.6% -2.5% 4.5% 1.6% 186.6% 39.1% 21.9% 78.9% Wheeler AFB 2,900 89.3% 86.3% 3.5% 3.4% 3.1% 10.9% 52.4% 55.4% -5.3% Hawaiian Paradise Park 7,596 89.3% 88.0% 1.5% 4.7% 4.4% 7.2% 24.2% 30.3% -20.1% Wailuku 14,060 89.4% 87.0% 2.7% 2.7% 5.4% -49.4% 14.1% 33.8% -58.3% Wailua 2,607 89.9% 90.7% -0.9% 4.9% 3.7% 33.8% 24.6% 17.3% 42.6% Hauula 3,260 89.9% 85.4% 5.2% 2.5% 5.3% -52.8% 13.1% 28.9% -54.7% Wainaku 1,543 90.0% 72.9% 23.6% 1.1% 9.9% -88.9% 6.5% 34.7% -81.3% Hawaiian Acres 1,905 90.3% 93.2% -3.1% 4.0% 3.1% 28.3% 36.2% 45.4% -20.2% Maunawili 4,807 90.5% 90.7% -0.3% 2.6% 1.6% 65.1% 21.4% 10.6% 101.0% Kailua (Honolulu County) 34,306 90.5% 90.7% -0.2% 2.5% 2.7% -6.0% 13.3% 23.0% -42.4% Kaneohe 33,270 90.6% 91.6% -1.2% 2.4% 2.1% 12.3% 20.9% 17.2% 21.6% Hilo 48,053 90.6% 91.7% -1.2% 4.1% 3.6% 12.0% 31.5% 38.8% -18.7% Kahaluu 2,592 90.8% 91.3% -0.6% 1.4% 3.1% -56.7% 19.7% 37.2% -47.2% Kualapuu 1,693 90.8% 89.8% 1.1% 1.9% 3.1% -36.8% 10.9% 31.6% -65.6% Ahuimanu 8,953 90.8% 93.1% -2.5% 1.7% 0.5% 233.5% 5.5% 14.2% -61.5% Paukaa 523 90.8% 88.7% 2.4% 4.8% 1.3% 272.1% 0.0% 13.6% -100.0% Laupahoehoe 579 91.0% 95.9% -5.1% 2.6% 0.9% 198.6% 13.5% 6.7% 101.9% Nanakuli 10,402 91.4% 91.5% -0.2% 1.6% 2.3% -31.8% 7.3% 31.4% -76.6% Punaluu 765 91.4% 87.0% 5.0% 3.0% 2.7% 10.6% 0.0% 18.1% -100.0% Ainaloa 2,254 91.7% 88.4% 3.6% 1.7% 2.8% -40.3% 0.0% 57.9% -100.0% Kaneohe Station 10,809 91.7% 88.6% 3.6% 2.5% 4.0% -38.7% 32.5% 38.2% -14.9% Makaha Valley 1,298 91.8% 93.9% -2.3% 3.4% 1.3% 157.2% 26.2% 17.0% 54.1% Lawai 1,810 91.9% 96.0% -4.3% 0.8% 0.9% -14.4% 0.0% 5.6% -100.0% Heeia 4,287 92.2% 90.3% 2.1% 1.8% 2.9% -35.8% 30.5% 30.6% -0.3% Kurtistown 1,061 92.3% 87.9% 5.0% 3.1% 6.1% -49.3% 6.1% 26.9% -77.3% Wailua Homesteads 5,222 92.6% 91.7% 1.0% 2.0% 4.5% -55.8% 7.5% 19.9% -62.3% Pukalani 8,617 92.7% 94.5% -1.9% 1.4% 1.0% 42.2% 9.4% 26.5% -64.5%
- 6. Geography Total Percent Percent Percent Percent Percent not Percent In U.S. Less In U.S. Less Percent population born in born in Change not U.S. U.S. citizen Change than 10 than 10 Change (2009 ACS) U.S. (2009 U.S. (2000 citizen (2000 years (2009 years (2000 ACS) Census) (2009 ACS) Census) ACS) Census) Princeville 1,853 92.9% 92.9% 0.0% 2.5% 1.9% 27.7% 27.5% 32.5% -15.5% Fern Forest 571 93.3% 91.0% 2.5% 3.7% 3.1% 20.3% 0.0% 60.9% -100.0% Hawaiian Ocean View 2,699 93.4% 91.9% 1.6% 2.6% 4.6% -42.3% 38.0% 44.1% -13.9% Barbers Point Housing 62 93.5% 86.1% 8.6% 0.0% 0.0% 0.0% 0.0% Makawao 6,249 93.9% 94.5% -0.7% 1.9% 2.3% -16.3% 3.9% 39.8% -90.2% Makaha 7,104 93.9% 93.3% 0.6% 2.2% 2.3% -4.5% 6.2% 17.6% -64.6% Fern Acres 829 94.1% 96.2% -2.2% 0.6% 0.0% 10.2% 65.0% -84.3% Volcano 2,211 94.7% 94.2% 0.6% 2.9% 2.7% 5.8% 43.6% 37.5% 16.2% Hawi 1,025 94.7% 90.2% 5.1% 0.5% 3.7% -86.7% 9.3% 33.3% -72.2% Anahola 1,924 94.9% 96.9% -2.1% 2.6% 1.4% 84.2% 15.2% 19.6% -22.6% Honomu 529 95.1% 85.9% 10.7% 2.8% 8.6% -66.9% 19.2% 37.7% -49.0% Mountain View 2,974 95.1% 91.3% 4.2% 1.1% 3.3% -66.2% 29.0% 34.7% -16.5% Kalaheo 4,275 95.3% 92.9% 2.6% 1.4% 1.4% 1.2% 29.7% 10.9% 173.7% Hanalei 572 95.3% 89.6% 6.3% 2.3% 2.7% -15.6% 0.0% 37.5% -100.0% Honaunau-Napoopoo 2,488 95.8% 89.9% 6.6% 1.8% 5.8% -68.6% 0.0% 50.5% -100.0% Waikane 1,012 96.5% 91.9% 5.0% 0.5% 3.8% -86.8% 0.0% 38.5% -100.0% Pakala Village 332 97.3% 96.3% 1.1% 0.0% 1.9% -100.0% 0.0% 0.0% Eden Roc 608 97.7% 97.6% 0.1% 0.0% 2.4% -100.0% 0.0% 100.0% -100.0% Waimanalo Beach 4,225 98.1% 96.8% 1.3% 0.2% 1.4% -84.4% 0.0% 23.5% -100.0% Maunaloa 371 98.9% 89.1% 11.0% 0.0% 1.8% -100.0% 0.0% 20.0% -100.0% Hana 549 99.5% 97.2% 2.4% 0.5% 1.3% -59.5% 0.0% 0.0%