SlideShare une entreprise Scribd logo
1  sur  2
Télécharger pour lire hors ligne
Geography       Owner-      Median value Median value   Percent $500K+ Houses $500K+ Houses    Percent
                  Occupied Units (2009 ACS) (2000 Census)     Change    (2009 ACS)   (2000 Census)   Change
                    (2009 ACS)
United States          75,320,422  $185,400     $111,800      65.8%       12.7%          2.9%        330.3%
Hawaii                    254,414  $521,500     $249,300      109.2%      52.6%          9.6%        450.1%
California              7,061,432  $479,200     $198,900      140.9%      47.0%         11.0%        325.6%
Massachusetts           1,601,780  $357,600     $182,800      95.6%       23.6%          5.6%        323.9%
New Jersey              2,116,888  $356,800     $167,900      112.5%      24.9%          4.4%        461.5%
Maryland                1,455,564  $326,400     $143,300      127.8%      21.9%          3.0%        622.6%
New York                3,977,522  $300,600     $147,600      103.7%      26.3%          5.1%        412.6%
Connecticut               922,187  $295,800     $160,600      84.2%       19.6%          6.7%        190.1%
Rhode Island              256,593  $283,700     $130,500      117.4%      12.5%          1.8%        601.2%
Washington              1,641,669  $277,600     $158,800      74.8%       16.5%          3.9%        327.0%
Nevada                    573,339  $275,300     $132,500      107.8%      13.9%          2.1%        577.2%
New Hampshire             366,660  $253,000     $127,500      98.4%       8.3%           1.4%        485.8%
Virginia                2,030,965  $247,100     $118,800      108.0%      18.5%          2.3%        710.1%
Oregon                    941,487  $244,200     $145,800      67.5%       11.9%          2.4%        387.1%
Delaware                  239,036  $235,000     $122,000      92.6%       8.4%           1.4%        510.5%
Colorado                1,274,736  $234,100     $160,100      46.2%       11.3%          3.8%        198.8%
Alaska                    149,672  $221,300     $137,400      61.1%       5.8%           1.2%        389.9%
Arizona                 1,535,318  $218,400     $109,400      99.6%       11.4%          1.9%        489.8%
Florida                 4,933,594  $211,300      $93,200      126.7%      10.9%          2.1%        425.7%
Utah                      599,129  $208,100     $142,600      45.9%       7.1%           2.0%        245.8%
Minnesota               1,543,424  $207,000     $118,100      75.3%       6.8%           1.3%        431.5%
Vermont                   179,710  $200,600     $111,200      80.4%       6.4%           1.5%        342.4%
Illinois                3,292,685  $200,400     $127,800      56.8%       9.3%           2.8%        232.0%
Maine                     395,233  $172,100      $94,300      82.5%       5.7%           1.2%        386.2%
Idaho                     393,813  $166,700     $102,100      63.3%       5.9%           1.6%        270.0%
Wisconsin               1,569,229  $166,100     $109,900      51.1%       3.9%           1.0%        283.6%
Wyoming                   145,585  $163,400      $91,500      78.6%       6.5%           2.4%        171.1%
Montana                   257,118  $162,100      $95,800      69.2%       6.6%           2.0%        234.6%
Georgia                 2,307,248  $160,100     $100,600      59.1%       6.1%           1.9%        212.0%
Pennsylvania            3,496,696  $152,300      $94,800      60.7%       5.1%           1.2%        327.7%
New Mexico                512,671  $150,500      $94,600      59.1%       5.5%           1.6%        248.5%
Michigan                2,879,917  $147,500     $110,300      33.7%       3.4%           1.5%        128.1%
North Carolina          2,410,327  $143,700      $95,800      50.0%       5.1%           1.5%        243.6%
Geography       Owner-      Median value Median value Percent $500K+ Houses $500K+ Houses    Percent
                  Occupied Units (2009 ACS) (2000 Census) Change      (2009 ACS)   (2000 Census)   Change
                    (2009 ACS)
Missouri                1,633,039  $134,500      $86,900     54.8%       3.2%          1.2%        162.0%
Ohio                    3,145,085  $134,500     $100,500     33.8%       2.3%          1.0%        128.1%
Tennessee               1,682,052  $128,500      $88,300     45.5%       3.6%          1.3%        187.7%
South Carolina          1,190,603  $128,400      $83,100     54.5%       5.2%          1.5%        252.5%
Louisiana               1,120,844  $121,300      $77,500     56.5%       2.6%          0.9%        192.6%
Indiana                 1,764,450  $120,200      $92,500     29.9%       2.1%          0.9%        144.5%
Nebraska                  476,856  $119,700      $86,900     37.7%       1.7%          0.7%        138.3%
Texas                   5,350,206  $118,900      $77,800     52.8%       3.3%          1.3%        153.4%
Kansas                    760,084  $118,500      $81,000     46.3%       2.2%          0.7%        191.3%
Iowa                      886,444  $115,800      $82,100     41.0%       1.7%          0.6%        173.6%
South Dakota              215,715  $115,400      $74,300     55.3%       2.3%          0.7%        222.9%
Kentucky                1,175,984  $113,100      $79,600     42.1%       2.3%          0.8%        192.2%
Alabama                 1,287,432  $111,900      $76,700     45.9%       3.1%          1.1%        192.7%
North Dakota              179,318  $104,300      $68,300     52.7%       1.2%          0.3%        265.1%
Oklahoma                  954,234   $98,800      $67,700     45.9%       1.7%          0.6%        182.8%
Arkansas                  749,491   $97,200      $67,400     44.2%       2.1%          0.7%        202.6%
Mississippi               765,487   $91,400      $64,700     41.3%       1.7%          0.7%        159.3%
West Virginia             554,391   $91,400      $66,000     38.5%       1.7%          0.5%        267.5%

Contenu connexe

Tendances

Caída Publicidad EEUU 2009
Caída Publicidad EEUU 2009Caída Publicidad EEUU 2009
Caída Publicidad EEUU 2009Juan Varela
 
Languages Spoken in the Home — 2009 Breakdown
Languages Spoken in the Home — 2009 BreakdownLanguages Spoken in the Home — 2009 Breakdown
Languages Spoken in the Home — 2009 BreakdownHonolulu Civil Beat
 
Dr. Kyle Coble - Introduction: How Do We Define Wean Age
Dr. Kyle Coble - Introduction: How Do We Define Wean AgeDr. Kyle Coble - Introduction: How Do We Define Wean Age
Dr. Kyle Coble - Introduction: How Do We Define Wean AgeJohn Blue
 
Napco Better Result
Napco Better ResultNapco Better Result
Napco Better Resultpmoskie
 
Real Time Enrollment of IPS and Charter Schools
Real Time Enrollment of IPS and Charter SchoolsReal Time Enrollment of IPS and Charter Schools
Real Time Enrollment of IPS and Charter SchoolsAbdul-Hakim Shabazz
 
Assessing the Economics of Obesity and Obesity Interventions by Michael J. O'...
Assessing the Economics of Obesity and Obesity Interventions by Michael J. O'...Assessing the Economics of Obesity and Obesity Interventions by Michael J. O'...
Assessing the Economics of Obesity and Obesity Interventions by Michael J. O'...Wisconsin Women's Health Foundation
 
Pavilion budget 2018 increase in maintenance
Pavilion budget 2018 increase in maintenancePavilion budget 2018 increase in maintenance
Pavilion budget 2018 increase in maintenanceal karajo jr
 
(EN) 2021 Korea Social Media Marketing Benchmark Index Report [SM2Networks]
(EN) 2021 Korea Social Media Marketing Benchmark Index Report [SM2Networks](EN) 2021 Korea Social Media Marketing Benchmark Index Report [SM2Networks]
(EN) 2021 Korea Social Media Marketing Benchmark Index Report [SM2Networks]디센트릭 DnA팀
 
Cody A. Ray DEXA Report 3/21/2013
Cody A. Ray DEXA Report 3/21/2013Cody A. Ray DEXA Report 3/21/2013
Cody A. Ray DEXA Report 3/21/2013Cody Ray
 

Tendances (16)

Race Breakdown 2009
Race Breakdown 2009Race Breakdown 2009
Race Breakdown 2009
 
Caída Publicidad EEUU 2009
Caída Publicidad EEUU 2009Caída Publicidad EEUU 2009
Caída Publicidad EEUU 2009
 
Languages Spoken in the Home — 2009 Breakdown
Languages Spoken in the Home — 2009 BreakdownLanguages Spoken in the Home — 2009 Breakdown
Languages Spoken in the Home — 2009 Breakdown
 
Dr. Kyle Coble - Introduction: How Do We Define Wean Age
Dr. Kyle Coble - Introduction: How Do We Define Wean AgeDr. Kyle Coble - Introduction: How Do We Define Wean Age
Dr. Kyle Coble - Introduction: How Do We Define Wean Age
 
Napco Better Result
Napco Better ResultNapco Better Result
Napco Better Result
 
Race Breakdown 2000
Race Breakdown 2000Race Breakdown 2000
Race Breakdown 2000
 
Hawaii Towns Transportation
Hawaii Towns TransportationHawaii Towns Transportation
Hawaii Towns Transportation
 
Hawaii Towns Departure Time
Hawaii Towns Departure TimeHawaii Towns Departure Time
Hawaii Towns Departure Time
 
Real Time Enrollment of IPS and Charter Schools
Real Time Enrollment of IPS and Charter SchoolsReal Time Enrollment of IPS and Charter Schools
Real Time Enrollment of IPS and Charter Schools
 
Assessing the Economics of Obesity and Obesity Interventions by Michael J. O'...
Assessing the Economics of Obesity and Obesity Interventions by Michael J. O'...Assessing the Economics of Obesity and Obesity Interventions by Michael J. O'...
Assessing the Economics of Obesity and Obesity Interventions by Michael J. O'...
 
Educational Attainment by Age
Educational Attainment by AgeEducational Attainment by Age
Educational Attainment by Age
 
Pavilion budget 2018 increase in maintenance
Pavilion budget 2018 increase in maintenancePavilion budget 2018 increase in maintenance
Pavilion budget 2018 increase in maintenance
 
Towns Race
Towns RaceTowns Race
Towns Race
 
10-Year Changes 2000-2009
10-Year Changes 2000-200910-Year Changes 2000-2009
10-Year Changes 2000-2009
 
(EN) 2021 Korea Social Media Marketing Benchmark Index Report [SM2Networks]
(EN) 2021 Korea Social Media Marketing Benchmark Index Report [SM2Networks](EN) 2021 Korea Social Media Marketing Benchmark Index Report [SM2Networks]
(EN) 2021 Korea Social Media Marketing Benchmark Index Report [SM2Networks]
 
Cody A. Ray DEXA Report 3/21/2013
Cody A. Ray DEXA Report 3/21/2013Cody A. Ray DEXA Report 3/21/2013
Cody A. Ray DEXA Report 3/21/2013
 

Similaire à Home Value State Rankings

States Sorted by High School Grad
States Sorted by High School GradStates Sorted by High School Grad
States Sorted by High School GradHonolulu Civil Beat
 
Rebgv stats package%2_c_october_2011_%282%29
Rebgv stats package%2_c_october_2011_%282%29Rebgv stats package%2_c_october_2011_%282%29
Rebgv stats package%2_c_october_2011_%282%29vancouverhomesteam
 
October 2011 REBGV Stats Mike Stewart
October 2011 REBGV Stats Mike StewartOctober 2011 REBGV Stats Mike Stewart
October 2011 REBGV Stats Mike StewartMike Stewart
 
Rebgv stats package%2_c_october_2011_%282%29
Rebgv stats package%2_c_october_2011_%282%29Rebgv stats package%2_c_october_2011_%282%29
Rebgv stats package%2_c_october_2011_%282%29vancouverhomesteam
 
November 2011-rebgv-stats-adam scalena
November 2011-rebgv-stats-adam scalenaNovember 2011-rebgv-stats-adam scalena
November 2011-rebgv-stats-adam scalenavancouverhomesteam
 
Vancouver real estate stats package, june 2011
Vancouver real estate stats package, june 2011Vancouver real estate stats package, june 2011
Vancouver real estate stats package, june 2011Matt Collinge
 
Vancouver real estate rebgv stats package january 2011
Vancouver real estate rebgv stats package january 2011Vancouver real estate rebgv stats package january 2011
Vancouver real estate rebgv stats package january 2011Matt Collinge
 
Vancouver real estate stats package September 2011
Vancouver real estate stats package September 2011Vancouver real estate stats package September 2011
Vancouver real estate stats package September 2011Matt Collinge
 
REBGV Stats for Sept 2011 Mike Stewart
REBGV Stats for Sept 2011 Mike StewartREBGV Stats for Sept 2011 Mike Stewart
REBGV Stats for Sept 2011 Mike StewartMike Stewart
 

Similaire à Home Value State Rankings (20)

States Sorted by High School Grad
States Sorted by High School GradStates Sorted by High School Grad
States Sorted by High School Grad
 
Turkish consulate
Turkish consulateTurkish consulate
Turkish consulate
 
Travel Time State Rankings
Travel Time State RankingsTravel Time State Rankings
Travel Time State Rankings
 
Departure Time State Rankings
Departure Time State RankingsDeparture Time State Rankings
Departure Time State Rankings
 
States Race
States RaceStates Race
States Race
 
State-by-State Comparison
State-by-State ComparisonState-by-State Comparison
State-by-State Comparison
 
Rebgv stats package%2_c_october_2011_%282%29
Rebgv stats package%2_c_october_2011_%282%29Rebgv stats package%2_c_october_2011_%282%29
Rebgv stats package%2_c_october_2011_%282%29
 
Stats Oct 11
Stats Oct 11Stats Oct 11
Stats Oct 11
 
October 2011 REBGV Stats Mike Stewart
October 2011 REBGV Stats Mike StewartOctober 2011 REBGV Stats Mike Stewart
October 2011 REBGV Stats Mike Stewart
 
Rebgv stats package%2_c_october_2011_%282%29
Rebgv stats package%2_c_october_2011_%282%29Rebgv stats package%2_c_october_2011_%282%29
Rebgv stats package%2_c_october_2011_%282%29
 
State Rankings 2009
State Rankings 2009State Rankings 2009
State Rankings 2009
 
Owner-Occupied State Rankings
Owner-Occupied State RankingsOwner-Occupied State Rankings
Owner-Occupied State Rankings
 
Occupancy Stats
Occupancy StatsOccupancy Stats
Occupancy Stats
 
November 2011-rebgv-stats-adam scalena
November 2011-rebgv-stats-adam scalenaNovember 2011-rebgv-stats-adam scalena
November 2011-rebgv-stats-adam scalena
 
Vancouver real estate stats package, june 2011
Vancouver real estate stats package, june 2011Vancouver real estate stats package, june 2011
Vancouver real estate stats package, june 2011
 
REBGV Stats Package Oct 2012
REBGV Stats Package Oct 2012REBGV Stats Package Oct 2012
REBGV Stats Package Oct 2012
 
Vancouver real estate rebgv stats package january 2011
Vancouver real estate rebgv stats package january 2011Vancouver real estate rebgv stats package january 2011
Vancouver real estate rebgv stats package january 2011
 
Vancouver real estate stats package September 2011
Vancouver real estate stats package September 2011Vancouver real estate stats package September 2011
Vancouver real estate stats package September 2011
 
September 2011 REBGV
September 2011 REBGV September 2011 REBGV
September 2011 REBGV
 
REBGV Stats for Sept 2011 Mike Stewart
REBGV Stats for Sept 2011 Mike StewartREBGV Stats for Sept 2011 Mike Stewart
REBGV Stats for Sept 2011 Mike Stewart
 

Plus de Honolulu Civil Beat

Gov. David Ige response to U.S. Rep. Anna Eshoo
Gov. David Ige response to U.S. Rep. Anna EshooGov. David Ige response to U.S. Rep. Anna Eshoo
Gov. David Ige response to U.S. Rep. Anna EshooHonolulu Civil Beat
 
Audit of the Department of the Honolulu Prosecuting Attorney’s Policies, Proc...
Audit of the Department of the Honolulu Prosecuting Attorney’s Policies, Proc...Audit of the Department of the Honolulu Prosecuting Attorney’s Policies, Proc...
Audit of the Department of the Honolulu Prosecuting Attorney’s Policies, Proc...Honolulu Civil Beat
 
Audit of the Honolulu Police Department’s Policies, Procedures, and Controls
Audit of the Honolulu Police Department’s Policies, Procedures, and ControlsAudit of the Honolulu Police Department’s Policies, Procedures, and Controls
Audit of the Honolulu Police Department’s Policies, Procedures, and ControlsHonolulu Civil Beat
 
2019 Use of Force Annual Report HPD
2019 Use of Force Annual Report HPD 2019 Use of Force Annual Report HPD
2019 Use of Force Annual Report HPD Honolulu Civil Beat
 
Office of Health Equity Goals Draft 10
Office of Health Equity Goals Draft 10Office of Health Equity Goals Draft 10
Office of Health Equity Goals Draft 10Honolulu Civil Beat
 
ACLU Letter to HPD regarding racial profiling
ACLU Letter to HPD regarding racial profilingACLU Letter to HPD regarding racial profiling
ACLU Letter to HPD regarding racial profilingHonolulu Civil Beat
 
ACLU Letter to HPD regarding racial profiling
ACLU Letter to HPD regarding racial profilingACLU Letter to HPD regarding racial profiling
ACLU Letter to HPD regarding racial profilingHonolulu Civil Beat
 
Guam Governor's Letter to Pence
Guam Governor's Letter to Pence Guam Governor's Letter to Pence
Guam Governor's Letter to Pence Honolulu Civil Beat
 
List Of Pro Bono Legal Service Providers
List Of Pro Bono Legal Service ProvidersList Of Pro Bono Legal Service Providers
List Of Pro Bono Legal Service ProvidersHonolulu Civil Beat
 
Arbitration Hearing Transcript December 2018
Arbitration Hearing Transcript December 2018Arbitration Hearing Transcript December 2018
Arbitration Hearing Transcript December 2018Honolulu Civil Beat
 

Plus de Honolulu Civil Beat (20)

Gov. David Ige response to U.S. Rep. Anna Eshoo
Gov. David Ige response to U.S. Rep. Anna EshooGov. David Ige response to U.S. Rep. Anna Eshoo
Gov. David Ige response to U.S. Rep. Anna Eshoo
 
Audit of the Department of the Honolulu Prosecuting Attorney’s Policies, Proc...
Audit of the Department of the Honolulu Prosecuting Attorney’s Policies, Proc...Audit of the Department of the Honolulu Prosecuting Attorney’s Policies, Proc...
Audit of the Department of the Honolulu Prosecuting Attorney’s Policies, Proc...
 
Audit of the Honolulu Police Department’s Policies, Procedures, and Controls
Audit of the Honolulu Police Department’s Policies, Procedures, and ControlsAudit of the Honolulu Police Department’s Policies, Procedures, and Controls
Audit of the Honolulu Police Department’s Policies, Procedures, and Controls
 
2019 Use of Force Annual Report HPD
2019 Use of Force Annual Report HPD 2019 Use of Force Annual Report HPD
2019 Use of Force Annual Report HPD
 
Office of Health Equity Goals Draft 10
Office of Health Equity Goals Draft 10Office of Health Equity Goals Draft 10
Office of Health Equity Goals Draft 10
 
NHPI COVID-19 Statement
NHPI COVID-19 StatementNHPI COVID-19 Statement
NHPI COVID-19 Statement
 
DLIR Response Language Access
DLIR Response Language AccessDLIR Response Language Access
DLIR Response Language Access
 
Language Access Letter To DLIR
Language Access Letter To DLIRLanguage Access Letter To DLIR
Language Access Letter To DLIR
 
ACLU Letter to HPD regarding racial profiling
ACLU Letter to HPD regarding racial profilingACLU Letter to HPD regarding racial profiling
ACLU Letter to HPD regarding racial profiling
 
ACLU Letter to HPD regarding racial profiling
ACLU Letter to HPD regarding racial profilingACLU Letter to HPD regarding racial profiling
ACLU Letter to HPD regarding racial profiling
 
Jane Doe v. Rehab Hospital
Jane Doe v. Rehab HospitalJane Doe v. Rehab Hospital
Jane Doe v. Rehab Hospital
 
Coronavirus HPHA
Coronavirus HPHA Coronavirus HPHA
Coronavirus HPHA
 
OHA Data Request
OHA Data RequestOHA Data Request
OHA Data Request
 
Letter from Palau to Guam
Letter from Palau to GuamLetter from Palau to Guam
Letter from Palau to Guam
 
Guam Governor's Letter to Pence
Guam Governor's Letter to Pence Guam Governor's Letter to Pence
Guam Governor's Letter to Pence
 
OHA Analysis by Akina
OHA Analysis by AkinaOHA Analysis by Akina
OHA Analysis by Akina
 
Case COFA Letter
Case COFA LetterCase COFA Letter
Case COFA Letter
 
List Of Pro Bono Legal Service Providers
List Of Pro Bono Legal Service ProvidersList Of Pro Bono Legal Service Providers
List Of Pro Bono Legal Service Providers
 
Arbitration Hearing Transcript December 2018
Arbitration Hearing Transcript December 2018Arbitration Hearing Transcript December 2018
Arbitration Hearing Transcript December 2018
 
Caldwell Press Release
Caldwell Press ReleaseCaldwell Press Release
Caldwell Press Release
 

Home Value State Rankings

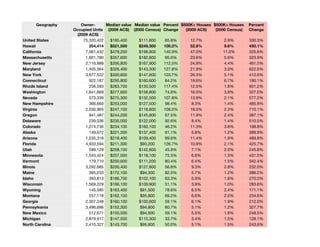
  • 1. Geography Owner- Median value Median value Percent $500K+ Houses $500K+ Houses Percent Occupied Units (2009 ACS) (2000 Census) Change (2009 ACS) (2000 Census) Change (2009 ACS) United States 75,320,422 $185,400 $111,800 65.8% 12.7% 2.9% 330.3% Hawaii 254,414 $521,500 $249,300 109.2% 52.6% 9.6% 450.1% California 7,061,432 $479,200 $198,900 140.9% 47.0% 11.0% 325.6% Massachusetts 1,601,780 $357,600 $182,800 95.6% 23.6% 5.6% 323.9% New Jersey 2,116,888 $356,800 $167,900 112.5% 24.9% 4.4% 461.5% Maryland 1,455,564 $326,400 $143,300 127.8% 21.9% 3.0% 622.6% New York 3,977,522 $300,600 $147,600 103.7% 26.3% 5.1% 412.6% Connecticut 922,187 $295,800 $160,600 84.2% 19.6% 6.7% 190.1% Rhode Island 256,593 $283,700 $130,500 117.4% 12.5% 1.8% 601.2% Washington 1,641,669 $277,600 $158,800 74.8% 16.5% 3.9% 327.0% Nevada 573,339 $275,300 $132,500 107.8% 13.9% 2.1% 577.2% New Hampshire 366,660 $253,000 $127,500 98.4% 8.3% 1.4% 485.8% Virginia 2,030,965 $247,100 $118,800 108.0% 18.5% 2.3% 710.1% Oregon 941,487 $244,200 $145,800 67.5% 11.9% 2.4% 387.1% Delaware 239,036 $235,000 $122,000 92.6% 8.4% 1.4% 510.5% Colorado 1,274,736 $234,100 $160,100 46.2% 11.3% 3.8% 198.8% Alaska 149,672 $221,300 $137,400 61.1% 5.8% 1.2% 389.9% Arizona 1,535,318 $218,400 $109,400 99.6% 11.4% 1.9% 489.8% Florida 4,933,594 $211,300 $93,200 126.7% 10.9% 2.1% 425.7% Utah 599,129 $208,100 $142,600 45.9% 7.1% 2.0% 245.8% Minnesota 1,543,424 $207,000 $118,100 75.3% 6.8% 1.3% 431.5% Vermont 179,710 $200,600 $111,200 80.4% 6.4% 1.5% 342.4% Illinois 3,292,685 $200,400 $127,800 56.8% 9.3% 2.8% 232.0% Maine 395,233 $172,100 $94,300 82.5% 5.7% 1.2% 386.2% Idaho 393,813 $166,700 $102,100 63.3% 5.9% 1.6% 270.0% Wisconsin 1,569,229 $166,100 $109,900 51.1% 3.9% 1.0% 283.6% Wyoming 145,585 $163,400 $91,500 78.6% 6.5% 2.4% 171.1% Montana 257,118 $162,100 $95,800 69.2% 6.6% 2.0% 234.6% Georgia 2,307,248 $160,100 $100,600 59.1% 6.1% 1.9% 212.0% Pennsylvania 3,496,696 $152,300 $94,800 60.7% 5.1% 1.2% 327.7% New Mexico 512,671 $150,500 $94,600 59.1% 5.5% 1.6% 248.5% Michigan 2,879,917 $147,500 $110,300 33.7% 3.4% 1.5% 128.1% North Carolina 2,410,327 $143,700 $95,800 50.0% 5.1% 1.5% 243.6%
  • 2. Geography Owner- Median value Median value Percent $500K+ Houses $500K+ Houses Percent Occupied Units (2009 ACS) (2000 Census) Change (2009 ACS) (2000 Census) Change (2009 ACS) Missouri 1,633,039 $134,500 $86,900 54.8% 3.2% 1.2% 162.0% Ohio 3,145,085 $134,500 $100,500 33.8% 2.3% 1.0% 128.1% Tennessee 1,682,052 $128,500 $88,300 45.5% 3.6% 1.3% 187.7% South Carolina 1,190,603 $128,400 $83,100 54.5% 5.2% 1.5% 252.5% Louisiana 1,120,844 $121,300 $77,500 56.5% 2.6% 0.9% 192.6% Indiana 1,764,450 $120,200 $92,500 29.9% 2.1% 0.9% 144.5% Nebraska 476,856 $119,700 $86,900 37.7% 1.7% 0.7% 138.3% Texas 5,350,206 $118,900 $77,800 52.8% 3.3% 1.3% 153.4% Kansas 760,084 $118,500 $81,000 46.3% 2.2% 0.7% 191.3% Iowa 886,444 $115,800 $82,100 41.0% 1.7% 0.6% 173.6% South Dakota 215,715 $115,400 $74,300 55.3% 2.3% 0.7% 222.9% Kentucky 1,175,984 $113,100 $79,600 42.1% 2.3% 0.8% 192.2% Alabama 1,287,432 $111,900 $76,700 45.9% 3.1% 1.1% 192.7% North Dakota 179,318 $104,300 $68,300 52.7% 1.2% 0.3% 265.1% Oklahoma 954,234 $98,800 $67,700 45.9% 1.7% 0.6% 182.8% Arkansas 749,491 $97,200 $67,400 44.2% 2.1% 0.7% 202.6% Mississippi 765,487 $91,400 $64,700 41.3% 1.7% 0.7% 159.3% West Virginia 554,391 $91,400 $66,000 38.5% 1.7% 0.5% 267.5%