SlideShare une entreprise Scribd logo
1  sur  2
Télécharger pour lire hors ligne
Geography     Cash-paying      Median       Median      Percent  $1000+ $1000+ (2000   Percent
                  Renter-Occupied contract rent contract rent Change (2009 ACS) Census       Change
                  Units (2009 ACS) (2009 ACS) (2000 Census)
United States            35,101,833   $675          $519       30.1%   22.4%     8.3%        168.1%
Hawaii                      167,904  $1,106         $721       53.4%   56.4%     22.0%       156.2%
California                4,949,360  $1,002         $677       48.0%   50.2%     19.5%       157.6%
New Jersey                  999,842   $922          $672       37.2%   40.0%     11.9%       236.9%
Maryland                    608,872   $896          $611       46.6%   39.2%     9.6%        308.3%
Alaska                       74,825   $857          $664       29.1%   32.2%     12.7%       153.7%
Massachusetts               831,932   $849          $605       40.3%   37.1%     14.6%       155.3%
Nevada                      358,766   $843          $630       33.8%   31.4%     7.0%        351.2%
New York                  3,042,953   $822          $605       35.9%   35.8%     13.7%       160.8%
New Hampshire               129,130   $810          $566       43.1%   25.7%     5.3%        387.2%
Connecticut                 387,435   $793          $588       34.9%   27.0%     9.4%        187.8%
Florida                   2,034,905   $784          $551       42.3%   26.1%     6.8%        282.0%
Virginia                    848,929   $777          $550       41.3%   33.1%     11.0%       200.7%
Delaware                     81,026   $755          $554       36.3%   17.8%     4.8%        267.8%
Washington                  833,977   $746          $593       25.8%   23.9%     9.3%        156.5%
Rhode Island                142,887   $731          $477       53.2%   17.7%     4.1%        329.5%
Colorado                    569,225   $721          $611       18.0%   22.1%     11.6%        90.7%
Arizona                     674,508   $709          $538       31.8%   19.8%     6.0%        229.7%
Illinois                  1,390,524   $684          $525       30.3%   18.4%     7.9%        133.5%
Minnesota                   492,398   $672          $521       29.0%   16.7%     5.5%        204.3%
Oregon                      499,065   $670          $549       22.0%   13.8%     5.6%        146.2%
Vermont                      65,411   $664          $479       38.6%   14.2%     3.1%        355.2%
Utah                        220,132   $656          $534       22.8%   14.5%     5.6%        160.3%
Georgia                   1,038,196   $622          $505       23.2%   11.3%     4.9%        131.7%
Texas                     2,734,343   $605          $490       23.5%   10.9%     4.6%        135.8%
Maine                       135,487   $589          $432       36.3%    9.3%     1.7%        433.7%
Wisconsin                   645,477   $584          $473       23.5%    7.1%     2.5%        185.1%
Michigan                    924,264   $582          $468       24.4%    8.0%     3.6%        122.2%
Idaho                       146,087   $567          $443       28.0%    6.4%     2.3%        175.8%
Pennsylvania              1,306,211   $566          $438       29.2%   11.2%     4.0%        184.0%
New Mexico                  203,176   $547          $432       26.6%    8.6%     3.3%        159.3%
North Carolina            1,035,654   $541          $431       25.5%    6.9%     2.9%        140.4%
Indiana                     659,830   $529          $432       22.5%    4.8%     1.9%        148.2%
Geography     Cash-paying      Median       Median      Percent  $1000+ $1000+ (2000   Percent
                  Renter-Occupied contract rent contract rent Change (2009 ACS) Census       Change
                  Units (2009 ACS) (2009 ACS) (2000 Census)
Wyoming                      55,275   $525          $373       40.8%    7.8%     1.9%        314.4%
Ohio                      1,303,550   $519          $423       22.7%    4.8%     2.3%        110.2%
South Carolina              446,513   $516          $397       30.0%    7.2%     2.5%        190.5%
Tennessee                   665,771   $511          $408       25.2%    5.5%     2.2%        151.1%
Nebraska                    208,643   $503          $412       22.1%    6.2%     2.4%        154.3%
Louisiana                   456,589   $501          $365       37.3%    7.7%     1.8%        337.1%
Montana                     103,428   $500          $383       30.5%    5.9%     1.7%        237.3%
Missouri                    638,991   $494          $384       28.6%    5.1%     1.9%        163.4%
Kansas                      309,229   $491          $391       25.6%    6.5%     2.8%        131.2%
Iowa                        304,318   $474          $383       23.8%    4.6%     1.5%        195.7%
North Dakota                 84,562   $466          $363       28.4%    4.1%     1.4%        199.5%
Oklahoma                    406,557   $455          $363       25.3%    3.6%     1.5%        133.6%
Kentucky                    445,684   $452          $366       23.5%    3.3%     1.2%        183.9%
South Dakota                 88,203   $444          $359       23.7%    3.9%     1.3%        194.8%
Alabama                     465,136   $435          $339       28.3%    3.8%     1.3%        201.4%
Mississippi                 270,955   $430          $334       28.7%    3.2%     0.9%        270.2%
Arkansas                    319,681   $425          $339       25.4%    2.7%     1.1%        136.9%
West Virginia               161,761   $387          $311       24.4%    2.1%     0.7%        193.7%

Contenu connexe

Similaire à U.S. States Median Rent

States Sorted by High School Grad
States Sorted by High School GradStates Sorted by High School Grad
States Sorted by High School GradHonolulu Civil Beat
 
10-Year Changes — Housing Occupancy
10-Year Changes — Housing Occupancy10-Year Changes — Housing Occupancy
10-Year Changes — Housing OccupancyHonolulu Civil Beat
 
Caída Publicidad EEUU 2009
Caída Publicidad EEUU 2009Caída Publicidad EEUU 2009
Caída Publicidad EEUU 2009Juan Varela
 
Languages Spoken in the Home — 2009 Breakdown
Languages Spoken in the Home — 2009 BreakdownLanguages Spoken in the Home — 2009 Breakdown
Languages Spoken in the Home — 2009 BreakdownHonolulu Civil Beat
 
Rebgv stats package%2_c_october_2011_%282%29
Rebgv stats package%2_c_october_2011_%282%29Rebgv stats package%2_c_october_2011_%282%29
Rebgv stats package%2_c_october_2011_%282%29vancouverhomesteam
 
October 2011 REBGV Stats Mike Stewart
October 2011 REBGV Stats Mike StewartOctober 2011 REBGV Stats Mike Stewart
October 2011 REBGV Stats Mike StewartMike Stewart
 
Rebgv stats package%2_c_october_2011_%282%29
Rebgv stats package%2_c_october_2011_%282%29Rebgv stats package%2_c_october_2011_%282%29
Rebgv stats package%2_c_october_2011_%282%29vancouverhomesteam
 
Vancouver real estate stats package September 2011
Vancouver real estate stats package September 2011Vancouver real estate stats package September 2011
Vancouver real estate stats package September 2011Matt Collinge
 
REBGV Stats for Sept 2011 Mike Stewart
REBGV Stats for Sept 2011 Mike StewartREBGV Stats for Sept 2011 Mike Stewart
REBGV Stats for Sept 2011 Mike StewartMike Stewart
 
Vancouver real estate stats package, june 2011
Vancouver real estate stats package, june 2011Vancouver real estate stats package, june 2011
Vancouver real estate stats package, june 2011Matt Collinge
 
Vancouver real estate stats package, December 2011
Vancouver real estate stats package, December 2011Vancouver real estate stats package, December 2011
Vancouver real estate stats package, December 2011Matt Collinge
 

Similaire à U.S. States Median Rent (20)

Hawaii Towns Median Rent
Hawaii Towns Median RentHawaii Towns Median Rent
Hawaii Towns Median Rent
 
Turkish consulate
Turkish consulateTurkish consulate
Turkish consulate
 
Citizenship entry
Citizenship entryCitizenship entry
Citizenship entry
 
Travel Time State Rankings
Travel Time State RankingsTravel Time State Rankings
Travel Time State Rankings
 
States Sorted by High School Grad
States Sorted by High School GradStates Sorted by High School Grad
States Sorted by High School Grad
 
10-Year Changes — Housing Occupancy
10-Year Changes — Housing Occupancy10-Year Changes — Housing Occupancy
10-Year Changes — Housing Occupancy
 
State-by-State Comparison
State-by-State ComparisonState-by-State Comparison
State-by-State Comparison
 
Departure Time State Rankings
Departure Time State RankingsDeparture Time State Rankings
Departure Time State Rankings
 
Caída Publicidad EEUU 2009
Caída Publicidad EEUU 2009Caída Publicidad EEUU 2009
Caída Publicidad EEUU 2009
 
Languages Spoken in the Home — 2009 Breakdown
Languages Spoken in the Home — 2009 BreakdownLanguages Spoken in the Home — 2009 Breakdown
Languages Spoken in the Home — 2009 Breakdown
 
Rebgv stats package%2_c_october_2011_%282%29
Rebgv stats package%2_c_october_2011_%282%29Rebgv stats package%2_c_october_2011_%282%29
Rebgv stats package%2_c_october_2011_%282%29
 
Stats Oct 11
Stats Oct 11Stats Oct 11
Stats Oct 11
 
October 2011 REBGV Stats Mike Stewart
October 2011 REBGV Stats Mike StewartOctober 2011 REBGV Stats Mike Stewart
October 2011 REBGV Stats Mike Stewart
 
Rebgv stats package%2_c_october_2011_%282%29
Rebgv stats package%2_c_october_2011_%282%29Rebgv stats package%2_c_october_2011_%282%29
Rebgv stats package%2_c_october_2011_%282%29
 
Vancouver real estate stats package September 2011
Vancouver real estate stats package September 2011Vancouver real estate stats package September 2011
Vancouver real estate stats package September 2011
 
September 2011 REBGV
September 2011 REBGV September 2011 REBGV
September 2011 REBGV
 
REBGV Stats for Sept 2011 Mike Stewart
REBGV Stats for Sept 2011 Mike StewartREBGV Stats for Sept 2011 Mike Stewart
REBGV Stats for Sept 2011 Mike Stewart
 
State Rankings 2009
State Rankings 2009State Rankings 2009
State Rankings 2009
 
Vancouver real estate stats package, june 2011
Vancouver real estate stats package, june 2011Vancouver real estate stats package, june 2011
Vancouver real estate stats package, june 2011
 
Vancouver real estate stats package, December 2011
Vancouver real estate stats package, December 2011Vancouver real estate stats package, December 2011
Vancouver real estate stats package, December 2011
 

Plus de Honolulu Civil Beat

Gov. David Ige response to U.S. Rep. Anna Eshoo
Gov. David Ige response to U.S. Rep. Anna EshooGov. David Ige response to U.S. Rep. Anna Eshoo
Gov. David Ige response to U.S. Rep. Anna EshooHonolulu Civil Beat
 
Audit of the Department of the Honolulu Prosecuting Attorney’s Policies, Proc...
Audit of the Department of the Honolulu Prosecuting Attorney’s Policies, Proc...Audit of the Department of the Honolulu Prosecuting Attorney’s Policies, Proc...
Audit of the Department of the Honolulu Prosecuting Attorney’s Policies, Proc...Honolulu Civil Beat
 
Audit of the Honolulu Police Department’s Policies, Procedures, and Controls
Audit of the Honolulu Police Department’s Policies, Procedures, and ControlsAudit of the Honolulu Police Department’s Policies, Procedures, and Controls
Audit of the Honolulu Police Department’s Policies, Procedures, and ControlsHonolulu Civil Beat
 
2019 Use of Force Annual Report HPD
2019 Use of Force Annual Report HPD 2019 Use of Force Annual Report HPD
2019 Use of Force Annual Report HPD Honolulu Civil Beat
 
Office of Health Equity Goals Draft 10
Office of Health Equity Goals Draft 10Office of Health Equity Goals Draft 10
Office of Health Equity Goals Draft 10Honolulu Civil Beat
 
ACLU Letter to HPD regarding racial profiling
ACLU Letter to HPD regarding racial profilingACLU Letter to HPD regarding racial profiling
ACLU Letter to HPD regarding racial profilingHonolulu Civil Beat
 
ACLU Letter to HPD regarding racial profiling
ACLU Letter to HPD regarding racial profilingACLU Letter to HPD regarding racial profiling
ACLU Letter to HPD regarding racial profilingHonolulu Civil Beat
 
Guam Governor's Letter to Pence
Guam Governor's Letter to Pence Guam Governor's Letter to Pence
Guam Governor's Letter to Pence Honolulu Civil Beat
 
List Of Pro Bono Legal Service Providers
List Of Pro Bono Legal Service ProvidersList Of Pro Bono Legal Service Providers
List Of Pro Bono Legal Service ProvidersHonolulu Civil Beat
 
Arbitration Hearing Transcript December 2018
Arbitration Hearing Transcript December 2018Arbitration Hearing Transcript December 2018
Arbitration Hearing Transcript December 2018Honolulu Civil Beat
 

Plus de Honolulu Civil Beat (20)

Gov. David Ige response to U.S. Rep. Anna Eshoo
Gov. David Ige response to U.S. Rep. Anna EshooGov. David Ige response to U.S. Rep. Anna Eshoo
Gov. David Ige response to U.S. Rep. Anna Eshoo
 
Audit of the Department of the Honolulu Prosecuting Attorney’s Policies, Proc...
Audit of the Department of the Honolulu Prosecuting Attorney’s Policies, Proc...Audit of the Department of the Honolulu Prosecuting Attorney’s Policies, Proc...
Audit of the Department of the Honolulu Prosecuting Attorney’s Policies, Proc...
 
Audit of the Honolulu Police Department’s Policies, Procedures, and Controls
Audit of the Honolulu Police Department’s Policies, Procedures, and ControlsAudit of the Honolulu Police Department’s Policies, Procedures, and Controls
Audit of the Honolulu Police Department’s Policies, Procedures, and Controls
 
2019 Use of Force Annual Report HPD
2019 Use of Force Annual Report HPD 2019 Use of Force Annual Report HPD
2019 Use of Force Annual Report HPD
 
Office of Health Equity Goals Draft 10
Office of Health Equity Goals Draft 10Office of Health Equity Goals Draft 10
Office of Health Equity Goals Draft 10
 
NHPI COVID-19 Statement
NHPI COVID-19 StatementNHPI COVID-19 Statement
NHPI COVID-19 Statement
 
DLIR Response Language Access
DLIR Response Language AccessDLIR Response Language Access
DLIR Response Language Access
 
Language Access Letter To DLIR
Language Access Letter To DLIRLanguage Access Letter To DLIR
Language Access Letter To DLIR
 
ACLU Letter to HPD regarding racial profiling
ACLU Letter to HPD regarding racial profilingACLU Letter to HPD regarding racial profiling
ACLU Letter to HPD regarding racial profiling
 
ACLU Letter to HPD regarding racial profiling
ACLU Letter to HPD regarding racial profilingACLU Letter to HPD regarding racial profiling
ACLU Letter to HPD regarding racial profiling
 
Jane Doe v. Rehab Hospital
Jane Doe v. Rehab HospitalJane Doe v. Rehab Hospital
Jane Doe v. Rehab Hospital
 
Coronavirus HPHA
Coronavirus HPHA Coronavirus HPHA
Coronavirus HPHA
 
OHA Data Request
OHA Data RequestOHA Data Request
OHA Data Request
 
Letter from Palau to Guam
Letter from Palau to GuamLetter from Palau to Guam
Letter from Palau to Guam
 
Guam Governor's Letter to Pence
Guam Governor's Letter to Pence Guam Governor's Letter to Pence
Guam Governor's Letter to Pence
 
OHA Analysis by Akina
OHA Analysis by AkinaOHA Analysis by Akina
OHA Analysis by Akina
 
Case COFA Letter
Case COFA LetterCase COFA Letter
Case COFA Letter
 
List Of Pro Bono Legal Service Providers
List Of Pro Bono Legal Service ProvidersList Of Pro Bono Legal Service Providers
List Of Pro Bono Legal Service Providers
 
Arbitration Hearing Transcript December 2018
Arbitration Hearing Transcript December 2018Arbitration Hearing Transcript December 2018
Arbitration Hearing Transcript December 2018
 
Caldwell Press Release
Caldwell Press ReleaseCaldwell Press Release
Caldwell Press Release
 

U.S. States Median Rent

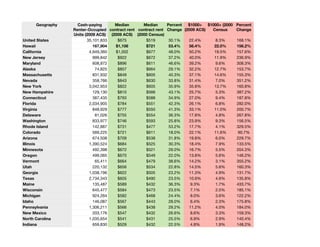
  • 1. Geography Cash-paying Median Median Percent $1000+ $1000+ (2000 Percent Renter-Occupied contract rent contract rent Change (2009 ACS) Census Change Units (2009 ACS) (2009 ACS) (2000 Census) United States 35,101,833 $675 $519 30.1% 22.4% 8.3% 168.1% Hawaii 167,904 $1,106 $721 53.4% 56.4% 22.0% 156.2% California 4,949,360 $1,002 $677 48.0% 50.2% 19.5% 157.6% New Jersey 999,842 $922 $672 37.2% 40.0% 11.9% 236.9% Maryland 608,872 $896 $611 46.6% 39.2% 9.6% 308.3% Alaska 74,825 $857 $664 29.1% 32.2% 12.7% 153.7% Massachusetts 831,932 $849 $605 40.3% 37.1% 14.6% 155.3% Nevada 358,766 $843 $630 33.8% 31.4% 7.0% 351.2% New York 3,042,953 $822 $605 35.9% 35.8% 13.7% 160.8% New Hampshire 129,130 $810 $566 43.1% 25.7% 5.3% 387.2% Connecticut 387,435 $793 $588 34.9% 27.0% 9.4% 187.8% Florida 2,034,905 $784 $551 42.3% 26.1% 6.8% 282.0% Virginia 848,929 $777 $550 41.3% 33.1% 11.0% 200.7% Delaware 81,026 $755 $554 36.3% 17.8% 4.8% 267.8% Washington 833,977 $746 $593 25.8% 23.9% 9.3% 156.5% Rhode Island 142,887 $731 $477 53.2% 17.7% 4.1% 329.5% Colorado 569,225 $721 $611 18.0% 22.1% 11.6% 90.7% Arizona 674,508 $709 $538 31.8% 19.8% 6.0% 229.7% Illinois 1,390,524 $684 $525 30.3% 18.4% 7.9% 133.5% Minnesota 492,398 $672 $521 29.0% 16.7% 5.5% 204.3% Oregon 499,065 $670 $549 22.0% 13.8% 5.6% 146.2% Vermont 65,411 $664 $479 38.6% 14.2% 3.1% 355.2% Utah 220,132 $656 $534 22.8% 14.5% 5.6% 160.3% Georgia 1,038,196 $622 $505 23.2% 11.3% 4.9% 131.7% Texas 2,734,343 $605 $490 23.5% 10.9% 4.6% 135.8% Maine 135,487 $589 $432 36.3% 9.3% 1.7% 433.7% Wisconsin 645,477 $584 $473 23.5% 7.1% 2.5% 185.1% Michigan 924,264 $582 $468 24.4% 8.0% 3.6% 122.2% Idaho 146,087 $567 $443 28.0% 6.4% 2.3% 175.8% Pennsylvania 1,306,211 $566 $438 29.2% 11.2% 4.0% 184.0% New Mexico 203,176 $547 $432 26.6% 8.6% 3.3% 159.3% North Carolina 1,035,654 $541 $431 25.5% 6.9% 2.9% 140.4% Indiana 659,830 $529 $432 22.5% 4.8% 1.9% 148.2%
  • 2. Geography Cash-paying Median Median Percent $1000+ $1000+ (2000 Percent Renter-Occupied contract rent contract rent Change (2009 ACS) Census Change Units (2009 ACS) (2009 ACS) (2000 Census) Wyoming 55,275 $525 $373 40.8% 7.8% 1.9% 314.4% Ohio 1,303,550 $519 $423 22.7% 4.8% 2.3% 110.2% South Carolina 446,513 $516 $397 30.0% 7.2% 2.5% 190.5% Tennessee 665,771 $511 $408 25.2% 5.5% 2.2% 151.1% Nebraska 208,643 $503 $412 22.1% 6.2% 2.4% 154.3% Louisiana 456,589 $501 $365 37.3% 7.7% 1.8% 337.1% Montana 103,428 $500 $383 30.5% 5.9% 1.7% 237.3% Missouri 638,991 $494 $384 28.6% 5.1% 1.9% 163.4% Kansas 309,229 $491 $391 25.6% 6.5% 2.8% 131.2% Iowa 304,318 $474 $383 23.8% 4.6% 1.5% 195.7% North Dakota 84,562 $466 $363 28.4% 4.1% 1.4% 199.5% Oklahoma 406,557 $455 $363 25.3% 3.6% 1.5% 133.6% Kentucky 445,684 $452 $366 23.5% 3.3% 1.2% 183.9% South Dakota 88,203 $444 $359 23.7% 3.9% 1.3% 194.8% Alabama 465,136 $435 $339 28.3% 3.8% 1.3% 201.4% Mississippi 270,955 $430 $334 28.7% 3.2% 0.9% 270.2% Arkansas 319,681 $425 $339 25.4% 2.7% 1.1% 136.9% West Virginia 161,761 $387 $311 24.4% 2.1% 0.7% 193.7%