OTC Clearing Trade Repository
•
0 j'aime•646 vues

Analysis of trade activity data prior to and post the March 11th Dodd-Frank Act mandatory clearing deadline.

Recommandé
Contenu connexe
En vedette
En vedette (15)
Plus de Clarus Financial Technology
Dernier
Dernier (20)
OTC Clearing Trade Repository
- 1. OTC Central Clearing: One Month In, What does the Data Show? By Amir Khwaja Amir Khwaja, CEO of Clarus Financial Technology, analyses trade activity data prior to and post the March 11th Dodd-Frank Act mandatory clearing deadline. Introduction Now that we have almost one months of trading post March 11th, we have sufficient data to perform a meaningful analysis of trading activity and look for any changes, either expected or un-expected. Our Data Source A good analysis usually starts with a source of independent data and we now have this for OTC Derivatives with the DTCC Derivatives Data Repository (DDR). The analogy that springs to mind is the residential housing market in the UK, where anyone can login in to a website and see the actual prices paid for houses on any street in the last 10 years. Contrast this with the preceding situation, when one had to rely solely on estate agents, brokers, word-of-mouth and gossip. The OTC Derivatives market is currently in the process of a similar opening up. From January 3, 2013, DTCC has made publically available the derivatives trading activity data, which is required to be reported by US financial firms under the Dodd-Frank Act. Choosing our Periods Using the Clarus DDR View we selected the following three periods to compare trading activity. 18-31 Jan 2013, as the first 10-day month-end period in the data. 15-28 Feb 2013, as the last 10-day month-end period prior to Mar 11th. 15-28 Mar 2013, as the first 10-day month-end period after Mar 11th. Comparing the cumulative volume over 10-day periods isolates us from the fluctuations observed in daily data, some of which is statistically low volume. US Dollars Products Lets look first at USD Dollars as the highest volume currency and the four Interest Rate products where clearing is mandatory; Fixed-Float Swaps, Overnight Index Swaps (OIS), Basis Swaps and Forward Rate Agreements (FRA). A picture being worth a hundred words and a hundred times quicker to understand, we will use charts followed by a few observations.
- 2. $300 USD Swaps 73% $250 61% 55% $200 Billions Cleared $150 Bi-lateral $100 $50 $0 18-31 Jan 15-28 Feb 15-28 Mar The Cleared trade percentage in gross notional terms has increased steadily in each of our 10-day periods from 55% to 61% to 73%. The increase in Cleared has come from a decrease in Bi-lateral trades. The total volume of vanilla fixed v float swaps has remained the same. There is still $100 billion over 10 days or $10 billion a day of Bi-lateral Swaps being traded by firms required to report to DDR, which are not currently required to clear or for firms with end-user exemptions. $20 56% USD OIS $18 52% 62% $16 $14 $12 Billions Cleared $10 Bi-lateral $8 $6 $4 $2 $0 18-31 Jan 15-28 Feb 15-28 Mar Percentage of Cleared trades has increased from 56% to 62%. This is a result of the Bi-lateral trade volumes dropping from $15 billion to $11billion, while Cleared trades volumes have remained at $19billion. Consequently total volumes for OIS Swaps are lower. There is still over $1 billion of Bi-lateral OIS Swaps being traded daily.
- 3. $30 USD Basis Swaps $25 51% $20 35% Billions Cleared $15 28% Bi-lateral $10 $5 $0 18-31 Jan 15-28 Feb 15-28 Mar Percentage of Cleared trades has increased from 35% to 51%, which while a big increase, shows there is some way to go for this product. Cleared has increased and Bi-lateral decreased by similar amounts, so the total volume is un-changed. There is still over $2 billion of Bi-lateral Basis Swaps being traded daily. $450 USD FRA $400 78% 76% $350 $300 92% Billions $250 Cleared $200 Bi-lateral $150 $100 $50 $0 18-31 Jan 15-28 Feb 15-28 Mar Percentage of Cleared trades has increased from 78% to 92%, which is the highest percentage of any of the mandatory cleared products. Bi-lateral volumes have decreased from $121 billion to $27 billion a huge drop in this product. Cleared volumes have also dropped from $421 billion to $318 billion. So each category has dropped $100 billion or $10 billion a day. This is either a March quarter year-end effect or FRA trades are being booked outside US entity reporting requirements or the FRA product is seeing a significant fall-off in trading interest, presumably in favor of Eurodollar Futures.
- 4. Are EUR, JPY, GBP any different? Lets now look at whether the other three major currencies show similar trends. In the interests of brevity, we will look only at a few key charts. € 140 EUR Swaps € 120 68% € 100 82% 73% Cleared Billions € 80 Bi-lateral € 60 % Cleared € 40 € 20 €0 18-31 Jan 15-28 Feb 15-28 Mar Percentage of Cleared has increased from 68% to 82%, similar to USD. The total volume had fluctuated down then up over our periods. Bi-lateral trades show a bigger reduction (60%) then Cleared. These effects may be due to US firms trading less EUR Swaps or the ongoing European Sovereign Crises with Cyprus being the latest. There is still over €2 billion a day of Bi-lateral Swaps reported. ¥7,000 JPY Swaps ¥6,000 80% 84% ¥5,000 Cleared Billions ¥4,000 76% Bi-lateral ¥3,000 % Cleared ¥2,000 ¥1,000 ¥0 18-31 Jan 15-28 Feb 15-28 Mar Percentage of Cleared has not changed significantly. The total volume has fluctuated down in each period. Cleared trades show a bigger reduction then Bi-lateral. These effects may be due to March quarter year-end effects, which are particularly important in Japan.
- 5. € 40 EUR OIS 77% € 35 € 30 53% € 25 51% Billions Cleared € 20 Bi-lateral € 15 € 10 €5 €0 18-31 Jan 15-28 Feb 15-28 Mar Percentage of Cleared trades has increased from 53% to 77%. Bi-lateral trades have dropped from €24b to €11b. Cleared trades have increased from €27b to €38b. So overall volumes have remained the same There is still over €1 billion of Bi-lateral OIS Swaps being traded daily. £80 96% GBP FRA £70 97% £60 £50 Billions Cleared £40 Bi-lateral £30 98% £20 £10 £0 18-31 Jan 15-28 Feb 15-28 Mar Percentage of Cleared trades has remained unchanged at 98% Cleared volumes have dropped a huge amount from £79b to £26b, which echoes the USD trend (and the EUR FRA one). Cleared volumes have also dropped from £3.5b to £0.6b. This is either a March quarter year-end effect or FRA trades are being booked outside US entity reporting requirements or the FRA product is seeing a significant fall-off in trading interest, presumably in favor of Eurodollar Futures.
- 6. Other Currencies The analysis for these is best left to another article and possibly even until the European Derivatives Repository is up and running. However returning to our earlier maxim that a picture is worth a hundred words, I will only include an illustrative screen-shot from our DDR View and a few observations. Un-like the major currencies, none of these currencies show any real increase in the trade count or gross notional of Cleared Swaps. Not surprising, as these are not yet mandatory for clearing under DFA. The cleared percentage remains low, significantly less than 50%. The total number of trades and volumes are low, probably because we need the European and regional derivative repositories to be reporting before we perform any meaningful analysis of these. A final observation, currencies such as BRL, KRW, MXN & THB have significant numbers of trades and gross notional in bi-lateral swaps. Surely some CCP needs to start offering clearing for these and a regulator mandating clearing. What, you need more time? It only remains to ask, “where do we go from here?” In answer to which, we can only say we need to wait and see what happens as the Dodd-Frank Act and EMIR timeline advances and more deadlines are passed. The next few interesting ones for the US are mid-April, when more legal entities are required to report their trades to the DTCC, followed by June and September when more legal entities are required to clear eligible derivatives. For Europe, July and September for reporting of Interest Rates and Credit Derivatives, January 2014 for other asset classes and sometime in early 2014 for mandatory clearing.
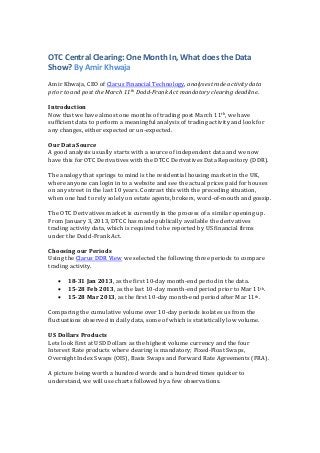
- 7. What, you also need more data? The need to get more data to improve our analysis is particularly important as the largest chunk of the Swap market is traded in London. One only has to look at LCH SwapClear volumes to get a sense of how much global trading activity is not in the DDR data files. On Apr 4, 2013, comparing SwapClear daily cleared product volumes with those from DDR View , we can see the following. $300 SwapClear & DDR $250 $200 Billions SwapClear $150 DDR $100 23% 35% $50 4% 6% $0 USD IRS USD OIS USD Basis USD FRA So 23% or about a quarter of global USD Cleared Swaps are traded by US legal entities required to report to DDR. This sounds reasonable as the US market is generally thought to represent 30-35% of the Swap market, with Europe around 50-55%. Percentages for USD OIS and Basis swaps are surprisingly low. Percentages for EUR, GBP & JPY products are much lower (<5%), which is, as we would expect given the home markets are Europe or Japan. Summary In summary we can say that one month after the first mandatory clearing date, we can see both expected and un-expected changes. So Cleared trades are up as a percentage of total volume, with the major currencies and most products showing a drop in bi-lateral volumes directly reflected in an increase in cleared volumes. The FRA product in each major currency has suffered a significant drop in trade volumes (both cleared and bi-lateral) and it may be this is a year-end effect or that trade booking has moved outside the US or trading has migrated
- 8. to the Euro Dollar Futures market (for which we need to look for evidence in Exchanges contract volumes). JPY Swaps volumes have dropped significantly, which we assume is a year-end effect, so need to wait for the April figures. Currencies other than USD, EUR, JPY, GBP show no change in percentage of Cleared trades; not surprising when you consider that these are not currently mandatory for clearing under DFA. There is significant bi-lateral activity and no clearing in the Latin American currencies BRL and MXN, as well as the Asian currencies KRW and THB. As further deadlines come and go, particularly the European reporting requirements in 3Q 2013, we need to re-analyse the data to see which trends continue and which do not, which are global and which US specific and which of our observations hold and which do not. After all as we all know, but find hard to put into practice, it is only by continually challenging our beliefs in the light of new facts that we develop and increase our understanding of the world around us.