Triển vọng thị trường cà phê thế giới 2013
•
0 j'aime•428 vues

Báo cáo của Giám đốc điều hành ICO tại hội nghị ở London ngày 06/03/2013.
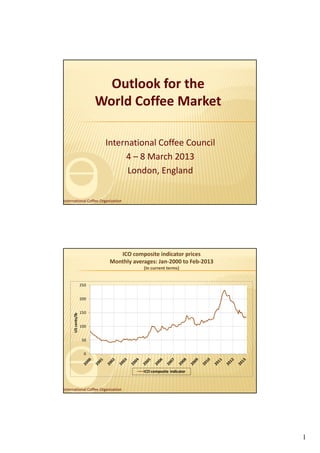
![ICO composite indicator prices
Monthly averages: Jan‐2000 to Feb‐2013
(In current and constant terms)
250
200
150
US cents/lb
100
50
0
ICO Composite ICO Composite [Deflated]
International Coffee Organization
ICO group indicator prices
Monthly averages: Jan‐2000 to Feb‐2013
(In current terms)
350
300
250
200
US cents/lb
150
100
50
0
Colombian Milds Other Milds Brazilian Naturals Robustas
International Coffee Organization
2](data:image/gif;base64,R0lGODlhAQABAIAAAAAAAP///yH5BAEAAAAALAAAAAABAAEAAAIBRAA7)
Recommandé
Contenu connexe
Dernier
Dernier (20)
En vedette
En vedette (20)
Triển vọng thị trường cà phê thế giới 2013
- 1. Outlook for the World Coffee Market International Coffee Council 4 – 8 March 2013 4 8 March 2013 London, England International Coffee Organization ICO composite indicator prices Monthly averages: Jan‐2000 to Feb‐2013 (In current terms) 250 200 150 US cents/lb 100 50 0 ICO composite indicator International Coffee Organization 1
- 2. ICO composite indicator prices Monthly averages: Jan‐2000 to Feb‐2013 (In current and constant terms) 250 200 150 US cents/lb 100 50 0 ICO Composite ICO Composite [Deflated] International Coffee Organization ICO group indicator prices Monthly averages: Jan‐2000 to Feb‐2013 (In current terms) 350 300 250 200 US cents/lb 150 100 50 0 Colombian Milds Other Milds Brazilian Naturals Robustas International Coffee Organization 2
- 3. Arbitrage: New York* ‐ London* Monthly averages: Jan‐2000 to Feb‐2013 (In current terms) 180 160 140 120 US cents/lb 100 80 60 40 20 0 *Average price for the 2nd and 3rd positions International Coffee Organization Exchange rate movements (Index: Jan‐2009=100) 110 100 90 80 70 60 March March March March March 2009 2010 2011 2012 2013 Brazil Colombia Indonesia International Coffee Organization 3
- 4. Costs of production (Index: 2004=100) 250 200 Colombia 150 Ecuador Guatemala Cuba 100 Brazil Costa Rica C t Ri 50 2004 2005 2006 2007 2008 2009 2010 2011 International Coffee Organization World production Crop years 2000/01 to 2012/13* 160 144.4 140 133.5 135.9 128.4 128 4 128.6 128 6 123.1 122.8 120 116.2 116.6 112.9 107.7 111.2 106.2 Million bags 100 80 60 40 20 2000/01 2002/03 2004/05 2006/07 2008/09 2010/11 2012/13* *Estimated International Coffee Organization 4
- 5. Production: 10 leading producers (In thousand bags) 2011/12 2012/13* % change Brazil 43 484 50 826 16.9% Vietnam 24 058 22 000 -8.6% Indonesia 8 620 11 250 30.5% Colombia 7 653 8 500 11.1% Ethiopia 6 798 8 100 19.1% India 5 233 5 258 0.5% Mexico 4 546 4 300 -5.4% Honduras 5 903 4 900 -17.0% Peru 5 581 4 750 -14.9% Guatemala 3 840 3 100 -19.3% *Estimated International Coffee Organization Volume and value of total exports Calendar years 2000 ‐ 2012 120 30 100 25 80 20 Million bags Billion US$ 60 15 40 10 20 5 0 0 2000 2001 2002 2003 2004 2005 2006 2007 2008 2009 2010 2011 2012 Volume Value International Coffee Organization 5
- 6. Total exports by type of coffee 50 40 Million bags 30 20 10 0 2008 2009 2010 2011 2012 Colombian Milds Other Milds Brazilian Naturals Robustas International Coffee Organization Stocks in exporting and importing countries 1990 to 2012 60 50 40 Million bags 30 20 10 1990 1992 1994 1996 1998 2000 2002 2004 2006 2008 2010 2012 Exporting countries Importing countries International Coffee Organization 6
- 7. Certified stocks on the New York and London exchanges March 2011 – February 2013 8 7 6 5 Million bags 4 3 2 1 March May Jul Sep Nov Jan March May Jul Sep Nov Jan 2011 2012 London New York International Coffee Organization World coffee consumption 2002 – 2012* (In million bags) Absolute Average annual 2002 2012* % change change growth rate growth rate WORLD TOTAL 111.2 142.2 27.9% 31.0 2.5% Exporting countries 28.4 43.4 52.7% 15.0 4.3% Traditional markets 65.1 72.9 12.1% 7.9 1.1% Emerging markets 17.7 25.8 46.0% 8.1 3.9% * Provisional International Coffee Organization 7
- 8. Retail prices: % change in Roast & Ground coffee (In national currencies) 2010 2011 2012 Austria 0.9% 18.7% 9.3% Belgium B l i 3.3% 3 3% 19.3% 19 3% 3.9% 3 9% Denmark 8.0% 21.6% 4.9% Finland 10.1% 38.6% ‐3.1% France 0.4% 8.9% 2.7% Germany 5.2% 2.3% 0.6% Italy 0.4% 10.7% 7.4% Japan ‐1.3% 4.5% 3.2% Norway 7.7% 19.7% ‐1.5% Poland P l d 1.3% 1 3% 12.1% 12 1% 10.5% 10 5% Portugal ‐1.7% 3.5% 13.4% Spain ‐1.2% 7.6% 9.5% Sweden 6.1% 26.4% ‐2.3% United Kingdom 2.3% 16.6% 4.6% USA 6.5% 32.9% 9.3% International Coffee Organization World consumption outlook (1970 to 2020) 180 173.6 166.1 160 158.9 140 2000‐2011 120 2.5% 1990‐1999 Million bags 100 1980‐1989 1.8% 1970‐1979 1.7% 1.3% 80 60 40 20 0 Actual Low ‐ 1.5% Medium ‐ 2.0% High ‐ 2.5% International Coffee Organization 8