Leveraging Anonymized Patient Level Data to Detect Hidden Market Potential
•
1 j'aime•1,180 vues

Longitudinal analysis of anonymized patient level data (APLD) is a powerful tool for assessing patient experience on a granular level that will lead to better treatment outcomes and increased life sciences market penetration.

Recommandé
Contenu connexe
Tendances
Tendances (20)
En vedette
En vedette (12)
Similaire à Leveraging Anonymized Patient Level Data to Detect Hidden Market Potential
Similaire à Leveraging Anonymized Patient Level Data to Detect Hidden Market Potential (20)
Plus de Cognizant
Plus de Cognizant (20)
Leveraging Anonymized Patient Level Data to Detect Hidden Market Potential
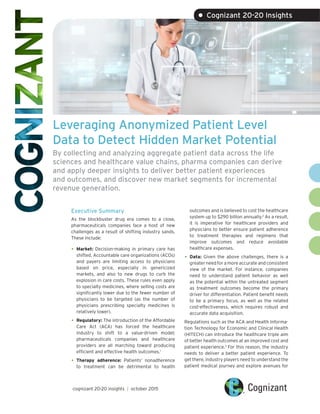
- 1. Leveraging Anonymized Patient Level Data to Detect Hidden Market Potential By collecting and analyzing aggregate patient data across the life sciences and healthcare value chains, pharma companies can derive and apply deeper insights to deliver better patient experiences and outcomes, and discover new market segments for incremental revenue generation. Executive Summary As the blockbuster drug era comes to a close, pharmaceuticals companies face a host of new challenges as a result of shifting industry sands. These include: • Market: Decision-making in primary care has shifted. Accountable care organizations (ACOs) and payers are limiting access to physicians based on price, especially in genericized markets, and also to new drugs to curb the explosion in care costs. These rules even apply to specialty medicines, where selling costs are significantly lower due to the fewer number of physicians to be targeted (as the number of physicians prescribing specialty medicines is relatively lower). • Regulatory: The introduction of the Affordable Care Act (ACA) has forced the healthcare industry to shift to a value-driven model; pharmaceuticals companies and healthcare providers are all marching toward producing efficient and effective health outcomes.1 • outcomes and is believed to cost the healthcare system up to $290 billion annually.2 As a result, it is imperative for healthcare providers and physicians to better ensure patient adherence to treatment therapies and regimens that improve outcomes and reduce avoidable healthcare expenses. • Data: Given the above challenges, there is a greater need for a more accurate and consistent view of the market. For instance, companies need to understand patient behavior as well as the potential within the untreated segment as treatment outcomes become the primary driver for differentiation. Patient benefit needs to be a primary focus, as well as the related cost-effectiveness, which requires robust and accurate data acquisition. Regulations such as the ACA and Health Informa- tion Technology for Economic and Clinical Health (HITECH) can introduce the healthcare triple aim of better health outcomes at an improved cost and patient experience.3 For this reason, the industry needs to deliver a better patient experience. To get there, industry players need to understand the patient medical journey and explore avenues for Therapy adherence: Patients’ nonadherence to treatment can be detrimental to health cognizant 20-20 insights | october 2015 • Cognizant 20-20 Insights
- 2. 2cognizant 20-20 insights enhancing how patients experience healthcare. This requires fact-based business decisions to be made using patient-derived insights across various phases of the pharma value chain (i.e., from drug discovery and prescription, through the treatment continuum). While traditional data sources provide informa- tion on physician activity, they do not allow the user to peer into the treatment regimens used for individual patients. Moreover, they offer only a limited ability to track patient behavior. Anonymized patient level data (APLD), on the other hand, provides insight not only into the patient journey but into patient behavior. This data also offers insights into physician prescribing behavior and the effectiveness of the treatment.4 Pharmaceuticals companies realize that their therapies work for a subsegment of people, but not all. Rather than target everybody with the same medicine, the approach is to identify the right target patient for the right therapy. This white paper lays out a strategy to help pharma companies analyze APLD data and enable business users to better understand customer segments and target their products to address the needs of those segments. Approach to Conducting Longitudinal Analysis A patient-centric approach is beneficial to all stakeholders in the life sciences and healthcare industries. We apply APLD in client engagements alongside traditional data sources to provide metrics that offer information at the patient level, which is more granular and thus yields more accurate insights into patient and physician behavior. This can then be used for strategic decisions that create greater value for physicians, patients and payers. Essentially, APLD is healthcare-utilization data that can be linked to individual patients, longitudi- nally. This is data that tracks a patient’s healthcare utilization over time. It provides patient informa- tion on their interactions with each physician and reveals those patients who were diagnosed with what diseases, and which medication was prescribed and used, etc. This data is captured through similar sources as standard prescription data. For example, patient-level data is collected from various components of the healthcare system (e.g., pharmacy, hospitals/clinics, payers and physicians) and compiled as a longitudinal database (see Figure 1). Patient Data Creation Based on Various Moments of Truth Across Patient Lifecycle Patient sees doctor. APLD Data Providers Patient hospitalized. Then visits the pharmacy… Where the RX gets validated based on insurance. Then the RX gets processed by the PBM… And enters the payer database. ■ IMS ■ Symphony Health Solutions ■ Truven Health Analytics ■ I3 Analytics Figure 1
- 3. cognizant 20-20 insights 3 Available through various data providers like IMS, SDI and SHS (again, see Figure 1), APLD data, along with internal data dictionaries, is accessible to industry players through a secured virtual private network. To maintain privacy and prevent data leakage, this database can be accessed through a remote server. This data pertains to a particular therapeutic area that is filtered for the disease of interest. The information extracted for population subsets can then be grouped into two broad categories: • Care pathway analysis: The treatments/ regimens patients have undergone. • Diagnosis Information: Diseases for which patients have been diagnosed. This information, when refined using defined business rules, can yield many useful metrics. The business rules are defined according to a deep understanding of the therapeutic area, disease and its treatments by subject matter experts (SMEs)/consultants. Some of the important APLD- derived metrics are depicted in Figure 2. Critical Success Factors Key advantages of APLD vs. traditional databases include: • Greater granularity: Links physicians and patients with the drugs, diagnoses and procedures used to measure the effectiveness of treatment, options for combination therapy, co-morbidities, drug effectiveness, etc. • Deeper insights: Helps identify patient and physician behavior. • More revealing: Has the ability to derive more insights about the market trends as it contains patient-level transactions on every treatment date (i.e., patient birth year, patient gender, associated physicians and their specialties, region, site of treatment, drugs used, insurance payer associated, etc.). Applying APLD Data Integrating APLD with other datasets and applying disease-specific business rules to generate KPIs from a 3P (physicians, patients and payers) perspective. Drug Identification APLD Claims Vendors Specialty Pharma Data EMR Data Promotional Data Calls Data Sales Data External Sources Remote Server Client Internal Systems Secure VPN Syndicated Therapeutic Area Patient Population Population Subset for a Particular Disease Diagnosis Information Therapy Identification (Surgery, Radiation, Chemo, Biological, Hormone, Alternative) Care Pathway Analysis Identify Patient Population by Physician Specialty and Line of Therapy Patient-Centric Metrics Brand-Centric Metrics Physician-Centric Metrics Payer-Centric Metrics • Claim Approval Rates • Claims Payer Mix • Co-pay Card Analysis • Sales-Based Deciding • New vs. Continuing • Zip Level Penetration • Physician Uptake • NRx vs. NBRx • New Patient Share • Source of Business • Utilization by Disease • Treatment Adherence • Mono Vs Combo • Avgerage Dose per kg • Percent of High dose HCO Affiliations Data $ Figure 2
- 4. Quick Take Situation: A leading global biotech company sought to measure the efficacy of its patient support program covering a particular therapy. The objective of the support program was to drive patient belief in one full year of treatment, awareness of support and financial resources, and awareness of opportunities to reinitiate paused treatment by sending periodic reminders to patients about their next visit to the clinic, next refill date, etc. Although program enroll- ment was voluntary, the company’s sales force encouraged doctors to enroll their patients. Solution: • Among the patients who opted into the support program, APLD identified patients with stable treatment history and minimum gaps in treatment. • Patient-level treatment parameters as in line of therapy, duration of therapy, dosage pattern, site of care, age, gender and payer were calculated by processing APLD data. • Enrolled patients were matched to non-enrolled patients on several parameters (primary tumor, line of therapy, age, gender, payer, site of care, etc.). • Enrolled and non-enrolled patients were compared to measure the program’s impact on duration of therapy, compliance and number of drug infusions. Analysis Outcomes: Analysis clearly demonstrated that patients who had enrolled in the program had significantly longer duration and received one to two additional brand infusions, on average, than patients not in the program. Importantly, these patients were more adherent toward treatment. Analysis also identified areas for improvement in subsequent campaigns — reduced cost per lead, improved qualification rates and further drive persistence. Measuring Efficacy of Patient Care Programs 4cognizant 20-20 insights Campaign Results Flowchart for identifying analysis universe of qualified patients Duration of therapy for groups of patients 25.6 21.722.1 19.119.3 16.4 Total Duration Compliant Duration ■ Non-CARES ■ Proactive ■ Enrolled ▲ Non-CARES Proactive (n = 9) Enrolled (n = 27) 0% 20% 40% 60% 80% 100% 1 2 3 4 5 6 7 8 9 10 11 12 >12 ProportionReceivingInfusion Number of Brand Infusions Proportion of patients receiving a number of brand infusions X X = = Average Cost per Lead (CPL) = $2,538 ROI estimation approach Total CARE Program Enrollees Enrollees with valid patient IDs Valid patients with stable claims* Not Brand-A Patients Brand-A Patients with no Brand-A claims post CARES enrollment Qualified Enrollees Percentage of Enrollees that Are Qualified * Number of CARES Enrollees Total Impact = $4.2M Total Cost = $3.5M *** Incremental Net Rev per CARES Qualified ** 358 106 4 2,301 1,948 468 2,301 $4,925 ROI ≈ 1.2:1 A 85% 62% 24% 76% 23% 1% * Source: Estimate based on the percentage of patients receiving Brand-A after enrolling in CARES. (52% yields 1:1 ROI). ** Source: Duration analysis using CARES vs. non-CARES patients based on claims data. *** Source: All CARES costs from the Patient Marketing Team. Figure 3
- 5. cognizant 20-20 insights 5 Looking Forward: APLD Benefits and Outcomes • APLD helps pharmaceuticals companies in tactical and strategic decision-making by: Providing valuable physician behavior in- sights to develop comprehensive and proac- tive messaging strategies for improved phy- sician segmentation and targeting. Validating the insights obtained from prima- ry market research by replicating the busi- ness KPIs using APLD as secondary data. Delivering a quantitative estimate of the rev- enue potential in chronic disease markets with the ability to link disease diagnosis and treatment data. Leveraging the granularity of APLD data to improve the accuracy of the brand’s sales forecast based on derived persistence and compliance rates. Enabling effective and focused targeting across patient and physician segments, resulting in improved ROI in promotional activities. • Physicians can infer the treatment outcomes of various therapies at the aggregate population and patient levels so that they can personal- ize treatment approaches to different types of patients. • Patients will benefit through improved treatment outcomes, better experiences and better engagement. • ACOs will be able to measure effectiveness of treatment to differentiate drug potential to optimize formulary and treatment recommen- dations for physicians. Footnotes 1 http://www.fiercebigdata.com/story/obamacare-spurs-growth-data-analytics/2013-09-10 2 http://www.todaysgeriatricmedicine.com/archive/0115p12.shtml 3 https://www.digitalnewsasia.com/insights/four-top-trends-in-healthcare-data-analysis 4 http://www.pm360online.com/new-ways-to-evaluate-physicians/
- 6. About Cognizant Cognizant (NASDAQ: CTSH) is a leading provider of information technology, consulting, and business process outsourcing services, dedicated to helping the world’s leading companies build stronger busi- nesses. Headquartered in Teaneck, New Jersey (U.S.), Cognizant combines a passion for client satisfac- tion, technology innovation, deep industry and business process expertise, and a global, collaborative workforce that embodies the future of work. With over 100 development and delivery centers worldwide and approximately 218,000 employees as of June 30, 2015, Cognizant is a member of the NASDAQ-100, the SP 500, the Forbes Global 2000, and the Fortune 500 and is ranked among the top performing and fastest growing companies in the world. Visit us online at www.cognizant.com or follow us on Twitter: Cognizant. World Headquarters 500 Frank W. Burr Blvd. Teaneck, NJ 07666 USA Phone: +1 201 801 0233 Fax: +1 201 801 0243 Toll Free: +1 888 937 3277 Email: inquiry@cognizant.com European Headquarters 1 Kingdom Street Paddington Central London W2 6BD Phone: +44 (0) 20 7297 7600 Fax: +44 (0) 20 7121 0102 Email: infouk@cognizant.com India Operations Headquarters #5/535, Old Mahabalipuram Road Okkiyam Pettai, Thoraipakkam Chennai, 600 096 India Phone: +91 (0) 44 4209 6000 Fax: +91 (0) 44 4209 6060 Email: inquiryindia@cognizant.com © Copyright 2015, Cognizant. All rights reserved. No part of this document may be reproduced, stored in a retrieval system, transmitted in any form or by any means, electronic, mechanical, photocopying, recording, or otherwise, without the express written permission from Cognizant. The information contained herein is subject to change without notice. All other trademarks mentioned herein are the property of their respective owners. TL Codex 1494 About the Authors Srikanth Kumar Konduri is an Engagement Manager within the Cognizant Analytics Practice, specializ- ing in life sciences and healthcare analytics. He has more than five years of analytics experience working with global pharmaceuticals, healthcare and high-technology companies, on assignments spanning sales force effectiveness, audit reporting, promotion efficacy measurements, campaign management and patient data analytics. Srikanth holds an M.B.A. in finance from the Institute of Management Technology, Ghaziabad, and a bachelor’s degree in electrical and electronics engineering from JNT University, Hyderabad. He can be reached at Srikanth.Konduri@cognizant.com. Reemanshu Sharma is an Associate within the Cognizant Analytics Practice, focused on life sciences and healthcare. She has more than five years of experience in data analytics and customer insight, where she has gained extensive experience involving sales management, market research and patient analytics. Reemanshu holds an M.B.A. in finance from ICFAI Business School, Hyderabad, and a bachelor’s degree in electronics and communication engineering from UPT University, Lucknow. She can be reached at Reemanshu.Sharma@cognizant.com. Yuvaraj Natarajan is an Associate within the Cognizant Analytics Practice, focused on life sciences and healthcare. He has more than five years of experience in data analytics and audit reporting, working across the areas of sales force effectiveness, physician affiliation management and patient claims analytics. Yuvaraj holds an M.B.A. in marketing from Bangalore Management Academy and a bachelor’s degree in mechanical engineering from Anna University, Chennai. He can be reached at Yuvaraj.Natarajan@cognizant.com.