Maximizing Supply Chain Performance in the Transportation and Logistics Industry
•
2 j'aime•769 vues


Recommandé
Recommandé
Contenu connexe
Tendances
Tendances (18)
En vedette
Similaire à Maximizing Supply Chain Performance in the Transportation and Logistics Industry
Similaire à Maximizing Supply Chain Performance in the Transportation and Logistics Industry (20)
Plus de Cognizant
Plus de Cognizant (20)
Dernier
Dernier (20)
Maximizing Supply Chain Performance in the Transportation and Logistics Industry
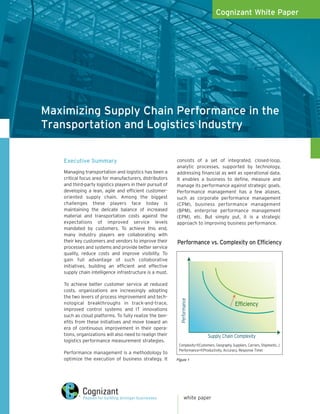
- 1. Cognizant White Paper Maximizing Supply Chain Performance in the Transportation and Logistics Industry Executive Summary consists of a set of integrated, closed-loop, analytic processes, supported by technology, Managing transportation and logistics has been a addressing financial as well as operational data. critical focus area for manufacturers, distributors It enables a business to define, measure and and third-party logistics players in their pursuit of manage its performance against strategic goals. developing a lean, agile and efficient customer- Performance management has a few aliases, oriented supply chain. Among the biggest such as corporate performance management challenges these players face today is (CPM), business performance management maintaining the delicate balance of increased (BPM), enterprise performance management material and transportation costs against the (EPM), etc. But simply put, it is a strategic expectations of improved service levels approach to improving business performance. mandated by customers. To achieve this end, many industry players are collaborating with their key customers and vendors to improve their Performance vs. Complexity on Efficiency processes and systems and provide better service quality, reduce costs and improve visibility. To gain full advantage of such collaborative initiatives, building an efficient and effective supply chain intelligence infrastructure is a must. To achieve better customer service at reduced costs, organizations are increasingly adopting the two levers of process improvement and tech- Performance nological breakthroughs in track-and-trace, Efficiency improved control systems and IT innovations such as cloud platforms. To fully realize the ben- efits from these initiatives and move toward an era of continuous improvement in their opera- tions, organizations will also need to realign their Supply Chain Complexity logistics performance measurement strategies. Complexity=f(Customers, Geography, Suppliers, Carriers, Shipments…) Performance=f(Productivity, Accuracy, Response Time) Performance management is a methodology to optimize the execution of business strategy. It Figure 1 white paper
- 2. Need for Performance Management of While most organizations have cost data at a Logistics Operations summary level, access to details are often found lacking. Drill-down data at lower levels is You Can’t Manage What You Can’t Measure required for identifying issues and for conduct- In spite of the increased focus on logistics by ing analysis on high-cost line items. Consistent most companies, the gap is widening between and credible data is required for organizations logistics cost leaders and laggards. Logistics to be able to make informed decisions. leaders are unlocking the value of the enterprise I Increasing emphasis on execution excellence across the value chain. Some of the key trends in the supply chain influencing logistics decisions are as follows: Speed is of the essence in the new order of supply chain management. Real-time flow of I Organizational focus on managing logistics information aids in shrinking costs cycle times and improving Today’s demanding The total cost of logistics for a typical compa- the response to changes and ny is 7% to 12% of sales1 and is growing due to exceptions. Service providers customers require not just increasing supply chain complexities. Thus, have to be quick to spot the fulfilment of requirements, there is an increased focus from corporate shift in market demands and but also cooperation and management on controlling and managing change their focus to rapidly alignment with their service this cost. Logistics costs typically follow eco- growing regions. At the same nomic cycles. During times of growth, the time, identifying issues in partners for mutual benefit available capacity becomes constrained, and stable markets and resolving and revenue growth. rates rise. When recession hits, rates fall due them before competitors to competition among service providers to uti- take away share is of paramount importance. lize the surplus capacity. Managing capacity Declining market share and revenue could be and utilization is often a tightrope walk for due to multiple factors, the identification of most service providers and proves to be a dif- which can turn out to be nightmare without ferentiating factor for most companies. having the mechanisms in place to capture and analyze the data. Logistics as Differentiator One Size Doesn’t Fit All Companies are increasingly looking at logistics The measurement of logistics operational for improving customer experience and for metrics varies widely from one company differentiation. Meeting service level to another. For example, in a survey of 247 agreements is a basic requirement for moving respondents conducted by Supply Chain from customer satisfaction to customer delight. Digest, only 40% said their primary Today’s demanding customers require not just measure of logistics costs is percent of fulfillment of requirements, but also cooperation sales. The other responses were split and alignment with their service partners for among measuring logistics costs as mutual benefit and revenue growth. absolute costs, as a cost per unit of weight Sharing data with upstream and downstream (hundred weights, kilograms, etc.), cost partners and aligning the key metrics across the per unit measure (case, unit) and activity- value chain are among the steps companies based costing as the primary measure. have taken in this direction. Industry leaders With such wide variation in measurement prefer to partner with logistics service providers of the basic metrics, it is no wonder that that are adept at moving in step with them. the logistics measurement used by one Measuring performance has gradually moved organization may not be suitable for from an internal focus on strategic objectives, to another. Even within the same industry, measuring performance across the value chain where processes might be similar, to include the upstream and downstream markedly different methods of measuring partners. In addition, the need to benchmark metrics exist. against industry leaders is forcing companies to look beyond home-grown solutions. white paper 2
- 3. Limitations of Current Performance Framework for Performance Management System Management Is This You? It’s All About the Process In a survey conducted by InformationWeek in All performance management systems have 2008, 91% of transportation and logistics three fundamental ingredients: companies deployed BI tools extensively. I Metrics: Up-to-the-minute snapshots of the However, only 46% of them expected to deliver key performance indicators (KPIs) in a per- better business intelligence to more employees, sonalized, Web-based dashboard to enable more quickly, in that year. The gap between fast, proactive decisions and organizational deployment and realization of benefits from the agility. same is very evident. Some operators are still I Business intelligence: Enterprise software dependent on outdated legacy applications designed to track, understand and manage and/or Excel-based tracking of metrics. Multiple information. BI enables decision makers to and independent applications such as WMS, manage by exception, stay informed with TMS, OMS, etc. are being used to deliver alerts and drill into data to examine the root analytics and generate reports. cause of business conditions. Due to these limitations, logistics planners do I Methodology: A systematic and sustainable not have a single view of the logistics chain and means of tracking, measuring and improving are not able to standardize reports for business performance, applied top-down comparison and dissemination. In addition, throughout the enterprise. third-party vendors and other service providers Our Logistics Performance Management (LPM) provide information in their own formats, framework helps organizations improve leading to inefficiencies and loss of productivity operational effectiveness by measuring the in consolidating and assimilating information right metrics in a timely manner. For an within the organization. Some of the current integrated LPM implementation, it is critical to systems and applications and their limitations have organizational alignment with a strongly are listed in Figure 2. communicated mission statement and an Current Offerings Limitations Home-grown solutions I Rudimentary tracking mechanisms I Excel-based reporting Service provider solutions I Narrow focus areas I Carrier tracking system for real-time location of shipments I Limited visibility I Cargo portals for booking and tracking visibility I Disparate metrics and KPIs for each solution, many of I EDI vendors which are not aligned with corporate objectives. I Supplier portals Application-based reporting tools I Limited reporting capabilities I Transportation management system I Silo-based approach to reporting I Fleet management system I Lack of flexibility and unable to customize I Few features I Varies from vendor to vendor Commercial visibility solutions I Small vendors I No coverage for entire logistics value chain On-demand visibility solutions I Higher running costs I Loss of data control EPM/BI/DW offerings from market-leading vendors I Single-vendor limitation I Lack of flexibility to utilize best-of-breed solutions Figure 2 3 white paper
- 4. I Selecting the right metrics: Care must be Unifying the On-Boarding Process taken while selecting the metrics and KPIs to reflect the key drivers of business value. This helps move the company in the right direction Link logistics to achieve the stated financial and organiza- measures tional goals. To be able to compare all metrics Map on a common footing, all operational KPIs Continuously improve logistics should translate to monetary measures and the process process be tied to an organization’s top and bottom line. This helps create a financial manage- Deploy Define and ment mindset within the company. Metrics appropriate measure selected must be based on corporate stan- technology KPIs dards that are universally defined and agreed upon by all stakeholders. Figure 3 I Creating a detailed metrics framework: Individual metrics can work at cross-purposes and lead to a sub-optimal result for the organi- understanding of how individual contributions zation, while trying to optimize individual effi- can meet corporate goals. ciencies. To prevent this, metrics must be tied together in a framework that transcends indi- Often, the implementation of LPM goes beyond vidual business units. Selected KPIs must cas- just solution implementation and configuration cade from top management to individual and is also accompanied by organizational metrics of each and every individual in an transformation. Process-centric management organization. This helps ensure that everyone consulting along with technical systems at every level is moving together in the right integration is required for organizational direction to deliver maximum value to the alignment and effective change management organization as a whole. Also, measurements (see Figure 4, below). made should be defined with contexts of upper What follows is a cross-section of best practices and lower limits, internal or external bench- for implementing a performance management marks and/or previous trends for the metrics. solution, based on our experience working with I Designing a robust solution: Dashboard design a few industry leaders. and metrics layout is usually not given much A High-Level Architecture for Logistics Performance Management Web Browser Documents Other Interfaces User (Rich PDF’s, Spreadsheets) (Mobiles, Handhelds) Interfaces Dashboards, scorecards, reports, alert tools, queries and filters Dashboards Strategize Plan Analyze Respond Metrics Builder Capacity Consolidations Status Alignment with Contracts & Rollups Alerts Organization Commitments Multi Dimensional Performance Enablers Data Flow Strategy Rates & Routings Analysis Improvements Metrics Hierarchy Root Cause Analysis LPM Data Storage Data Logical Data Model Physical Data Model Data Marts Models Extract, Transform and Load (ETL) Layer Loading Staging Layer Work Table Layer Layer Legacy Data ERP, CRM, Spreadsheets, External Source Systems Warehouses SCM Documents Sources Layer Figure 4 white paper 4
- 5. thought and often takes place without end- or for the organization as a whole. By enabling user involvement. A well-designed front end, the user to change perspective with the click however, can deliver results beyond mere aes- of a button, analysis of the same issue from thetics by aiding users in quickly identifying different dimensions is made possible. Finally, and disseminating information. An intuitive top management should communicate the flow for drill-downs and dimensional analysis goals and objectives of the performance man- helps save time and effort and eliminates the agement solution to all employees for effec- need for most analyses. tively leveraging the solution. A robust back-end extract, transform and load A conceptual model of logistics services for (ETL) layer leads to consistent and more accu- implementing a performance management rate results by eliminating disparate sources solution is shown in Figure 5, next page. for data. While selecting the met- The implementation of LPM rics, designers should ensure Cognizant’s Clarity Value Discovery Assessment often goes beyond just they are calculable and that base framework helps companies achieve the four solution implementation data is available for the same. key objectives of efficiency, effectiveness, Also, the data should be clean or virtualization and innovation. The Clarity and configuration and is diamond (see Figure 6, next page) depicts some should be cleansed before being also accompanied by orga- put to use. A flexible data model of the key areas for business transformation nizational transformation. ensures that the solution can be that create higher levels of value for our clients. tweaked with changes in business scenarios and changing business rules. Having This robust performance management solution placeholders for additional data elements is yields multiple dividends for the organization. It one such method for ensuring flexibility. Implementation should preferably be carried out in phases. Modules that can help with Corporate Performance quick wins should be targeted, along with crit- Management: A Single View ical areas offering the largest scope for Across the Organization improvement. Initial baselining of the solution should be performed, followed up by fine-tun- We implemented a CPM solution for one of ing of a complete solution to achieve desired our marquee clients in the transportation results. The staged approach also gives the and logistics industry to demonstrate the organization time to develop a dynamic per- impact of an individual on key areas of vol- formance management mentality. ume, service, safety and contribution. The solution covered almost all business areas Leveraging the solution: Users should be I of the organization and provided frontline adequately trained and instructed on the associates visibility into their personal met- solution. BI-based decision making can help rics aligned with enterprise goals. improve organizational efficiency and effec- Dashboards and scorecards were available tiveness. Periodic monitoring for for individual users and their supervisors to While selecting metrics, deviations is aided with the help effectively coach and monitor. The solution also provided a comparison with enterprise, designers should ensure of root cause analysis of fre- quently occurring issues. BI solu- as well as personal goals. It also offered that they are ‘calculable’ tions that allow for drill-down drill-downs and drill-outs to diagnose per- and that base data is and drill-through analysis of the formance. By providing a rich graphical end available for them. metrics can aid in this. Alerts and user experience, a high-performance envi- e-mails can help proactively ronment was created, changing the way the inform users about issues without the need to business was managed. Front-line associ- log in and view the reports. Capabilities to ates were able to make balanced and ration- view single metrics across multiple dimen- al day-to-day decisions based on the sions can help in dissecting issues. performance reports. For example, on-time pickup can be measured The solution won the DM Review Innovative from the perspective of the carrier, the plant Solutions 2008 award. or the warehouse, either for a particular area 5 white paper
- 6. Conceptual Model – Logistics Service Have bill-to details in Correction Bill To Have invoice adjustment details in Memo Have customer details in Billing Customer Have payment details in Payment Have shipper details in Store invoice details in Shipper Have consignee details in Consignee Have product details in Product Have Shipment details in Shipment Order Line of Details Business Have LOB details in Details Have accessorial details in Accessorials Have carrier Have Shipment Status details in (LOB) details in Have order status Have third-party Have shipper LOC details in details in details in Third party Carrier Mode eta nt n te d me ils i rou ve ship Have shipment Have Driver Damage/ details in damage/claims Claims Ha details in Order Status Driver Route Shipment Details Details Status Figure 5 provides better visibility into operations, leading of-business managers to identify problems and to improved efficiency and better decision- drill down to their root cause. An integrated making, using up-to-date information. A performance management solution helps well-designed dashboard and scorecard enables individuals and department heads measure the top management to make well-informed decisions performance of their departments against defined regarding their business in terms of identifying service levels. In addition, the flexibility to adapt to profitable customers; the performance of changing business scenarios helps capture the products, services and geographical regions; and right metrics to facilitate business, as well as opportunities for improving relationships with modify or create new metrics to be in alignment carriers/partners. Drill-down capabilities help line- with business changes. Leveraging the Clarity Framework for LPM Improve Capital Utilization Virtualization I Application rationalization/infrastructure consolidation I Integrating disparate applications, multiple source systems & differing tech to provide a ‘single view’ I Using SaaS solutions/cloud platform Effectiveness Innovation Productivity/ Quality Revenue Enhancement Improvement I Analyze lanes, businesses, I Using a ‘single source of geographies, etc. to fine tune truth’ for consistent results the business strategy I Enable drill down I Use of best practices from features for analyzing Reduced Costs experience in award-winning causes I Reduced time for implementations implementation leading to Efficiency improved returns on investment I Pre-built framework built by domain experts well versed in Logistics BI I Identify cost saving measures in each LoB Figure 6 white paper 6
- 7. Performance Management Benefits Using the LPM Framework Rollout and training to end users Define metrics and dashboard Rollout and Easy-to-use and ready-to-use training material training DW design, logical and Define Predefined list of metrics and KPIs which can be tweaked to individual physical data metrics and company needs. Dashboards developed in standard industry tools. models dashboard DW design, logical and Readily adaptable logical and physical data model for physical data transportation and logistics domain. Back-end ETL models and mapping to source Back-end ETL and legacy and mapping Prebuilt business adaptors for Informatica, systems to source and legacy Oracle, PeopleSoft, Seibel, SAP, etc. systems Figure 7 Our Logistics Performance Management deployment, reduced total cost of ownership and framework helps reduce implementation time by improved returns on investment by saving time utilizing pre-built process and technological and effort in implementation (see Figure 7). components. It aids organizations in faster Footnotes 1 “Logistics Cost and Service: 2008,” a presentation by the Council of Supply Chain Management Professionals. Resources Business Performance Management, Industry Framework Document, BPM Standards Group. “KPI-Driven Supply Chains: How to Master Complexity, Optimize Inventories and Meet Rising Customer Expectations,” white paper, CDC Software. Chris Caplice, Yossi Sheffi, (1995) “A Review and Evaluation of Logistics Performance Measurement Systems," International Journal of Logistics Management, Vol. 6 Issue 1, pp.61 – 74. About the Author Anand Kalathil, CPIM, CSCP, is an Associate Consultant with the Manufacturing and Logistics Practice within Cognizant Business Consulting. He has worked with leading transportation and logistics providers and has been instrumental in developing industry solution accelerators in the performance management domain. His key areas of expertise include supply chain consultancy, business process modeling, analytics and BI. Kalathil holds a bachelor’s degree in Mechanical Engineering from the National Institute of Technology-Kurukshetra and has a post-graduate diploma in Industrial Management from NITIE, Mumbai. He can be reached at anand.kalathil@cognizant.com. 7 white paper
- 8. About Cognizant Cognizant (NASDAQ: CTSH) is a leading provider of information technology, consulting and business process outsourcing services. Cognizant’s single-minded passion is to dedicate our global technology and innovation know-how, our industry expertise and worldwide resources to working together with clients to make their businesses stronger. With over 50 global delivery centers and approximately 88,700 employees as of June 30, 2010, we combine a unique global delivery model infused with a distinct culture of customer satisfaction. A member of the NASDAQ-100 Index and S&P 500 Index, Cognizant is a Forbes Global 2000 company and a member of the Fortune 1000 and is ranked among the top information technology companies in BusinessWeek’s Hot Growth and Top 50 Performers listings. Start Today For more information on how to drive your business results with Cognizant, contact us at inquiry@cognizant.com or visit our website at www.cognizant.com. World Headquarters European Headquarters India Operations Headquarters 500 Frank W. Burr Blvd. Haymarket House #5/535, Old Mahabalipuram Road Teaneck, NJ 07666 USA 28-29 Haymarket Okkiyam Pettai, Thoraipakkam Phone: +1 201 801 0233 London SW1Y 4SP UK Chennai, 600 096 India Fax: +1 201 801 0243 Phone: +44 (0) 20 7321 4888 Phone: +91 (0) 44 4209 6000 Toll Free: +1 888 937 3277 Fax: +44 (0) 20 7321 4890 Fax: +91 (0) 44 4209 6060 Email: inquiry@cognizant.com Email: infouk@cognizant.com Email: inquiryindia@cognizant.com © Copyright 2010, Cognizant. All rights reserved. No part of this document may be reproduced, stored in a retrieval system, transmitted in any form or by any means, electronic, mechanical, photocopying, recording, or oth- erwise, without the express written permission from Cognizant. The information contained herein is subject to change without notice. All other trademarks mentioned herein are the property of their respective owners.